San Diego County, California
| San Diego County | ||||||||
|---|---|---|---|---|---|---|---|---|
| County | ||||||||
| County of San Diego | ||||||||
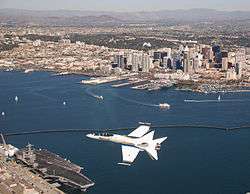
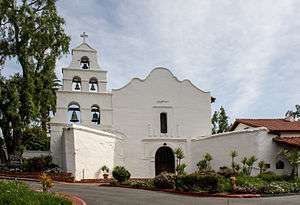
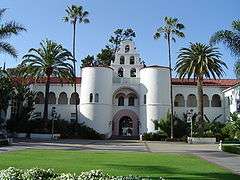
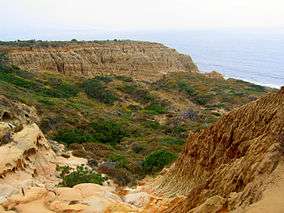
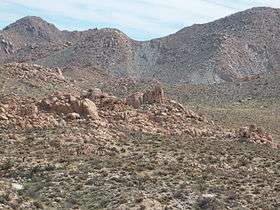
Images, from top down, left to right: F/A-18 Hornet flying over San Diego, Mission San Diego de Alcalá, San Diego State University's Hepner Hall, Hotel del Coronado's main building, Torrey Pines State Natural Reserve, Jacumba Mountains | ||||||||
| ||||||||
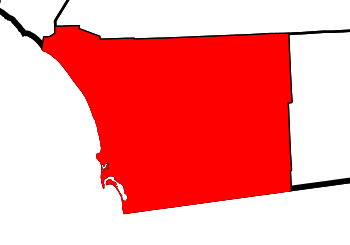
 Location in the U.S. state of California | ||||||||
 California's location in the United States | ||||||||
| Coordinates: 33°01′N 116°46′W / 33.02°N 116.77°WCoordinates: 33°01′N 116°46′W / 33.02°N 116.77°W | ||||||||
| Country |
| |||||||
| State |
| |||||||
| Formed | February 18, 1850[1] | |||||||
| County seat | San Diego | |||||||
| Largest city | San Diego | |||||||
| Government | ||||||||
| • Type | Council–manager | |||||||
| • Body | Board of Supervisors | |||||||
| • Board of Supervisors[2] |
Supervisors
| |||||||
| • Chief Administrative Officer | Helen Robbins-Meyer[3] | |||||||
| Area | ||||||||
| • Total | 4,526 sq mi (11,720 km2) | |||||||
| • Land | 4,207 sq mi (10,900 km2) | |||||||
| • Water | 319 sq mi (830 km2) | |||||||
| Highest elevation[4] | 6,536 ft (1,992 m) | |||||||
| Population (April 1, 2010)[5] | ||||||||
| • Total | 3,299,521 | |||||||
| • Estimate (2015)[5] | 3,299,521 | |||||||
| • Density | 730/sq mi (280/km2) | |||||||
| Time zone | Pacific Time Zone (UTC-8) | |||||||
| • Summer (DST) | Pacific Daylight Time (UTC-7) | |||||||
| Area codes | 442/760, 619, 858, and 949 | |||||||
| FIPS code | 06-073 | |||||||
| GNIS feature ID | 277301 | |||||||
| Website |
www | |||||||

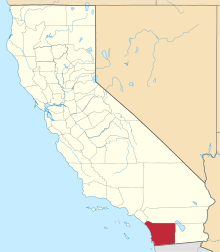
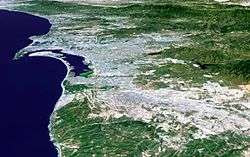
San Diego County is a county located in the southwestern corner of the state of California, in the United States. As of the 2010 census, the population was 3,095,313.[5] making it the second-most populous county in California and the fifth-most populous in the United States. Its county seat is San Diego,[6] the eighth-most populous city in the United States. It is the south-westernmost county in the 48 contiguous United States.
San Diego County comprises the San Diego-Carlsbad Metropolitan Statistical Area.[7] The San Diego-Carlsbad, CA Metropolitan Statistical Area as the 17th most populous metropolitan statistical area and the 18th most populous primary statistical area of the United States as of July 1, 2012.[8][9] San Diego is also part of the San Diego–Tijuana metropolitan area, the largest metropolitan area shared between the United States and Mexico. Greater San Diego ranks as the 38th largest metropolitan area in the Americas.
San Diego County has 70 miles (110 km) of coastline. Most of the county has a mild Mediterranean climate to semiarid climate, though there are mountains that receive frost and snow in the wintertime.[10]
There are also 16 naval and military installations of the U.S. Navy, U.S. Marine Corps, and the U.S. Coast Guard in San Diego County. These include the Naval Base San Diego, Marine Corps Base Camp Pendleton, Marine Corps Air Station Miramar, and Naval Air Station North Island.
From north to south, San Diego County extends from the southern borders of Orange County and Riverside County to the Mexico–United States border and Baja California. From west to east, San Diego County stretches from the Pacific Ocean to its boundary with Imperial County.
History
The area which is now San Diego County has been inhabited for more than 10,000 years by Kumeyaay (also called Diegueño), Luiseño, Cupeño and Cahuilla Indians.[11]
In 1542, the Portuguese-born explorer Juan Rodríguez Cabrillo, sailing for Spain, claimed San Diego Bay for the Spanish Empire, and he named the site San Miguel.[12] In November 1602, Sebastián Vizcaíno surveyed the harbor and what are now Mission Bay and Point Loma and named the area for Saint Didacus, a Spaniard more commonly known as San Diego.[13] European settlement in what is now San Diego County began with the founding of the San Diego Presidio and Mission San Diego de Alcalá by Spanish soldiers and clerics in 1769.[14] This county was part of Alta California under the Viceroyalty of New Spain until the Mexican declaration of independence. From 1821 through 1848 this area was part of Mexico.
San Diego County became part of the United States as a result of the Treaty of Guadalupe Hidalgo in 1848, ending the U.S.-Mexican War. This treaty designated the new border as terminating at a point on the Pacific Ocean coast which would result in the border passing one Spanish league south of the southernmost portion of San Diego Bay, thus ensuring that the United States received all of this natural harbor.
San Diego County was one of the original counties of California, and it was created at the time of California statehood in 1850.[15]:221
At the time of its establishment in 1850, San Diego County was relatively large, and included all of southernmost California which was south and east of Los Angeles County. As such it included areas of what are now Inyo County and San Bernardino County, as well as all of what is now Riverside County and Imperial County.[15]:221
During the later part of the 19th century, there were numerous changes in the boundaries of San Diego County, when various areas became separated for the counties mentioned above. The most recent changes were the establishments of Riverside County in 1893[15]:207 and Imperial County in 1907.[15]:113 Imperial County was also the last county to be established in California, and after this division, San Diego no longer extended from the Pacific Ocean to the Colorado River, and it no longer covered the entire border between California and Mexico.
Geography
According to the U.S. Census Bureau, the county has a total area of 4,526 square miles (11,720 km2), of which 4,207 square miles (10,900 km2) is land and 319 square miles (830 km2) (7.0%) is water.[16] The county is larger in area than the combined states of Rhode Island and Delaware.[17]
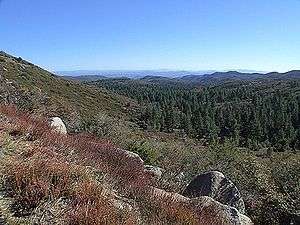
San Diego County has a varied topography. On its western side is 70 miles (110 km) of coastline.[18] Most of San Diego between the coast and the Laguna Mountains consists of hills, mesas, and small canyons. Snow-capped (in winter) mountains rise to the northeast, with the Sonoran Desert to the far east. Cleveland National Forest is spread across the central portion of the county, while the Anza-Borrego Desert State Park occupies most of the northeast. Although the western third of the county is primarily urban, the mountains and deserts in the eastern two-thirds of the county consist primarily of undeveloped backcountry. Most of these backcountry areas are home to a native plant community known as chaparral. San Diego County contains more than a million acres (4,000 km²) of chaparral, twice as much as any other California county.[19]
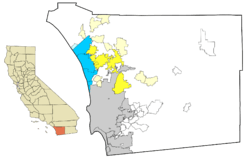
North San Diego County is known as North County; the exact geographic definitions of "North County" vary, but it includes the northern suburbs and sometimes certain northern neighborhoods of the City of San Diego.
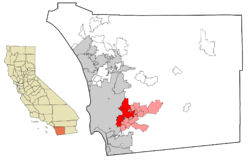
The eastern suburbs are collectively known as East County, though most still lie in the western third of the county. The southern suburbs and southern detached portion of the city of San Diego, extending to the Mexican border, are collectively referred to as South Bay.
Periodically the area has been subject to wildfires that force thousands to evacuate. The most recent are the May 2014 San Diego County wildfires; before them was the Witch Creek Fire in 2007 and the Cedar Fire in 2003. California defines a fire season in which fires are most likely to occur, usually between the months of late July and late October (which are the driest months of the area). Signs are posted in numerous spots of the county providing information on the level of threats from fires based on weather conditions.
Climate
Under the Köppen climate classification system, the San Diego area straddles areas of Mediterranean climate (CSa) to the north and semi-arid climate (BSh) to the south and east.[20] As a result, it is often described as "arid Mediterranean" and "semi-arid steppe". San Diego's climate is characterized by warm, dry summers and mild winters with most of the annual precipitation falling between November and March. The city has mild, mostly dry weather, with an average of 201 days above 70 °F (21 °C) and low rainfall (9–13 inches (23–33 cm) annually). Summer temperatures are generally warm, with average highs of 70–78 °F (21–26 °C) and lows of 55–66 °F (13–19 °C). Temperatures exceed 90 °F (32 °C) only four days a year. Most rainfall occurs from November to April. Winter temperatures are mild, with average high temperatures of 66–70 °F (19–21 °C) and lows of 50–56 °F (10–13 °C).
The climate in the San Diego area, like much of California, often varies significantly over short geographical distances resulting in microclimates. In San Diego's case this is mainly due to the city's topography (the Bay, and the numerous hills, mountains, and canyons). Frequently, particularly during the "May gray/June gloom" period, a thick marine layer will keep the air cool and damp within a few miles of the coast, but will yield to bright cloudless sunshine approximately 5–10 miles (8.0–16.1 km) inland. This happens every year in May and June.[21] Even in the absence of June gloom, inland areas tend to experience much more significant temperature variations than coastal areas, where the ocean serves as a moderating influence. Thus, for example, downtown San Diego averages January lows of 50 °F (10 °C) and August highs of 78 °F (26 °C). The city of El Cajon, just 10 miles (16 km) northeast of downtown San Diego, averages January lows of 42 °F (6 °C) and August highs of 88 °F (31 °C).[22][23]
Rainfall along the coast averages about 10 inches (25 cm) of precipitation annually, which occurs mainly during the cooler months of December through April. Though there are few wet days per month during the rainy period, rainfall can be heavy when it does occur. However, the rainfall is greater in the higher elevations of San Diego. Some of the higher areas of San Diego can receive 11–13 inches (28–33 cm) of rain a year.
| Climate data for San Diego Int'l Airport (1981–2010 normals,[lower-alpha 1] extremes 1874–present)[lower-alpha 2] | |||||||||||||
|---|---|---|---|---|---|---|---|---|---|---|---|---|---|
| Month | Jan | Feb | Mar | Apr | May | Jun | Jul | Aug | Sep | Oct | Nov | Dec | Year |
| Record high °F (°C) | 88 (31) |
90 (32) |
99 (37) |
98 (37) |
98 (37) |
101 (38) |
100 (38) |
98 (37) |
111 (44) |
107 (42) |
100 (38) |
88 (31) |
111 (44) |
| Mean maximum °F (°C) | 78.4 (25.8) |
79.2 (26.2) |
79.8 (26.6) |
82.8 (28.2) |
79.0 (26.1) |
81.2 (27.3) |
83.2 (28.4) |
85.4 (29.7) |
89.5 (31.9) |
86.8 (30.4) |
82.9 (28.3) |
76.6 (24.8) |
94.1 (34.5) |
| Average high °F (°C) | 65.1 (18.4) |
65.0 (18.3) |
65.6 (18.7) |
67.5 (19.7) |
68.5 (20.3) |
70.8 (21.6) |
74.6 (23.7) |
76.4 (24.7) |
75.9 (24.4) |
72.8 (22.7) |
69.0 (20.6) |
64.7 (18.2) |
69.7 (20.9) |
| Average low °F (°C) | 49.0 (9.4) |
50.7 (10.4) |
53.2 (11.8) |
55.9 (13.3) |
59.4 (15.2) |
62.0 (16.7) |
65.4 (18.6) |
66.7 (19.3) |
65.2 (18.4) |
60.6 (15.9) |
53.6 (12) |
48.4 (9.1) |
57.5 (14.2) |
| Mean minimum °F (°C) | 41.9 (5.5) |
44.6 (7) |
47.1 (8.4) |
50.7 (10.4) |
55.0 (12.8) |
59.1 (15.1) |
62.5 (16.9) |
63.3 (17.4) |
60.4 (15.8) |
54.4 (12.4) |
45.8 (7.7) |
41.4 (5.2) |
40.3 (4.6) |
| Record low °F (°C) | 25 (−4) |
34 (1) |
36 (2) |
39 (4) |
45 (7) |
50 (10) |
54 (12) |
54 (12) |
50 (10) |
43 (6) |
36 (2) |
32 (0) |
25 (−4) |
| Average rainfall inches (mm) | 1.98 (50.3) |
2.27 (57.7) |
1.81 (46) |
0.78 (19.8) |
0.12 (3) |
0.07 (1.8) |
0.03 (0.8) |
0.02 (0.5) |
0.15 (3.8) |
0.57 (14.5) |
1.01 (25.7) |
1.53 (38.9) |
10.34 (262.6) |
| Average rainy days (≥ 0.01 in) | 6.7 | 7.1 | 6.5 | 4.0 | 1.4 | 0.8 | 0.7 | 0.4 | 1.2 | 2.8 | 4.1 | 5.8 | 41.5 |
| Average relative humidity (%) | 63.1 | 65.7 | 67.3 | 67.0 | 70.6 | 74.0 | 74.6 | 74.1 | 72.7 | 69.4 | 66.3 | 63.7 | 69.0 |
| Mean monthly sunshine hours | 239.3 | 227.4 | 261.0 | 276.2 | 250.5 | 242.4 | 304.7 | 295.0 | 253.3 | 243.4 | 230.1 | 231.3 | 3,054.6 |
| Percent possible sunshine | 75 | 74 | 70 | 71 | 58 | 57 | 70 | 71 | 68 | 69 | 73 | 74 | 69 |
| Source: NOAA (sun and relative humidity 1961–1990)[25][26][27] | |||||||||||||
Adjacent counties and municipalities
National protected areas
- Cabrillo National Monument
- Cleveland National Forest (part)
- San Diego National Wildlife Refuge Complex,[28] which includes
There are 7 official wilderness areas in San Diego County that are part of the National Wilderness Preservation System. Four of these are integral parts of Cleveland National Forest, whereas three are managed by the Bureau of Land Management. Some of these extend into neighboring counties (as indicated below):
- Otay Mountain Wilderness (BLM)
- Pine Creek Wilderness (Cleveland National Forest)
- Hauser Wilderness (Cleveland National Forest)
- Carrizo Gorge Wilderness (BLM)
- Sawtooth Mountains Wilderness (BLM)
- Agua Tibia Wilderness (Cleveland National Forest) partly in Riverside County
- San Mateo Canyon Wilderness (Cleveland National Forest) mostly in Riverside County
State parks and protected areas
- Anza-Borrego Desert State Park (part)
- Torrey Pines State Reserve
- Cuyamaca Rancho State Park
- Palomar Mountain State Park
- San Pasqual Battlefield State Historic Park
- Old Town San Diego State Historic Park
- Border Field State Park
- Tijuana River Natural Estuarine Research Reserve
- San Onofre State Beach
- Moonlight State Beach
- Carlsbad State Beach
- South Carlsbad State Beach
- Leucadia State Beach
- San Elijo State Beach
- Cardiff State Beach
- Torrey Pines State Beach
- Silver Strand State Beach
Mountains
There are 236 mountain summits and peaks in San Diego County[33] including:
- Black Mountain
- Cuyamaca Peak (second highest point in San Diego County)
- Cowles Mountain (highest point in the city of San Diego)
- Mount Helix
- Hot Springs Mountain (highest point in San Diego County)
- Margarita Peak
- Mount Soledad
- Stonewall Mountain
Bays and lagoons
Lakes
- Lake Cuyamaca
- Lake Hodges
- Santee Lakes
- Sweetwater Reservoir
- Otay Lakes
- Lake Wohlford
- El Capitan Reservoir
- Sutherland Reservoir
- Lake Henshaw
- Lake Murray
- San Vicente Reservoir
- Lake Jennings
- Barrett Reservoir
- Natural Rock Tanks
- Little Laguna Lake
- Big Laguna Lake
- Big Lake
- Twin Lakes
- Jean, Lake
- Lost Lake
- Swan Lake
- Lake Miramar
- Lake Poway
- Dixon Lake
Rivers
- San Diego River
- San Luis Rey River
- San Dieguito River
- Sweetwater River (California)
- Otay River
- Tijuana River
- Santa Margarita River
Demographics
Half of the county's population lives in San Diego and Chula Vista. In 2000, only about 3% of San Diego County residents left the county for work while 40,000 people commuted into the metropolitan area.[34]
| Population, race, and income (2011) | |||||
|---|---|---|---|---|---|
| Total population[35] | 3,060,849 | ||||
| White[35] | 2,182,604 | 71.3% | |||
| Hispanic or Latino (of any race)[36] | 967,858 | 31.6% | |||
| Asian[35] | 333,314 | 10.9% | |||
| Black or African American[35] | 154,076 | 5.0% | |||
| American Indian or Alaska Native[35] | 20,597 | 0.7% | |||
| Native Hawaiian or other Pacific Islander[35] | 14,266 | 0.5% | |||
| Some other race[35] | 220,000 | 7.2% | |||
| Two or more races[35] | 135,992 | 4.4% | |||
| Per capita income[37] | $30,955 | ||||
| Median household income[38] | $63,857 | ||||
| Median family income[39] | $74,633 | ||||
| Historical population | |||
|---|---|---|---|
| Census | Pop. | %± | |
| 1850 | 798 | — | |
| 1860 | 4,324 | 441.9% | |
| 1870 | 4,951 | 14.5% | |
| 1880 | 8,018 | 61.9% | |
| 1890 | 34,987 | 336.4% | |
| 1900 | 35,090 | 0.3% | |
| 1910 | 61,665 | 75.7% | |
| 1920 | 112,248 | 82.0% | |
| 1930 | 209,659 | 86.8% | |
| 1940 | 289,348 | 38.0% | |
| 1950 | 556,808 | 92.4% | |
| 1960 | 1,033,011 | 85.5% | |
| 1970 | 1,357,854 | 31.4% | |
| 1980 | 1,861,846 | 37.1% | |
| 1990 | 2,498,016 | 34.2% | |
| 2000 | 2,813,833 | 12.6% | |
| 2010 | 3,095,313 | 10.0% | |
| Est. 2015 | 3,299,521 | [40] | 6.6% |
| U.S. Decennial Census[41] 1790–1960[42] 1900–1990[43] 1990–2000[44] 2010–2015[5] | |||
Race
The 2010 United States Census reported that San Diego County had a population of 3,095,313. The racial makeup of San Diego County was 1,981,442 (64.0%) White, 158,213 (5.1%) African American, 26,340 (0.9%) Native American, 336,091 (10.9%) Asian (4.7% Filipino, 1.6% Chinese, 1.4% Vietnamese, 3.2% Other Asian), 15,337 (0.5%) Pacific Islander, 419,465 (13.6%) from other races, and 158,425 (5.0%) from two or more races. Hispanic or Latino of any race were 991,348 persons (32.0%).[45]
As of 2009, the racial makeup of the county was 79.4% White American, 5.6% Black or African American, 1% Native American, 10.4% Asian, 0.5% Pacific Islander, 10.3% from other races, and 3.6% from two or more races. 31.3% of the population were Hispanic or Latino of any race.
67.0% spoke only English at home; 21.9% spoke Spanish, 3.1% Tagalog and 1.2% Vietnamese.
Other demographics
As of 2009 Census Bureau estimates, there were 3,053,793 people, 1,067,846 households, and 663,449 families residing in the county. The population density was 670 people per square mile (259/km²). There were 1,142,245 housing units at an average density of 248 per square mile (96/km²).
In 2000 there were 994,677 households out of which 33.9% had children under the age of 18 living with them, 50.7% were married couples living together, 11.6% had a female householder with no husband present, and 33.3% were non-families. 24.2% of all households were made up of individuals and 7.9% had someone living alone who was 65 years of age or older. The average household size was 2.73 and the average family size was 3.29.
As of 2000, in the county the population was spread out with 25.7% under the age of 18, 11.30% from 18 to 24, 32.0% from 25 to 44, 19.8% from 45 to 64, and 11.2% who were 65 years of age or older. The median age was 33 years. For every 100 females there were 101.2 males. For every 100 females age 18 and over, there were 99.7 males.
Income
According to the 2000 Census, the median income for a household in the county was $47,067, and the median income for a family was $53,438. Males had a median income of $36,952 versus $30,356 for females. The per capita income for the county was $22,926. About 8.9% of families and 12.4% of the population were below the poverty line, including 16.5% of those under age 18 and 6.8% of those age 65 or over.
Much of the county's high-income residents are concentrated in the northern part of the city of San Diego. The San Diego metropolitan area has two places with a both a population of over 50,000 per capita income of over $40,000: Carlsbad and Encinitas.
The county's largest continuous high-income urban area is a triangle from a first point on the northern edge of Carlsbad, a second point southeast of Escondido, and a third point on the southern edge of La Jolla. It contains all or most of the cities of Carlsbad, Encinitas, Solana Beach, Del Mar, and Poway in addition to a substantial portion of northern San Diego.[46]
Government
The Government of San Diego County is defined and authorized under the California Constitution, California law, and the Charter of the County of San Diego.[47] Much of the Government of California is in practice the responsibility of county governments such as the Government of San Diego County. The County government provides countywide services such as elections and voter registration, law enforcement, jails, vital records, property records, tax collection, public health, and social services. In addition the County serves as the local government for all unincorporated areas.[48] Some chartered cities such as San Diego and Chula Vista provide municipal services such as police, public safety, libraries, parks and recreation, and zoning. Other cities such as Del Mar and Vista arrange to have the County provide some or all of these services on a contract basis.
The county government is composed of the elected five-member Board of Supervisors, several other elected offices and officers including the Sheriff, the District Attorney, Assessor/Recorder/County Clerk, and Treasurer/Tax Collector, and numerous county departments and entities under the supervision of the Chief Administrative Officer such as the Probation Department. In addition, several entities of the government of California have jurisdiction conterminous with San Diego County, such as the San Diego Superior Court.
Under its foundational Charter, the five-member elected San Diego County Board of Supervisors is the county legislature. The board operates in a legislative, executive, and quasi-judicial capacity. As a legislative authority, it can pass ordinances for the unincorporated areas (ordinances that affect the whole county, like posting of restaurant ratings, must be ratified by the individual city). As an executive body, it can tell the county departments what to do, and how to do it. As a quasi-judicial body, the Board is the final venue of appeal in the local planning process.
As of January 2013 the members of the San Diego County Board of Supervisors are:
- Greg Cox, District 1, Chairman
- Dianne Jacob, District 2
- Dave Roberts, District 3
- Ron Roberts, District 4 (no relation to Dave Roberts)
- Bill Horn, District 5
For several decades, ending in 2013, all five supervisors were Republican, white, graduates of San Diego State University, and had been in office since 1995 or earlier. The Board was criticized for this homogeneity, which was made possible because supervisors draw their own district lines and are not subject to term limits.[49] (In 2010 voters put term limits in place, but they only apply going forward, so that each incumbent supervisor can serve an additional two terms before being termed out.[50]) That pattern was broken in 2013 when Slater-Price retired; she was replaced by Democrat Dave Roberts, who won election to the seat in November 2012 and was inaugurated in January 2013.[51]
The San Diego County Code is the codified law of San Diego County in the form of ordinances passed by the Board of Supervisors. The Administrative Code establishing the powers and duties of all officers and the procedures and rules of operation of all departments.
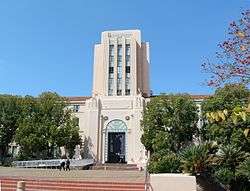
The county motto is "The noblest motive is the public good." County government offices are housed in the historic County Administration Center Building, constructed in 1935-1938 with funding from the Works Progress Administration.[52]
Politics
| San Diego County registered voters (2014)[53] | ||
|---|---|---|
| Total population[35] | 3,060,849 | |
| Registered voters[53][note 1] | 1,530,462 | 50.0% |
| Democratic | 531,941 | 34.8% |
| Republican | 503,639 | 32.9% |
| Democratic–Republican spread | +28,302 | +1.9% |
| No party preference | 412,807 | 27.0% |
| American Independent | 52,088 | 3.4% |
| Libertarian | 12,484 | 0.8% |
| Green | 7,668 | 0.5% |
| Other | 5,695 | 0.4% |
| Peace and Freedom | 4,140 | 0.3% |
As of June 2013, there are 1,556,739 registered voters in San Diego County. Of those, 547,897 (35.2%) are registered Democratic, 526,306 (33.8%) are registered Republican, 401,340 (25.8%) declined to state a political party, 51,993 (3.3%) are registered American Independence Party, 11,657 (0.7%) are registered Libertarian, 7,675 (0.5%) are registered Green, and 4,012 (0.3%) are registered Peace & Freedom.[54]
Voting
| Year | GOP | DEM | Others |
|---|---|---|---|
| 2016 | 37.1% 465,473 | 56.8% 712,214 | 6.0% 75,294 |
| 2012 | 45.0% 536,726 | 52.5% 626,957 | 2.5% 30,266 |
| 2008 | 43.8% 541,032 | 54.0% 666,581 | 2.3% 27,890 |
| 2004 | 52.5% 596,033 | 46.3% 526,437 | 1.2% 13,881 |
| 2000 | 49.6% 475,736 | 45.7% 437,666 | 4.7% 45,232 |
| 1996 | 45.8% 402,876 | 44.1% 389,964 | 10.3% 91,311 |
| 1992 | 35.7% 352,125 | 37.2% 367,397 | 27.1% 267,124 |
| 1988 | 60.2% 523,143 | 38.3% 333,264 | 1.5% 12,788 |
| 1984 | 65.3% 502,344 | 33.4% 257,029 | 1.3% 9,894 |
| 1980 | 60.8% 435,910 | 27.3% 195,410 | 11.9% 85,546 |
| 1976 | 55.7% 353,302 | 41.6% 263,654 | 2.7% 16,839 |
| 1972 | 61.8% 371,627 | 34.3% 206,455 | 3.8% 23,055 |
| 1968 | 56.3% 261,540 | 36.1% 167,669 | 7.7% 35,654 |
| 1964 | 50.3% 214,445 | 49.7% 211,808 | 0.0% 33 |
| 1960 | 56.4% 233,045 | 43.3% 171,259 | 0.3% 1,106 |
| 1956 | 64.5% 195,742 | 35.2% 106,716 | 0.4% 1,147 |
| 1952 | 63.5% 186,091 | 35.9% 105,255 | 0.6% 1,688 |
| 1948 | 49.4% 101,552 | 47.8% 98,217 | 2.8% 5,690 |
| 1944 | 45.4% 75,746 | 53.9% 89,959 | 0.6% 1,059 |
| 1940 | 43.3% 55,434 | 55.6% 71,188 | 1.2% 1,488 |
| 1936 | 35.0% 35,686 | 63.5% 64,628 | 1.5% 1,540 |
| 1932 | 41.5% 35,305 | 53.6% 45,622 | 5.0% 4,223 |
| 1928 | 67.1% 47,769 | 32.0% 22,749 | 0.9% 633 |
| 1924 | 49.0% 22,726 | 6.4% 2,944 | 44.7% 20,721 |
| 1920 | 63.8% 19,826 | 27.3% 8,478 | 9.0% 2,783 |
San Diego County has historically been a Republican stronghold. The Republican presidential nominee carried the county in every presidential election from 1948 through 2004, except in 1992 when Bill Clinton won a plurality. In 2008, Barack Obama became the first Democratic presidential candidate to win a majority of votes in San Diego County since World War II; he won a majority of county votes again in 2012.
The city of San Diego itself is more Democratic than the county's average and has voted for Democrats in each presidential election since 1992. Various cities within the county are swing areas that have split their votes in elections since 2000. Republican strength is concentrated in North County, as well as the inland portions.
One unique feature of the political scene is the use of Golden Hall, a convention facility next to San Diego's City Hall, as "Election Central." The County Registrar of Voters rents the hall to distribute election results. Supporters and political observers gather to watch the results come in; supporters of the various candidates parade around the hall, carrying signs and chanting; candidates give their victory and concession speeches and host parties for campaign volunteers and donors at the site; and television stations broadcast live from the floor of the convention center.[56] The atmosphere at Election Central on the evening of election day has been compared to the voting portion of a political party national convention.[57]
On Nov 4, 2008 San Diego County voted 53.8% for Proposition 8 which amended the California Constitution to ban same-sex marriages, thus restoring Proposition 22 which was overturned by a ruling from the California Supreme Court. However the city of San Diego, along with Del Mar, Encinitas, and Solana Beach, voted against Proposition 8.[58]
Federal and state representation
In the U.S. House of Representatives, San Diego County is split between five congressional districts:[59]
- California's 49th congressional district, represented by Republican Darrell Issa
- California's 50th congressional district, represented by Republican Duncan D. Hunter
- California's 51st congressional district, represented by Democrat Juan Vargas
- California's 52nd congressional district, represented by Democrat Scott Peters and
- California's 53rd congressional district, represented by Democrat Susan Davis.
In the California State Assembly, San Diego County is split between seven legislative districts:[60]
- the 71st Assembly District, represented by Republican Randy Voepel,
- the 75th Assembly District, represented by Republican Marie Waldron,
- the 76th Assembly District, represented by Republican Rocky Chávez,
- the 77th Assembly District, represented by Republican Brian Maienschein,
- the 78th Assembly District, represented by Democrat Todd Gloria,
- the 79th Assembly District, represented by Democrat Shirley Weber, and
- the 80th Assembly District, represented by Democrat Lorena Gonzalez.
In the California State Senate, San Diego County is split between four legislative districts:[61]
- the 36th Senate District, represented by Republican Patricia Bates,
- the 38th Senate District, represented by Republican Joel Anderson,
- the 39th Senate District, represented by Democrat Toni Atkins, and
- the 40th Senate District, represented by Democrat Ben Hueso.
Crime
The following table includes the number of incidents reported and the rate per 1,000 persons for each type of offense.
| Population and crime rates | ||
|---|---|---|
| Population[35] | 3,060,849 | |
| Violent crime[62] | 12,775 | 4.17 |
| Homicide[62] | 75 | 0.02 |
| Forcible rape[62] | 746 | 0.24 |
| Robbery[62] | 4,033 | 1.32 |
| Aggravated assault[62] | 7,921 | 2.59 |
| Property crime[62] | 43,525 | 14.22 |
| Burglary[62] | 14,522 | 4.74 |
| Larceny-theft[62][note 2] | 41,278 | 13.49 |
| Motor vehicle theft[62] | 13,938 | 4.55 |
| Arson[62] | 394 | 0.13 |
Cities by population and crime rates
| Cities by population and crime rates | ||||||||
|---|---|---|---|---|---|---|---|---|
| City | Population[63] | Violent crimes[63] | Violent crime rate per 1,000 persons |
Property crimes[63] | Property crime rate per 1,000 persons | |||
| Carlsbad | 107,879 | 265 | 2.46 | 2,109 | 19.55 | |||
| Chula Vista | 249,830 | 581 | 2.33 | 5,081 | 20.34 | |||
| Coronado | 19,345 | 20 | 1.03 | 504 | 26.05 | |||
| Del Mar | 4,263 | 15 | 3.52 | 211 | 49.50 | |||
| El Cajon | 101,864 | 365 | 3.58 | 2,414 | 23.70 | |||
| Encinitas | 60,960 | 150 | 2.46 | 1,296 | 21.26 | |||
| Escondido | 147,386 | 628 | 4.26 | 3,887 | 26.37 | |||
| Imperial Beach | 26,956 | 147 | 5.45 | 471 | 17.47 | |||
| La Mesa | 58,444 | 224 | 3.83 | 1,732 | 29.64 | |||
| Lemon Grove | 25,932 | 137 | 5.28 | 434 | 16.74 | |||
| National City | 59,920 | 371 | 6.19 | 1,863 | 31.09 | |||
| Oceanside | 171,141 | 728 | 4.25 | 4,289 | 25.06 | |||
| Poway | 48,968 | 94 | 1.92 | 559 | 11.42 | |||
| San Diego | 1,338,477 | 5,529 | 4.13 | 31,700 | 23.68 | |||
| San Marcos | 85,810 | 227 | 2.65 | 1,502 | 17.50 | |||
| Santee | 54,700 | 154 | 2.82 | 1,109 | 20.27 | |||
| Solana Beach | 13,181 | 24 | 1.82 | 313 | 23.75 | |||
| Vista | 96,087 | 465 | 4.84 | 1,885 | 19.62 | |||
Economy
Arising from an effort by the state government to identify regional economies, San Diego County and Imperial County are part of the Southern Border Region, one of nine such regions. As a regional economy, the Southern Border Region is the smallest but most economically diverse region in the state. However, the two counties maintain weak relations and have little in common aside from their common border.[64]
Agriculture
San Diego County's agriculture industry was worth $1.85 billion in 2013,[65] and is one of the top five egg producing counties in the United States.[66] In 2013, San Diego County also had the most small farms of any county in the United States, and had the 19th largest agricultural economy of any county in the United States.[67] According to the San Diego Farm Bureau, San Diego County is the United States leading producer of avocados, and nursery crops.[68]
Tourism
Tourism plays a large part in the economics of the San Diego metropolitan area. Tourists are drawn to the region for a well rounded experience, everything from shopping to surfing as well as its mild climate. Its numerous tourist destinations include Horton Plaza, Westfield UTC, Seaport Village, Westfield Mission Valley and Fashion Valley Mall for shopping. SeaWorld San Diego and Legoland California as amusement parks. Golf courses such as Torrey Pines Golf Course and Balboa Park Golf Course. Museums such as the San Diego Museum of Man, San Diego Museum of Art, Reuben H. Fleet Science Center, San Diego Natural History Museum, USS Midway Museum, and the San Diego Air and Space Museum. Historical places such as the Gaslamp Quarter, Balboa Park and Old Town San Diego State Historic Park. Wildlife refuges, zoos, and aquariums such as the Birch Aquarium at Scripps, San Diego Zoo's Safari Park, San Diego Zoo and San Diego-La Jolla Underwater Park. Outdoor destinations include the Peninsular Ranges for hiking, biking, mountainboarding and trail riding. Surfing locations include Swami's, Stone Steps Beach, Torrey Pines State Beach, Cardiff State Beach, San Onofre State Beach and the southern portion of Black's Beach.
The region is host to the second largest cruise ship industry in California which generates an estimated $2 million annually from purchases of food, fuel, supplies, and maintenance services.[69] In 2008 the Port of San Diego hosted 252 ship calls and more than 800,000 passengers.[70]
Education
San Diego County contains three public state universities: University of California, San Diego; San Diego State University; and California State University, San Marcos. Major private universities in the county include University of San Diego (USD), Point Loma Nazarene University (PLNU), Alliant International University (AIU), and National University.
Within the county there are 24 public elementary school districts, 6 high school districts, and 12 unified school districts. There are also 5 community college districts.[71]
There are two separate public library systems in San Diego County: the San Diego Public Library serving the city of San Diego, and the San Diego County Library serving all other areas of the county. In 2010 the county library had 33 branches and two bookmobiles; circulated over 10.7 million books, CDs, DVDs, and other material formats; recorded 5.7 million visits to library branches; and hosted 21,132 free programs and events. The San Diego County Library is one of the 25 busiest libraries in the nation as measured by materials circulated.[72][73]
Military
.jpg)
San Diego is the headquarters of the U.S. Navy's Eleventh Naval District and is the Navy's principal location for West Coast and Pacific Ocean operations.[74] Naval Base San Diego, California is principal home to the Pacific Fleet (although the headquarters is located in Pearl Harbor). NAS North Island is located on the north side of Coronado, and is home to Headquarters for Naval Air Forces and Naval Air Force Pacific, the bulk of the Pacific Fleet's helicopter squadrons, and part of the West Coast aircraft carrier fleet.
The Naval Special Warfare Center is the primary training center for SEALs, and is also located on Coronado. The area contains five major naval bases and the U.S. Marines base Camp Pendleton. Marine Corps Base Camp Pendleton is the major West Coast base of the United States Marine Corps and serves as its prime amphibious training base.[75] It is located on the Southern California coast, bordered by Oceanside to the south, San Clemente to the north, and Fallbrook to the east.
U.S. Navy
- Naval Base San Diego, also known as 32nd Street Naval Station
- Naval Amphibious Base Coronado
- Naval Air Station North Island
- Naval Base Point Loma, which includes the Submarine Base and the Fleet Antisubmarine Warfare Training Center
- Space and Naval Warfare Systems Command (SPAWAR)
- Naval Medical Center San Diego, also known as Bob Wilson Naval Hospital and Balboa Naval Hospital
U.S. Marine Corps
- Marine Corps Base Camp Pendleton
- Marine Corps Air Station Miramar
- Marine Corps Recruit Depot San Diego
U.S. Coast Guard
Culture
The culture of San Diego is influenced heavily by American and Mexican cultures due to its position as a border town, its large Hispanic population, and its history as part of Spanish America and Mexico. The area's longtime association with the U.S. military also contributes to its culture. Present-day culture includes many historical and tourist attractions, a thriving musical and theatrical scene, numerous notable special events, a varied cuisine, and a reputation as one of America's premier centers of craft brewing.
Sports
The most popular sports teams in the San Diego metropolitan area are the two major professional sports teams — the NFL's Chargers and MLB's Padres — and the college sports teams of the San Diego State Aztecs. The following table shows all sports teams in the San Diego metropolitan area that average over 8,000 fans per game:
| Club | Sport | Since | League | Venue (capacity) | Attendance |
|---|---|---|---|---|---|
| San Diego Chargers | Football | 1961 | National Football League | Qualcomm Stadium (71,000) | 65,432 |
| San Diego State Aztecs | Football | 1921 | NCAA D1 (Mtn West) | Qualcomm Stadium (71,000) | 32,406 |
| San Diego Padres | Baseball | 1969 | Major League Baseball | Petco Park (41,200) | 27,103 |
| San Diego State Aztecs | Basketball | 1921 | NCAA D1 (Mtn West) | Viejas Arena (12,400) | 12,414 |
| San Diego Gulls | Ice hockey | 2015 | AHL (Pacific) | Valley View Casino Center (12,920) | 8,675 |
| San Diego Breakers | Rugby | 2016 | PRO Rugby | Torero Stadium (6,000) | — |
Sites of interest
- Mount Laguna Observatory, owned and primarily operated by San Diego State University
- Palomar Observatory, owned and primarily operated by the California Institute of Technology
- The Ramona Valley wine-producing region, located 28 miles (45 km) northeast of the City of San Diego
- San Diego Zoo Safari Park, formerly known as the San Diego Wild Animal Park, 35 miles (56 km) north of the San Diego Zoo and east of Escondido
- Sea World of San Diego, on Mission Bay.
- Mission Bay Recreation Area, including Fiesta Island, a sheltered bay popular for water sports, also known for the annual Over the line tournament.
- Mission San Diego de Alcala, the first of California's 21 Spanish missions. It is an operating Roman Catholic parish and also is open for historical interest tours during the week. It is located near the interchange of Interstates 8 and 15.
- Mission San Luis Rey, founded on June 13, 1798 by Padre Fermín Lasuén. It is the 18th of the Spanish missions established in California. It is an operating Roman Catholic parish and is open every day for historical interest tours. It is located near Route 76 in the Oceanside area.
- Balboa Park, with numerous museums and other cultural locations, located just north of Downtown San Diego.
- San Diego Zoo, located in Balboa Park
- Presidio Park, located on a bluff directly above Old Town, a city historic park on the site of the San Diego Presidio, the first European settlement in California.
- San Diego Bay contains the aircraft carrier USS Midway now used as a memorial ship and as a floating museum, and the eight floating museum ships of the San Diego Maritime Museum. Harbor cruises, sailing, and sport fishing are also available.
- LEGOLAND California Resort is a "LEGO" themed resort in Carlsbad.
- Alta Vista Gardens is a Botanical Garden in Vista, California dedicated to bringing together 'People, Nature & Art'.
Media
Newspapers
San Diego County is served by many newspapers. The major regional paper is The San Diego Union-Tribune, also known as U-T San Diego, is ranked 23rd in the country (by daily circulation) as of March 2013.[76] The Union-Tribune serves both San Diego County and neighboring Imperial County. The former North County Times, based in Escondido and serving portions of Riverside County and North County, was purchased by the Union-Tribune in 2012 and closed down. For about a year after absorbing the North County Times the Union-Tribune published a North County edition,[77] but the regional edition was later abandoned.[78] The Los Angeles Times is also delivered in portions of the county. Many of the area's cities, towns and neighborhoods have their own local newspapers; the Union Tribune bought eight local weeklies in 2013 and is continuing to publish them as independent local newspapers.[78] The San Diego Daily Transcript reports business and legal news. Privately published papers like the Military Press Newspaper and the Navy Dispatch serve the military community both on and off base.
Other media
County Television Network is a public-access television cable channel, offering a "hometown blend of C-SPAN, the Lifetime, History, Travel, and Discovery channels" for the county, and funded by fees paid by cable companies.[79]
Transportation
Major highways
Border crossings to Mexico
Railroads
- AMTRAK (Pacific Surfliner)
- Metrolink
- The Coaster
- San Diego and Arizona Eastern Railway
- San Diego and Imperial Valley Railroad
Light rail and local transit
The Port of San Diego
Airports
- Lindbergh Field (San Diego International Airport) (SAN)
- Montgomery Field, (MYF)
- McClellan-Palomar Airport, (CLD or CRQ) a.k.a. Palomar Airport or Carlsbad Airport
- Gillespie Field, (SEE) in El Cajon
- Agua Caliente Airport
- Borrego Valley Airport
- Fallbrook Airport
- Oceanside Municipal Airport
- Ocotillo Airport
- Ramona Airport, (RNM)
- Brown Field Municipal Airport, (SDM) (formerly East Field, NAAS Otay Mesa, and NAAS Brown Field)
Communities

Cities
| City | Population |
|---|---|
| San Diego | 1,307,402 |
| Chula Vista | 243,916 |
| Oceanside | 183,095 |
| Escondido | 143,911 |
| Carlsbad | 105,328 |
| El Cajon | 99,478 |
| Vista | 93,834 |
| San Marcos | 83,781 |
| Encinitas | 59,518 |
| National City | 58,582 |
| La Mesa | 57,065 |
Census-designated places
- Alpine
- Bonita
- Bonsall
- Borrego Springs
- Bostonia
- Boulevard
- Campo
- Camp Pendleton North
- Camp Pendleton South
- Casa de Oro-Mount Helix
- Crest
- Descanso
- Eucalyptus Hills
- Fairbanks Ranch
- Fallbrook
- Granite Hills
- Harbison Canyon
- Hidden Meadows
- Jacumba Hot Springs
- Jamul
- Julian
- Lake San Marcos
- Lakeside
- La Presa
- Mount Laguna
- Pine Valley
- Potrero
- Rainbow
- Ramona
- Rancho San Diego
- Rancho Santa Fe
- San Diego Country Estates
- Spring Valley
- Valley Center
- Winter Gardens
Unincorporated communities
- 4S Ranch
- Ballena
- Barrett Junction
- Blossom Valley
- Canebrake
- Cardiff-by-the-Sea
- Dehesa
- Del Dios
- De Luz
- Dulzura
- Elfin Forest
- Fernbrook
- Flinn Springs
- Four Corners
- Guatay
- Harmony Grove
- Kentwood-In-The-Pines
- Leucadia
- Lincoln Acres
- Live Oak Springs
- Oak Grove
- Ocotillo Wells
- Olivenhain
- Pala
- Pauma Valley
- Pine Hills
- Ranchita
- Rincon
- San Luis Rey
- Santaluz
- Santa Ysabel
- Shelter Valley
- Tecate
- Tierra del Sol
- Warner Springs
- Whispering Pines
- Wynola
Indian reservations
San Diego County has 18 federally recognized Indian reservations, more than any other county in the United States.[80] Although they are typical in size to other Indian reservations in California (many of which are termed "Rancherías"), they are relatively tiny by national standards, and all together total 200.2 square miles (518.5 km²) of area.
- Barona Indian Reservation
- Campo Indian Reservation
- Capitan Grande Reservation
- Cuyapaipe Indian Reservation
- Inaja and Cosmit Indian Reservation
- Jamul Indian Village
- La Jolla Indian Reservation
- La Posta Indian Reservation
- Los Coyotes Indian Reservation
- Manzanita Indian Reservation
- Mesa Grande Indian Reservation
- Pala Indian Reservation
- Pauma and Yuima Indian Reservation
- Rincon Indian Reservation
- San Pasqual Indian Reservation
- Santa Ysabel Indian Reservation
- Sycuan Indian Reservation
- Viejas Indian Reservation
Population ranking
The population ranking of the following table is based on the 2010 census of San Diego County.[81]
† county seat
| Rank | City/Town/etc. | Municipal type | Population (2010 Census)
|
|---|---|---|---|
| 1 | † San Diego | City | 1,307,402 |
| 2 | Chula Vista | City | 243,916 |
| 3 | Oceanside | City | 167,086 |
| 4 | Escondido | City | 143,911 |
| 5 | Carlsbad | City | 105,328 |
| 6 | El Cajon | City | 99,478 |
| 7 | Vista | City | 93,834 |
| 8 | San Marcos | City | 83,781 |
| 9 | Encinitas | City | 59,518 |
| 10 | National City | City | 58,582 |
| 11 | La Mesa | City | 57,065 |
| 12 | Santee | City | 53,413 |
| 13 | Poway | City | 47,811 |
| 14 | La Presa | CDP | 34,169 |
| 15 | Fallbrook | CDP | 30,534 |
| 16 | Spring Valley | CDP | 28,205 |
| 17 | Imperial Beach | City | 26,324 |
| 18 | Lemon Grove | City | 25,320 |
| 19 | Rancho San Diego | CDP | 21,208 |
| 20 | Lakeside | CDP | 20,648 |
| 21 | Winter Gardens | CDP | 20,631 |
| 22 | Ramona | CDP | 20,292 |
| 23 | Coronado | City | 18,912 |
| 24 | Casa de Oro-Mount Helix | CDP | 18,762 |
| 25 | Bostonia | CDP | 15,379 |
| 26 | Alpine | CDP | 14,236 |
| 27 | Solana Beach | City | 12,867 |
| 28 | Bonita | CDP | 12,538 |
| 29 | Camp Pendleton South | CDP | 10,616 |
| 30 | San Diego Country Estates | CDP | 10,109 |
| 31 | Valley Center | CDP | 9,277 |
| 32 | Jamul | CDP | 6,163 |
| 33 | Eucalyptus Hills | CDP | 5,313 |
| 34 | Camp Pendleton North | CDP | 5,200 |
| 35 | Lake San Marcos | CDP | 4,437 |
| 36 | Del Mar | City | 4,161 |
| 37 | Bonsall | CDP | 3,982 |
| 38 | Harbison Canyon | CDP | 3,841 |
| 39 | Hidden Meadows | CDP | 3,485 |
| 40 | Borrego Springs | CDP | 3,429 |
| 41 | Fairbanks Ranch | CDP | 3,148 |
| 42 | Rancho Santa Fe | CDP | 3,117 |
| 43 | Granite Hills | CDP | 3,035 |
| 44 | Campo | CDP | 2,684 |
| 45 | Crest | CDP | 2,593 |
| 46 | Rainbow | CDP | 1,832 |
| 47 | Pine Valley | CDP | 1,510 |
| 48 | Julian | CDP | 1,502 |
| 49 | Descanso | CDP | 1,423 |
| 50 | Pala Indian Reservation[82] | AIAN | 1,315 |
| 51 | Rincon Reservation[83] | AIAN | 1,215 |
| 52 | San Pasqual Reservation[84] | AIAN | 1,097 |
| 53 | Potrero | CDP | 656 |
| 54 | Barona Reservation[85] | AIAN | 640 |
| 55 | Jucumba Hot Springs | CDP | 561 |
| 56 | Viejas Reservation[86] | AIAN | 520 |
| 57 | La Jolla Reservation[87] | AIAN | 476 |
| 58 | Campo Indian Reservation[88] | AIAN | 362 |
| 59 | Santa Ysabel Reservation[89] | AIAN | 330 |
| 60 | Boulevard | CDP | 315 |
| 61 | Sycuan Reservation[90] | AIAN | 211 |
| 62 | Pauma and Yuima Reservation[91] | AIAN | 206 |
| t-63 | Los Coyotes Reservation[92] | AIAN | 98 |
| t-63 | Mesa Grande Reservation[93] | AIAN | 98 |
| 64 | Manzanita Reservation[94] | AIAN | 78 |
| 65 | Mount Laguna | CDP | 57 |
| 66 | La Posta Indian Reservation[95] | AIAN | 55 |
See also
- National Register of Historic Places listings in San Diego County, California
- List of school districts in San Diego County, California
- List of high schools in San Diego County, California
- List of breweries in San Diego County, California
- List of museums in San Diego County, California
- Southern Border region of California
- List of United States counties
Notes
- ↑ Mean monthly maxima and minima (i.e. the highest and lowest temperature readings during an entire month or year) calculated based on data at said location from 1981 to 2010.
- ↑ Official precipitation records for San Diego were kept at the Weather Bureau Office in downtown from October 1850 to December 1859 at the Mission San Diego and from November 1871 to June 1939 and a variety of buildings at downtown, and at San Diego Int'l (Lindbergh Field) since July 1939.[24] Temperature records, however, only date from October 1874. For more information on data coverage, see ThreadEx
References
- ↑ "Chronology". California State Association of Counties. Retrieved February 6, 2015.
- ↑ "Board of Supervisors". County of San Diego. Retrieved January 12, 2015.
- ↑ "Chief Administrative Officer". County of San Diego. Retrieved January 31, 2015.
- ↑ "Hot Springs Mountain". Peakbagger.com. Retrieved January 31, 2015.
- 1 2 3 4 "State & County QuickFacts". United States Census Bureau. Retrieved April 6, 2016.
- ↑ "Find a County". National Association of Counties. Retrieved 2011-06-07.
- ↑ "OMB Bulletin No. 13-01: Revised Delineations of Metropolitan Statistical Areas, Micropolitan Statistical Areas, and Combined Statistical Areas, and Guidance on Uses of the Delineations of These Areas" (PDF). United States Office of Management and Budget. February 28, 2013. Retrieved March 20, 2013.
- ↑ "Table 1. Annual Estimates of the Population of Metropolitan and Micropolitan Statistical Areas: April 1, 2010 to July 1, 2012" (CSV). 2012 Population Estimates. United States Census Bureau, Population Division. March 2013. Retrieved March 20, 2013.
- ↑ "Table 2. Annual Estimates of the Population of Combined Statistical Areas: April 1, 2010 to July 1, 2012" (CSV). 2012 Population Estimates. United States Census Bureau, Population Division. March 2013. Retrieved March 20, 2013.
- ↑ climate map
- ↑ kumeyaay website
- ↑ San Diego Historical Society
- ↑ Journal of San Diego History, October 1967
- ↑ www.missionscalifornia.com
- 1 2 3 4 Coy, Owen C.; PhD (1923). California County Boundaries. Berkeley: California Historical Commission. ASIN B000GRBCXG.
- ↑ "2010 Census Gazetteer Files". United States Census Bureau. August 22, 2012. Retrieved October 4, 2015.
- ↑
- ↑ Gerber, James ed. Economic Profile of the San Diego-Tijuana Region: Characteristics for Investment and Governance Decisions. Institute for Regional Studies of the Californias. 1995. p.11
- ↑ The California Chaparral Field Institute
- ↑ M. Kottek; J. Grieser; C. Beck; B. Rudolf; F. Rubel (2006). "World Map of the Köppen-Geiger climate classification updated". Meteorol. Z. 15: 259–263. doi:10.1127/0941-2948/2006/0130. Retrieved April 22, 2009.
- ↑ UCSD
- ↑ "Monthly Averages for San Diego, CA". The Weather Channel. Retrieved April 22, 2009.
- ↑ "Monthly Averages for El Cajon, CA". The Weather Channel. Retrieved April 22, 2009.
- ↑ Conner, Glen. History of weather observations San Diego, California 1849–1948. Climate Database Modernization Program, NOAA's National Climatic Data Center. pp. 7–8.
- ↑ "NowData – NOAA Online Weather Data". National Oceanic and Atmospheric Administration. Retrieved 11 April 2016.
- ↑ "Station Name: CA San Diego Lindbergh FLD". National Oceanic & Atmospheric Administration. Retrieved 2 June 2015.
- ↑ "San Diego/Lindbergh Field CA Climate Normals 1961–1990". National Oceanic and Atmospheric Administration. Retrieved 2 June 2015.
- ↑ "About the refuge complex". San Diego National Wildlife Refuge. Retrieved 7 June 2015.
- ↑ "About the Refuge". San Diego National Wildlife Refuge. Retrieved 7 June 2015.
- ↑ "About the Refuge". San Diego Bay National Wildlife Refuge. Retrieved 7 June 2015.
- ↑ "About the Refuge". Tijuana Slough National Wildlife Refuge. Retrieved 7 June 2015.
- ↑ "About the Refuge". Seal Beach National Wildlife Refuge. Retrieved 7 June 2015.
- ↑ MountainZone.com
- ↑ San Diego County Commute
- 1 2 3 4 5 6 7 8 9 10 U.S. Census Bureau. American Community Survey, 2011 American Community Survey 5-Year Estimates, Table B02001. American FactFinder. Retrieved October 26, 2013.
- ↑ U.S. Census Bureau. American Community Survey, 2011 American Community Survey 5-Year Estimates, Table B03003. American FactFinder. Retrieved October 26, 2013.
- ↑ U.S. Census Bureau. American Community Survey, 2011 American Community Survey 5-Year Estimates, Table B19301. American FactFinder. Retrieved October 21, 2013.
- ↑ U.S. Census Bureau. American Community Survey, 2011 American Community Survey 5-Year Estimates, Table B19013. American FactFinder. Retrieved October 21, 2013.
- ↑ U.S. Census Bureau. American Community Survey, 2011 American Community Survey 5-Year Estimates, Table B19113. American FactFinder. Retrieved October 21, 2013.
- ↑ "County Totals Dataset: Population, Population Change and Estimated Components of Population Change: April 1, 2010 to July 1, 2015". Retrieved July 2, 2016.
- ↑ "U.S. Decennial Census". United States Census Bureau. Retrieved October 4, 2015.
- ↑ "Historical Census Browser". University of Virginia Library. Retrieved October 4, 2015.
- ↑ Forstall, Richard L., ed. (March 27, 1995). "Population of Counties by Decennial Census: 1900 to 1990". United States Census Bureau. Retrieved October 4, 2015.
- ↑ "Census 2000 PHC-T-4. Ranking Tables for Counties: 1990 and 2000" (PDF). United States Census Bureau. April 2, 2001. Retrieved October 4, 2015.
- ↑ "2010 Census P.L. 94-171 Summary File Data". United States Census Bureau.
- ↑ U.S. Census Bureau. American Community Survey, 2011 American Community Survey 5-Year Estimates, Tables B01003 and B19025. American FactFinder. Retrieved October 26, 2013.
- ↑ California Government Code § 23004
- ↑ "About County Government". Guide to Government. League of Women Voters of California. Retrieved December 26, 2012.
- ↑ "Supervisor's shameless self-preservation". San Diego Union Tribune. June 30, 2011. Retrieved November 28, 2012.
- ↑ Orr, Katie (June 9, 2010). "Voters Approve Term Limits for Supervisors". KPBS. Retrieved November 28, 2012.
- ↑ Perry, Tony (November 23, 2012). "Dave Roberts brings diversity to the San Diego County supervisors". Los Angeles Times. Retrieved November 28, 2012.
- ↑ "The County Administration Center". San Diego County webpage. Retrieved January 6, 2013.
- 1 2 "Report of Registration - State Reporting Districts" (PDF). sdvote.com. County of San Diego. 6 September 2014. Retrieved 19 September 2014.
- ↑ Report of Registration - State Reporting Districts, San Diego County Registrar of Voters, 2015.
- ↑ http://uselectionatlas.org/RESULTS/index.html
- ↑ Libby, Sarah (November 5, 2012). "Where to Find Us on Election Day". Voice of San Diego. Retrieved December 28, 2012.
- ↑ Amid the celebrations, farewell | The San Diego Union-Tribune
- ↑ San Diego County Proposition 8 Results by Community
- ↑ "Counties by County and by District". California Citizens Redistricting Commission. Retrieved September 24, 2014.
- ↑ "Communities of Interest — County". California Citizens Redistricting Commission. Retrieved September 28, 2014.
- ↑ "Communities of Interest — County". California Citizens Redistricting Commission. Retrieved September 28, 2014.
- 1 2 3 4 5 6 7 8 9 10 Office of the Attorney General, Department of Justice, State of California. Table 11: Crimes – 2009. Retrieved November 14, 2013.
- 1 2 3 United States Department of Justice, Federal Bureau of Investigation. Crime in the United States, 2012, Table 8 (California). Retrieved November 14, 2013.
- ↑ Economics
- ↑ Dwane Brown (10 January 2014). "San Diego County Agricultural Industry Thrives". KPBS. San Diego. Retrieved 3 January 2015.
- ↑ J. Harry Jones (1 January 2015). "New rules create 'Chicken Disneyland'". San Diego Union Tribune. Retrieved 3 January 2015.
- ↑ Ha Dang (2013). "2013 Crop Statistics and Annual Report" (PDF). Sandiegocounty.gov. County of San Diego. Retrieved 3 January 2014.
- ↑ "San Diego County Agriculture Facts". sdfarmbureau.org. San Diego Farm Bureau. 2014. Retrieved 3 January 2015.
- ↑ Lewis, Connie (September 27, 2004). "Cruise Ships Face Stiffer Anti-Pollution Policies". San Diego Business Journal. Retrieved April 22, 2009.
- ↑ San Diego Metro Magazine
- ↑ San Diego County Board of Education
- ↑ County of San Diego: San Diego County Library. Sdcl.org (2007-09-30). Retrieved on 2014-05-24.
- ↑ San Diego County Library: Annual Report FY 2009-2010. Dbpcosdcsgt.co.san-diego.ca.us (2009-09-21). Retrieved on 2014-05-24.
- ↑ "San Diego Economy". CityData.com.
- ↑ Estes, Kenneth W. (1999). The Marine Officer's Guide – Sixth Edition. Annapolis, Maryland: Naval Institute Press. p. 176. ISBN 1-55750-567-5.
- ↑ "Top 25 U.S. Newspapers for March 2013". Alliance for Audited Media. Retrieved June 1, 2014.
- ↑ "U-T Buys North County Times and Californian". San Diego Business Journal. September 10, 2012. Retrieved July 2, 2013.
- 1 2 Horn, Jonathan (November 1, 2013). "U-T buys 8 local community newspapers". San Diego Union Tribune. Retrieved December 27, 2013.
- ↑ "About CTN". San Diego County. Retrieved December 27, 2013.
- ↑ University of San Diego
- ↑ http://www.census.gov/2010census/
- ↑ http://www.census.gov/2010census/popmap/ipmtext.php?fl=2635
- ↑ http://www.census.gov/2010census/popmap/ipmtext.php?fl=3165
- ↑ http://www.census.gov/2010census/popmap/ipmtext.php?fl=3460
- ↑ http://www.census.gov/2010census/popmap/ipmtext.php?fl=0155
- ↑ http://www.census.gov/2010census/popmap/ipmtext.php?fl=4500
- ↑ http://www.census.gov/2010census/popmap/ipmtext.php?fl=1850
- ↑ http://www.census.gov/2010census/popmap/ipmtext.php?fl=0450
- ↑ http://www.census.gov/2010census/popmap/ipmtext.php?fl=3550
- ↑ http://www.census.gov/2010census/popmap/ipmtext.php?fl=4090
- ↑ http://www.census.gov/2010census/popmap/ipmtext.php?fl=2715
- ↑ http://www.census.gov/2010census/popmap/ipmtext.php?fl=1995
- ↑ http://www.census.gov/2010census/popmap/ipmtext.php?fl=2190
- ↑ http://www.census.gov/2010census/popmap/ipmtext.php?fl=2115
- ↑ http://www.census.gov/2010census/popmap/ipmtext.php?fl=1895
Further reading
- Pryde, Philip R. San Diego: An Introduction to the Region (4th ed. 2004), a historical geography
External links
| Wikisource has the text of an 1879 American Cyclopædia article about San Diego County, California. |
-
 San Diego County travel guide from Wikivoyage
 - Official website
- San Diego Tourism Authority
- San Diego Geographic Information Source
- San Diego County Water Authority Map
| Counties | ||
|---|---|---|
| Major city | ||
| Cities 100k - 250k | ||
| Cities and towns 20k - 99k | ||
| CDPs 20k+ | ||
| Bodies of water | ||
| Regions | ||
| Parks and Monuments | ||
| Counties and Municipalities | 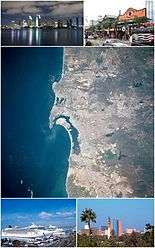 | |
|---|---|---|
| Major cities | ||
| Cities 100k - 250k | ||
| Cities and towns 20k - 99k | ||
| Cities and towns 10k-19k | ||
| Bodies of water | ||
| Sub-regions | ||
| ||