Merced County, California
| Merced County, California | ||||||
|---|---|---|---|---|---|---|
| County | ||||||
| County of Merced | ||||||
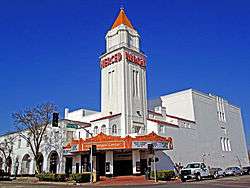
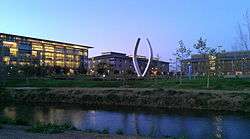
Images, from top down, left to right: The historic Merced Theatre, San Luis Reservoir, UC Merced, The B-29A Super Fortress exhibit at the Castle Air Museum in Atwater | ||||||
| ||||||
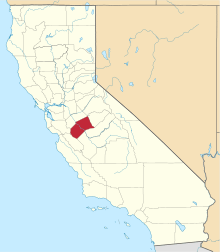 Location in the state of California | ||||||
 California's location in the United States | ||||||
| Coordinates: 37°11′N 120°43′W / 37.19°N 120.71°WCoordinates: 37°11′N 120°43′W / 37.19°N 120.71°W | ||||||
| Country |
| |||||
| State |
| |||||
| Region | San Joaquin Valley | |||||
| Incorporated | April 19, 1855[1] | |||||
| Named for | Merced River | |||||
| County seat | Merced | |||||
| Government | ||||||
| • County Executive Officer | James L. Brown [2] | |||||
| Area | ||||||
| • Total | 1,979 sq mi (5,130 km2) | |||||
| • Land | 1,935 sq mi (5,010 km2) | |||||
| • Water | 44 sq mi (110 km2) | |||||
| Highest elevation[3] | 3,801 ft (1,159 m) | |||||
| Population (April 1, 2010)[4] | ||||||
| • Total | 255,793 | |||||
| • Estimate (2015)[4] | 268,455 | |||||
| • Density | 130/sq mi (50/km2) | |||||
| Time zone | Pacific Time Zone (UTC−8) | |||||
| • Summer (DST) | Pacific Daylight Time (UTC−7) | |||||
| ZIP code | 93620, 93635, 93661, 93665, 95301, 95303, 95312, 95315, 95317, 95322. 95324, 95333, 95334, 95388, 95340, 95341, 95343, 95344, 95348, 95365. 95369, 95374[5] | |||||
| Area code | 209 | |||||
| FIPS code | 06-047 | |||||
| GNIS feature ID | 277288 | |||||
| Website |
www | |||||


Merced County (/mərˈsɛd/ mər-SED), is a county located in the northern San Joaquin Valley section of the Central Valley, in the U.S. state of California.
As of the 2010 census, the population was 255,793.[4] The county seat is Merced.[6] The county is named after the Merced River.
Merced County comprises the Merced, CA Metropolitan Statistical Area, which is included in the Modesto-Merced, CA Combined Statistical Area. It is located north of Fresno County and Fresno, and southeast of Santa Clara County and San Jose.
History
The county derives its name from the Merced River, or El Río de Nuestra Señora de la Merced (River of Our Lady of Mercy), named in 1806 by an expedition headed by Gabriel Moraga, which came upon it at the end of a hot dusty ride on the El Camino Viejo across the San Joaquin Valley in Spanish colonial Las Californias Province.
Between 1841 and 1844, during the period when Alta California was a territory of independent Mexico, four Mexican land grants were made in what became Merced County: Rancho Orestimba y Las Garzas, Rancho Panoche de San Juan y Los Carrisolitos, Rancho San Luis Gonzaga, and Rancho Sanjon de Santa Rita
Merced County was formed in 1855 from parts of Mariposa County. Parts of its territory were given to Fresno County in 1856.
Geography
According to the U.S. Census Bureau, the county has a total area of 1,979 square miles (5,130 km2), of which 1,935 square miles (5,010 km2) is land and 44 square miles (110 km2) (2.2%) is water.[7]
National protected areas
Demographics
2011
| Population, race, and income | |||||
|---|---|---|---|---|---|
| Total population[8] | 253,606 | ||||
| White[8] | 170,229 | 67.1% | |||
| Black or African American[8] | 9,837 | 3.9% | |||
| American Indian or Alaska Native[8] | 2,617 | 1.0% | |||
| Asian[8] | 18,904 | 7.5% | |||
| Native Hawaiian or other Pacific Islander[8] | 517 | 0.2% | |||
| Some other race[8] | 43,893 | 17.3% | |||
| Two or more races[8] | 7,609 | 3.0% | |||
| Hispanic or Latino (of any race)[9] | 137,974 | 54.4% | |||
| Per capita income[10] | $18,304 | ||||
| Median household income[11] | $43,945 | ||||
| Median family income[12] | $48,429 | ||||
Places by population, race, and income
| Places by population and race | ||||||||
|---|---|---|---|---|---|---|---|---|
| Place | Type[13] | Population[8] | White[8] | Other[8] [note 1] |
Asian[8] | Black or African American[8] |
Native American[8] [note 2] |
Hispanic or Latino (of any race)[9] |
| Atwater | City | 27,922 | 66.0% | 21.6% | 7.0% | 4.3% | 1.1% | 49.2% |
| Ballico | CDP | 384 | 72.1% | 24.7% | 1.6% | 0.0% | 1.6% | 49.2% |
| Bear Creek | CDP | 188 | 44.7% | 55.3% | 0.0% | 0.0% | 0.0% | 89.4% |
| Cressey | CDP | 614 | 57.0% | 42.3% | 0.7% | 0.0% | 0.0% | 63.7% |
| Delhi | CDP | 9,892 | 59.0% | 28.9% | 7.1% | 2.2% | 2.8% | 67.8% |
| Dos Palos | City | 4,940 | 79.6% | 18.1% | 0.0% | 2.0% | 0.3% | 66.5% |
| Dos Palos Y | CDP | 207 | 77.3% | 22.7% | 0.0% | 0.0% | 0.0% | 65.2% |
| El Nido | CDP | 297 | 44.1% | 55.9% | 0.0% | 0.0% | 0.0% | 72.4% |
| Franklin | CDP | 5,766 | 71.4% | 14.8% | 6.6% | 2.5% | 4.7% | 56.4% |
| Gustine | City | 5,484 | 85.8% | 13.2% | 0.3% | 0.0% | 0.6% | 56.1% |
| Hilmar-Irwin | CDP | 5,224 | 95.1% | 3.6% | 1.0% | 0.2% | 0.0% | 9.2% |
| Le Grand | CDP | 1,893 | 51.8% | 47.4% | 0.0% | 0.0% | 0.8% | 88.4% |
| Livingston | City | 12,899 | 48.0% | 32.8% | 17.5% | 0.9% | 0.9% | 71.5% |
| Los Banos | City | 35,252 | 81.0% | 11.3% | 3.3% | 3.9% | 0.5% | 67.4% |
| McSwain | CDP | 4,041 | 82.8% | 8.8% | 6.7% | 0.3% | 1.4% | 20.6% |
| Merced | City | 78,111 | 56.1% | 24.1% | 11.4% | 6.8% | 1.7% | 49.6% |
| Planada | CDP | 4,366 | 52.3% | 44.2% | 1.2% | 1.6% | 0.8% | 96.2% |
| Santa Nella | CDP | 1,292 | 84.1% | 12.0% | 0.0% | 3.9% | 0.0% | 70.4% |
| Snelling | CDP | 97 | 100.0% | 0.0% | 0.0% | 0.0% | 0.0% | 3.1% |
| South Dos Palos | CDP | 2,144 | 88.9% | 10.0% | 0.0% | 1.1% | 0.0% | 94.1% |
| Stevinson | CDP | 132 | 53.8% | 46.2% | 0.0% | 0.0% | 0.0% | 46.2% |
| Tuttle | CDP | 21 | 100.0% | 0.0% | 0.0% | 0.0% | 0.0% | 0.0% |
| University of California, Merced | CDP | 0 | 0.0% | 0.0% | 0.0% | 0.0% | 0.0% | 0.0% |
| Volta | CDP | 126 | 100.0% | 0.0% | 0.0% | 0.0% | 0.0% | 55.6% |
| Winton | CDP | 11,742 | 61.2% | 28.4% | 8.2% | 1.6% | 0.7% | 74.5% |
2010
| Historical population | |||
|---|---|---|---|
| Census | Pop. | %± | |
| 1860 | 1,141 | — | |
| 1870 | 2,807 | 146.0% | |
| 1880 | 5,656 | 101.5% | |
| 1890 | 8,085 | 42.9% | |
| 1900 | 9,215 | 14.0% | |
| 1910 | 15,148 | 64.4% | |
| 1920 | 24,579 | 62.3% | |
| 1930 | 36,748 | 49.5% | |
| 1940 | 46,988 | 27.9% | |
| 1950 | 69,780 | 48.5% | |
| 1960 | 90,446 | 29.6% | |
| 1970 | 104,629 | 15.7% | |
| 1980 | 134,560 | 28.6% | |
| 1990 | 178,403 | 32.6% | |
| 2000 | 210,554 | 18.0% | |
| 2010 | 255,793 | 21.5% | |
| Est. 2015 | 268,455 | [14] | 5.0% |
| U.S. Decennial Census[15] 1790–1960[16] 1900–1990[17] 1990–2000[18] 2010–2015[4] | |||
The 2010 United States Census reported that Merced County had a population of 255,793. The racial makeup of Merced County was 148,381 (58.0%) White, 9,926 (3.9%) African American, 3,473 (1.4%) Native American, 18,836 (7.4%) Asian, 583 (0.2%) Pacific Islander, 62,665 (24.5%) from other races, and 11,929 (4.7%) from two or more races. Hispanic or Latino of any race were 140,485 persons (54.9%).[19]
| Population reported at 2010 United States Census | |||||||||
|---|---|---|---|---|---|---|---|---|---|
Population | American | American | | Islander | races | more races | or Latino (of any race) | ||
| Merced County | 255,793 | 148,381 | 9,926 | 3,473 | 18,836 | 583 | 62,665 | 11,929 | 140,485 |
city | Population | American | American | | Islander | races | more races | or Latino (of any race) | |
| Atwater | 28,168 | 18,410 | 1,225 | 364 | 1,416 | 76 | 5,300 | 1,377 | 14,808 |
| Dos Palos | 4,950 | 3,377 | 167 | 62 | 37 | 4 | 1,075 | 228 | 3,075 |
| Gustine | 5,520 | 3,875 | 73 | 54 | 95 | 8 | 1,191 | 224 | 2,769 |
| Livingston | 13,058 | 5,263 | 106 | 348 | 2,223 | 18 | 4,547 | 553 | 9,547 |
| Los Banos | 35,972 | 20,846 | 1,354 | 512 | 1,162 | 134 | 10,123 | 1,841 | 23,346 |
| Merced | 78,958 | 41,177 | 4,958 | 1,153 | 9,342 | 174 | 17,804 | 4,350 | 39,140 |
place | Population | American | American | | Islander | races | more races | or Latino (of any race) | |
| Ballico | 406 | 237 | 2 | 3 | 11 | 2 | 128 | 23 | 210 |
| Bear Creek | 290 | 156 | 4 | 2 | 14 | 0 | 93 | 21 | 170 |
| Cressey | 394 | 253 | 1 | 3 | 15 | 1 | 95 | 26 | 195 |
| Delhi | 10,755 | 5,655 | 118 | 157 | 405 | 30 | 3,930 | 460 | 7,706 |
| Dos Palos Y | 323 | 225 | 1 | 8 | 1 | 0 | 82 | 6 | 197 |
| El Nido | 330 | 162 | 0 | 7 | 9 | 0 | 147 | 5 | 245 |
| Franklin | 6,149 | 3,455 | 273 | 77 | 931 | 12 | 1,072 | 329 | 3,250 |
| Hilmar-Irwin | 5,197 | 4,475 | 15 | 23 | 87 | 1 | 439 | 157 | 916 |
| Le Grand | 1,659 | 869 | 19 | 35 | 17 | 1 | 659 | 59 | 1,357 |
| McSwain | 4,171 | 3,196 | 56 | 34 | 282 | 9 | 422 | 172 | 1,081 |
| Planada | 4,584 | 1,681 | 22 | 23 | 46 | 1 | 2,725 | 86 | 4,347 |
| Santa Nella | 1,380 | 832 | 22 | 25 | 31 | 0 | 433 | 37 | 968 |
| Snelling | 231 | 206 | 0 | 3 | 6 | 0 | 13 | 3 | 33 |
| South Dos Palos | 1,620 | 809 | 135 | 21 | 36 | 10 | 552 | 57 | 1,262 |
| Stevinson | 313 | 228 | 4 | 0 | 0 | 0 | 73 | 8 | 133 |
| Tuttle | 103 | 77 | 6 | 0 | 6 | 0 | 9 | 5 | 31 |
| University of California, Merced | 0 | 0 | 0 | 0 | 0 | 0 | 0 | 0 | 0 |
| Volta | 246 | 201 | 7 | 0 | 1 | 4 | 29 | 4 | 132 |
| Winton | 10,613 | 5,696 | 175 | 140 | 701 | 8 | 3,455 | 438 | 7,566 |
communities | Population | American | American | | Islander | races | more races | or Latino (of any race) | |
| All others not CDPs (combined) | 40,403 | 27,020 | 1,183 | 419 | 1,962 | 90 | 8,269 | 1,460 | 18,001 |
2000
As of the census[20] of 2000, there were 210,554 people, 63,815 households, and 49,775 families residing in the county. The population density was 109 people per square mile (42/km²). There were 68,373 housing units at an average density of 36 per square mile (14/km²). The racial makeup of the county was 56.2% White, 3.8% Black or African American, 1.2% Native American, 6.8% Asian, 0.2% Pacific Islander, 26.1% from other races, and 5.7% from two or more races. 45.3% of the population were Hispanic or Latino of any race. 6.6% were of Portuguese and 6.0% German ancestry according to Census 2000. 55.1% spoke English, 35.3% Spanish, 3.2% Hmong, 2.9% Portuguese and 1.0% Punjabi as their first language.
There were 63,815 households out of which 45.4% had children under the age of 18 living with them, 57.8% were married couples living together, 14.1% had a female householder with no husband present, and 22.0% were non-families. 17.7% of all households were made up of individuals and 7.4% had someone living alone who was 65 years of age or older. The average household size was 3.25 and the average family size was 3.69.
In the county the population was spread out with 34.5% under the age of 18, 10.3% from 18 to 24, 27.9% from 25 to 44, 17.8% from 45 to 64, and 9.5% who were 65 years of age or older. The median age was 29 years. For every 100 females there were 99.3 males. For every 100 females age 18 and over, there were 96.6 males.
The median income for a household in the county was $35,532, and the median income for a family was $38,009. Males had a median income of $31,721 versus $23,911 for females. The per capita income for the county was $14,257. About 16.9% of families and 21.7% of the population were below the poverty line, including 28.4% of those under age 18 and 10.7% of those age 65 or over.
As of 2008, according to the Lao Family Community, a nonprofit organization, about 8,000 Hmong lived in Merced County.[21]
Government
Merced County is a general law county, governed by a Board of Supervisors. The board consists of five members, elected by districts, who serve four-year terms.[22]
State and federal representation
In the United States House of Representatives, Merced County is in California's 16th congressional district, represented by Democrat Jim Costa.[23]
In the California State Legislature, Merced County is in the 21st Assembly District, represented by Democrat Adam Gray, and the 12th Senate District, represented by Republican Anthony Cannella.[24]
Politics
Voter registration statistics
| Population and registered voters | ||
|---|---|---|
| Total population[8] | 253,606 | |
| Registered voters[25][note 3] | 98,874 | 39.0% |
| Democratic[25] | 43,981 | 44.5% |
| Republican[25] | 32,767 | 33.1% |
| Democratic–Republican spread[25] | +11,214 | +11.4% |
| Independent[25] | 3,016 | 3.1% |
| Green[25] | 568 | 0.6% |
| Libertarian[25] | 483 | 0.5% |
| Peace and Freedom[25] | 318 | 0.3% |
| Americans Elect[25] | 2 | 0.0% |
| Other[25] | 180 | 0.2% |
| No party preference[25] | 17,559 | 17.8% |
Cities by population and voter registration
| Cities by population and voter registration | |||||||
|---|---|---|---|---|---|---|---|
| City | Population[8] | Registered voters[25] [note 3] |
Democratic[25] | Republican[25] | D–R spread[25] | Other[25] | No party preference[25] |
| Atwater | 27,922 | 41.0% | 39.4% | 37.4% | +2.0% | 8.2% | 18.3% |
| Dos Palos | 4,940 | 38.0% | 44.4% | 35.0% | +9.4% | 9.9% | 14.9% |
| Gustine | 5,484 | 38.3% | 48.2% | 30.3% | +17.9% | 7.7% | 17.0% |
| Livingston | 12,899 | 34.6% | 62.2% | 15.9% | +46.3% | 4.9% | 18.9% |
| Los Banos | 35,252 | 37.6% | 50.1% | 27.6% | +22.5% | 7.8% | 17.7% |
| Merced | 78,111 | 41.0% | 46.4% | 30.2% | +16.2% | 8.2% | 18.3% |
Overview
| Year | GOP | DEM | Others |
|---|---|---|---|
| 2016 | 42.1% 26,693 | 52.1% 33,013 | 5.8% 3,644 |
| 2012 | 44.3% 27,581 | 53.0% 33,005 | 2.6% 1,636 |
| 2008 | 44.8% 28,704 | 53.1% 34,031 | 2.1% 1,316 |
| 2004 | 56.5% 32,773 | 42.3% 24,491 | 1.2% 696 |
| 2000 | 51.8% 26,102 | 45.1% 22,726 | 3.2% 1,590 |
| 1996 | 44.4% 20,847 | 46.4% 21,786 | 9.2% 4,305 |
| 1992 | 36.5% 17,981 | 40.9% 20,133 | 22.7% 11,170 |
| 1988 | 51.2% 21,717 | 47.4% 20,105 | 1.4% 592 |
| 1984 | 58.9% 24,997 | 40.1% 17,012 | 1.1% 468 |
| 1980 | 48.8% 18,043 | 42.9% 15,886 | 8.3% 3,067 |
| 1976 | 46.1% 14,842 | 51.7% 16,637 | 2.3% 729 |
| 1972 | 54.3% 17,737 | 42.6% 13,914 | 3.5% 997 |
| 1968 | 40.9% 11,595 | 51.0% 14,453 | 8.1% 2,301 |
| 1964 | 31.2% 8,814 | 68.7% 19,431 | 0.1% 24 |
| 1960 | 43.4% 11,990 | 56.2% 15,545 | 0.4% 111 |
| 1956 | 46.0% 11,430 | 53.8% 13,366 | 0.2% 56 |
| 1952 | 53.3% 13,512 | 45.9% 11,639 | 0.9% 219 |
| 1948 | 42.6% 7,721 | 55.0% 9,959 | 2.5% 444 |
| 1944 | 41.3% 6,518 | 58.3% 9,192 | 0.4% 69 |
| 1940 | 36.4% 6,101 | 62.6% 10,501 | 1.1% 182 |
| 1936 | 25.5% 3,230 | 72.7% 9,208 | 1.8% 230 |
| 1932 | 27.2% 2,920 | 67.1% 7,202 | 5.7% 612 |
| 1928 | 60.2% 4,644 | 38.5% 2,970 | 1.4% 104 |
| 1924 | 52.9% 3,573 | 10.5% 710 | 36.5% 2,466 |
| 1920 | 63.0% 3,457 | 28.0% 1,537 | 9.0% 494 |
Previously reliably Democratic, Merced is now considered a bellwether county. It voted for the winning candidate for president in every election from 1972-2012, before voting for Hillary Clinton in 2016. Democrat Barack Obama won a majority in the county in both 2008 and 2012. Republican George W. Bush won a majority in the county in both 2000 and 2004. This shift in favour of the Republican Party is a rarity given Californian politics' almost universal shift towards the Democratic Party in recent years. Since the opening of UC Merced, Merced County has tended to lean Democrat, with the student population favoring the Democratic Party.
According to the California Secretary of State, as of October 20, 2008, there are 97,179 registered voters in Merced County. Of those, 44,704 (46.0%) are registered Democratic, 35,955 (37.0%) are registered Republican, 3,090 (3.2%) are registered with other political parties, and 13,430 (13.8%) declined to state a political party. Atwater and the unincorporated areas of Merced County have Republican plurality registration advantages. All of the other cities and towns in the county have Democratic pluralities or majorities in voter registration.
Crime
The following table includes the number of incidents reported and the rate per 1,000 persons for each type of offense.
| Population and crime rates | ||
|---|---|---|
| Population[8] | 253,606 | |
| Violent crime[27] | 1,658 | 6.54 |
| Homicide[27] | 26 | 0.10 |
| Forcible rape[27] | 78 | 0.31 |
| Robbery[27] | 276 | 1.09 |
| Aggravated assault[27] | 1,278 | 5.04 |
| Property crime[27] | 4,390 | 17.31 |
| Burglary[27] | 2,318 | 9.14 |
| Larceny-theft[27][note 4] | 5,089 | 20.07 |
| Motor vehicle theft[27] | 903 | 3.56 |
| Arson[27] | 90 | 0.35 |
Cities by population and crime rates
| Cities by population and crime rates | |||||
|---|---|---|---|---|---|
| City | Population[28] | Violent crimes[28] | Violent crime rate per 1,000 persons |
Property crimes[28] | Property crime rate per 1,000 persons |
| Atwater | 28,891 | 180 | 6.23 | 1,400 | 48.46 |
| Dos Palos | 5,079 | 59 | 11.62 | 162 | 31.90 |
| Gustine | 5,663 | 24 | 4.24 | 120 | 21.19 |
| Livingston | 13,394 | 74 | 5.52 | 306 | 22.85 |
| Los Banos | 36,897 | 142 | 3.85 | 1,210 | 32.79 |
| Merced | 80,976 | 810 | 10.00 | 4,111 | 50.77 |
Economy
According to America's Labor Market Information System 2014 report,[29] the companies with the largest employment in Merced are, in alphabetical order:
- Anberry Rehabilitation Hospital
- Atwater Elementary Teachers
- Bianchi & Sons Packing Co (produce)
- E & J Gallo Winery
- Foster Farms
- Golden Valley Health Center
- Hilmar Cheese Company
- J. Marchini & Son (farming)
- Liberty Packing Co
- Live Oak Farms (produce)
- Livingston District Office (education)
- Malibu Boats West Inc
- McLane Pacific (wholesale food services)
- Merced County Human Services
- Mercy Medical Center Merced
- Pacific Gas and Electric Company
- Quad/Graphics (printing)
- Sensient Dehydrated Flavors
- University of California, Merced
- Walmart
- Werner Co (ladders)
- Western Marketing & Sales (farming)
- Yosemite Wholesale Warehouse
Merced County grows 90% of California's sweet potato crop,[30] due in part to the efforts of John Buttencourt Avila, called "the father of the sweet potato industry".
Transportation
Major highways
.svg.png) Interstate 5
Interstate 5 State Route 33
 State Route 59
 State Route 99
 State Route 140
 State Route 152
 State Route 165
Public transportation
- Merced County Transit, or "The Bus," provides local service in Merced as well as connecting service between most cities in Merced County.
- The University of California, Merced, operates its own transit system, Cat Tracks. This system connects with Merced County Transit.
- Yosemite Area Regional Transportation System, or YARTS, connects Merced with Yosemite National Park.
- Greyhound buses and Amtrak trains provide long-distance intercity service.
Airports
Merced Regional Airport, located two miles (3 km) southwest of downtown Merced, provides passenger air service. General aviation airports in the county include Castle Airport, Gustine Airport, and Los Banos Municipal Airport.
Communities
Cities
Census-designated places
Population ranking
The population ranking of the following table is based on the 2010 census of Merced County.[31]
† county seat
| Rank | City/Town/etc. | Municipal type | Population (2010 Census)
|
|---|---|---|---|
| 1 | † Merced | City | 78,958 |
| 2 | Los Banos | City | 35,972 |
| 3 | Atwater | City | 28,168 |
| 4 | Livingston | City | 13,058 |
| 5 | Delhi | CDP | 10,755 |
| 6 | Winton | CDP | 10,613 |
| 7 | Franklin | CDP | 6,149 |
| 8 | Gustine | City | 5,520 |
| 9 | Hilmar-Irwin | CDP | 5,197 |
| 10 | Dos Palos | City | 4,950 |
| 11 | Planada | CDP | 4,584 |
| 12 | McSwain | CDP | 4,171 |
| 13 | Le Grand | CDP | 1,659 |
| 14 | South Dos Palos | CDP | 1,620 |
| 15 | Santa Nella | CDP | 1,380 |
| 16 | Ballico | CDP | 406 |
| 17 | Cressey | CDP | 394 |
| 18 | El Nido | CDP | 330 |
| 19 | Dos Palos Y | CDP | 323 |
| 20 | Stevinson | CDP | 313 |
| 21 | Bear Creek | CDP | 290 |
| 22 | Volta | CDP | 246 |
| 23 | Snelling | CDP | 231 |
| 24 | Tuttle | CDP | 103 |
Places of interest
The former Castle Air Force Base and the United States Penitentiary, Atwater are located in an unincorporated area near Atwater.
See also
- List of California Historical Landmarks
- List of museums in the San Joaquin Valley
- List of school districts in Merced County, California
- National Register of Historic Places listings in Merced County, California
Notes
- ↑ Other = Some other race + Two or more races
- ↑ Native American = Native Hawaiian or other Pacific Islander + American Indian or Alaska Native
- 1 2 Percentage of registered voters with respect to total population. Percentages of party members with respect to registered voters follow.
- ↑ Only larceny-theft cases involving property over $400 in value are reported as property crimes.
References
- ↑ "Merced County". Geographic Names Information System. United States Geological Survey. Retrieved January 31, 2015.
- ↑ "Merced County, CA - Official Website - County Executive Office". www.co.merced.ca.us. Retrieved 2016-05-30.
- ↑ "Laveaga Peak". Peakbagger.com. Retrieved January 31, 2015.
- 1 2 3 4 "State & County QuickFacts". United States Census Bureau. Retrieved April 4, 2016.
- ↑ "Merced County, CA Zip Codes". Zip-Codes.com. Retrieved May 29, 2016.
- ↑ "Find a County". National Association of Counties. Retrieved 2011-06-07.
- ↑ "2010 Census Gazetteer Files". United States Census Bureau. August 22, 2012. Retrieved September 28, 2015.
- 1 2 3 4 5 6 7 8 9 10 11 12 13 14 15 16 17 U.S. Census Bureau. American Community Survey, 2011 American Community Survey 5-Year Estimates, Table B02001. American FactFinder. Retrieved 2013-10-26.
- 1 2 U.S. Census Bureau. American Community Survey, 2011 American Community Survey 5-Year Estimates, Table B03003. American FactFinder. Retrieved 2013-10-26.
- ↑ U.S. Census Bureau. American Community Survey, 2011 American Community Survey 5-Year Estimates, Table B19301. American FactFinder. Retrieved 2013-10-21.
- ↑ U.S. Census Bureau. American Community Survey, 2011 American Community Survey 5-Year Estimates, Table B19013. American FactFinder. Retrieved 2013-10-21.
- ↑ U.S. Census Bureau. American Community Survey, 2011 American Community Survey 5-Year Estimates, Table B19113. American FactFinder. Retrieved 2013-10-21.
- ↑ U.S. Census Bureau. American Community Survey, 2011 American Community Survey 5-Year Estimates. American FactFinder. Retrieved 2013-10-21.
- ↑ "County Totals Dataset: Population, Population Change and Estimated Components of Population Change: April 1, 2010 to July 1, 2015". Retrieved July 2, 2016.
- ↑ "U.S. Decennial Census". United States Census Bureau. Retrieved September 28, 2015.
- ↑ "Historical Census Browser". University of Virginia Library. Retrieved September 28, 2015.
- ↑ Forstall, Richard L., ed. (March 27, 1995). "Population of Counties by Decennial Census: 1900 to 1990". United States Census Bureau. Retrieved September 28, 2015.
- ↑ "Census 2000 PHC-T-4. Ranking Tables for Counties: 1990 and 2000" (PDF). United States Census Bureau. April 2, 2001. Retrieved September 28, 2015.
- ↑ "2010 Census P.L. 94-171 Summary File Data". United States Census Bureau.
- ↑ "American FactFinder". United States Census Bureau. Retrieved 2011-05-14.
- ↑ Oppenheim, Jamie. "Hmong youth not preserving traditions, professor says." Monday March 29, 2010. Retrieved on September 20, 2010.
- ↑ "Board of Supervisors". Merced County, CA. Retrieved January 5, 2015.
- ↑ "California's 16th Congressional District - Representatives & District Map". Civic Impulse, LLC. Retrieved March 1, 2013.
- ↑ "Communities of Interest — County". California Citizens Redistricting Commission. Retrieved September 28, 2014.
- 1 2 3 4 5 6 7 8 9 10 11 12 13 14 15 16 17 California Secretary of State. February 10, 2013 - Report of Registration. Retrieved 2013-10-31.
- ↑ http://uselectionatlas.org/RESULTS/
- 1 2 3 4 5 6 7 8 9 10 Office of the Attorney General, Department of Justice, State of California. Table 11: Crimes – 2009. Retrieved 2013-11-14.
- 1 2 3 United States Department of Justice, Federal Bureau of Investigation. Crime in the United States, 2012, Table 8 (California). Retrieved 2013-11-14.
- ↑
- ↑ "Farmers Markets: Stokes Purple is a sweet potato of mystery", Los Angeles Times, 2 November 2012
- ↑ http://www.census.gov/2010census/
Further reading
- A Memorial and Biographical History of the Counties of Merced, Stanislaus, Calaveras, Tuolumne and Mariposa, California. Chicago: Lewis Publishing Co., 1892.
External links
| Wikimedia Commons has media related to Merced County, California. |
 |
Stanislaus County | Tuolumne County | | |
| Santa Clara County | |
Mariposa County | ||
| ||||
| | ||||
| San Benito County | Fresno County | Madera County |