Tehama County, California
| Tehama County, California | ||||||
|---|---|---|---|---|---|---|
| County | ||||||
| County of Tehama | ||||||
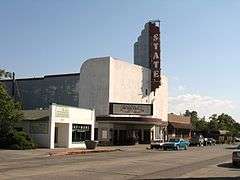
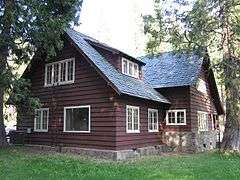
Images, from top down, left to right: Black Rock in the Ishi Wilderness, State Theatre in Red Bluff, Park Headquarters in Lassen Volcanic National Park, front of the William B. Ide Adobe | ||||||
| ||||||
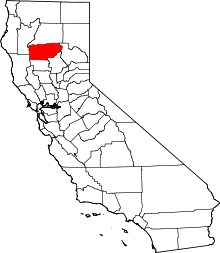 Location in the U.S. state of California | ||||||
 California's location in the United States | ||||||
| Country |
| |||||
| State |
| |||||
| Region | Shasta Cascade | |||||
| Incorporated | 1856 | |||||
| Seat | Red Bluff | |||||
| Largest city | Red Bluff | |||||
| Area | ||||||
| • Total | 7,670 km2 (2,962 sq mi) | |||||
| • Land | 7,600 km2 (2,950 sq mi) | |||||
| • Water | 30 km2 (12 sq mi) | |||||
| Population (April 1, 2010)[1] | ||||||
| • Total | 63,463 | |||||
| • Estimate (2015)[1] | 63,308 | |||||
| • Density | 8.3/km2 (21/sq mi) | |||||
| Time zone | Pacific Standard Time (UTC-8) | |||||
| • Summer (DST) | Pacific Daylight Time (UTC-7) | |||||
| Website | www.co.tehama.ca.us | |||||


Tehama County (/təˈheɪmə/ tə-HAY-mə) is a county located in the northern part of the U.S. state of California. As of the 2010 census, the population was 63,463.[1] The county seat and largest city is Red Bluff.[2]
Tehama County comprises the Red Bluff, CA Micropolitan Statistical Area, which is also included in the Redding-Red Bluff, CA Combined Statistical Area. The county is bisected by the Sacramento River.
History
Tehama County was formed from parts of Butte, Colusa, and Shasta Counties in 1856.
The county is named for the City of Tehama. The origin of the name is not known. Suggested possible roots are the Arabic word تهامة tehama ("hot low-lands"), the Spanish word tejamanil (shingle), or "high water" in the dialect of local Native Americans.
The first permanent non-indigenous settlers in the area that is now Tehama County were Robert Hasty Thomes, Albert Gallatin Toomes, William George Chard, and Job Francis Dye. The four men were each given land grants by the government of Mexico in 1844. Thomes received Rancho Saucos, Toomes received Rancho Rio de los Molinos, Chard received Rancho Las Flores, and Dye received Rancho Primer Cañon o Rio de Los Berrendos. Later in the same year Josiah Belden received Rancho Barranca Colorado.[3]
Famous early figures include Kit Carson, who took part in a fight that gave name to Bloody Island and Battle Creek, Jedediah Smith, John Fremont, and William B. Ide, the first and only president of the California Republic.
The history of Tehama County includes the January 1886 relocation of Red Bluff's Chinese population, followed by the August 1886 torching of Red Bluff's Chinatown by alleged arsonists.[4] The January 29th, 1886 edition of The Daily Alta detailed 'The Anti-Coolie Move' and confirms that a secret anti-Chinese meeting was convened in the town of Tehama, and an organization established to relocate the estimated 2,000 Chinese in and around Vina. Secret daily anti-Chinese caucuses in Red Bluff were also held.[5]
Geography
According to the U.S. Census Bureau, the county has a total area of 2,962 square miles (7,670 km2), of which 2,950 square miles (7,600 km2) is land and 12 square miles (31 km2) (0.4%) is water.[6] Watercourses in Tehama County include Dye Creek and Payne's Creek. The county is intersected by Sacramento River.[7] A small part of Lassen Volcanic National Park extends into the northeast corner of the county.
National protected areas
- Lassen National Forest (part)
- Lassen Volcanic National Park (part)
- Mendocino National Forest (part)
- Sacramento River National Wildlife Refuge (part)
- Shasta-Trinity National Forest (part)
Transportation
Major highways
Public transportation
Tehama Rural Area Express (TRAX) operates local service in Red Bluff and service to Los Molinos and Corning. Greyhound buses stop in Red Bluff.
Airports
Red Bluff Municipal Airport and Corning Municipal Airport are two general aviation airports.
Crime
The following table includes the number of incidents reported and the rate per 1,000 persons for each type of offense.
| Population and crime rates | ||
|---|---|---|
| Population[8] | 62,985 | |
| Violent crime[9] | 387 | 6.14 |
| Homicide[9] | 3 | 0.05 |
| Forcible rape[9] | 9 | 0.14 |
| Robbery[9] | 28 | 0.44 |
| Aggravated assault[9] | 347 | 5.51 |
| Property crime[9] | 725 | 11.51 |
| Burglary[9] | 400 | 6.35 |
| Larceny-theft[9][note 1] | 808 | 12.83 |
| Motor vehicle theft[9] | 136 | 2.16 |
| Arson[9] | 33 | 0.52 |
Cities by population and crime rates
| Cities by population and crime rates | ||||||||
|---|---|---|---|---|---|---|---|---|
| City | Population[10] | Violent crimes[10] | Violent crime rate per 1,000 persons |
Property crimes[10] | Property crime rate per 1,000 persons | |||
| Corning | 7,751 | 51 | 6.58 | 281 | 36.25 | |||
| Red Bluff | 14,236 | 112 | 7.87 | 811 | 56.97 | |||
Demographics
2011
| Population, race, and income | |||||
|---|---|---|---|---|---|
| Total population[8] | 62,985 | ||||
| White[8] | 53,613 | 85.1% | |||
| Black or African American[8] | 418 | 0.7% | |||
| American Indian or Alaska Native[8] | 1,426 | 2.3% | |||
| Asian[8] | 768 | 1.2% | |||
| Native Hawaiian or other Pacific Islander[8] | 69 | 0.1% | |||
| Some other race[8] | 4,159 | 6.6% | |||
| Two or more races[8] | 2,532 | 4.0% | |||
| Hispanic or Latino (of any race)[11] | 13,491 | 21.4% | |||
| Per capita income[12] | $20,689 | ||||
| Median household income[13] | $38,753 | ||||
| Median family income[14] | $46,805 | ||||
Places by population, race, and income
| Places by population and race | ||||||||
|---|---|---|---|---|---|---|---|---|
| Place | Type[15] | Population[8] | White[8] | Other[8] [note 2] |
Asian[8] | Black or African American[8] |
Native American[8] [note 3] |
Hispanic or Latino (of any race)[11] |
| Bend | CDP | 620 | 93.1% | 3.7% | 1.5% | 0.0% | 1.8% | 3.5% |
| Corning | City | 7,624 | 77.7% | 18.3% | 1.4% | 0.0% | 2.6% | 42.0% |
| Flournoy | CDP | 115 | 99.1% | 0.9% | 0.0% | 0.0% | 0.0% | 29.6% |
| Gerber | CDP | 855 | 72.7% | 24.3% | 0.0% | 0.0% | 2.9% | 51.0% |
| Lake California | CDP | 2,855 | 90.2% | 4.9% | 0.5% | 0.0% | 4.3% | 4.5% |
| Las Flores | CDP | 100 | 74.0% | 26.0% | 0.0% | 0.0% | 0.0% | 0.0% |
| Los Molinos | CDP | 2,479 | 84.0% | 15.4% | 0.0% | 0.0% | 0.6% | 24.7% |
| Manton | CDP | 313 | 87.9% | 8.3% | 0.0% | 3.8% | 0.0% | 7.0% |
| Mineral | CDP | 133 | 97.0% | 3.0% | 0.0% | 0.0% | 0.0% | 4.5% |
| Paskenta | CDP | 71 | 100.0% | 0.0% | 0.0% | 0.0% | 0.0% | 0.0% |
| Paynes Creek | CDP | 56 | 92.9% | 0.0% | 0.0% | 0.0% | 7.1% | 14.3% |
| Proberta | CDP | 254 | 100.0% | 0.0% | 0.0% | 0.0% | 0.0% | 0.0% |
| Rancho Tehama Reserve | CDP | 1,356 | 82.4% | 17.6% | 0.0% | 0.0% | 0.0% | 16.2% |
| Red Bluff | City | 14,026 | 89.3% | 7.4% | 0.9% | 0.4% | 2.0% | 21.2% |
| Richfield | CDP | 243 | 88.9% | 3.3% | 3.7% | 0.0% | 4.1% | 0.8% |
| Tehama | City | 383 | 85.9% | 12.5% | 0.0% | 0.0% | 1.6% | 13.3% |
| Vina | CDP | 107 | 93.5% | 0.0% | 0.0% | 0.0% | 6.5% | 15.0% |
| Places by population and income | |||||
|---|---|---|---|---|---|
| Place | Type[15] | Population[16] | Per capita income[12] | Median household income[13] | Median family income[14] |
| Bend | CDP | 620 | $31,726 | $72,917 | $86,597 |
| Corning | City | 7,624 | $13,884 | $38,225 | $42,561 |
| Flournoy | CDP | 115 | $60,147 | $70,000 | $78,333 |
| Gerber | CDP | 855 | $13,410 | $29,612 | $31,346 |
| Lake California | CDP | 2,855 | $21,022 | $47,611 | $50,027 |
| Las Flores | CDP | 100 | $12,060 | $21,389 | $23,636 |
| Los Molinos | CDP | 2,479 | $15,727 | $32,567 | $40,077 |
| Manton | CDP | 313 | $23,536 | $41,875 | $45,000 |
| Mineral | CDP | 133 | $35,310 | $65,729 | $65,729 |
| Paskenta | CDP | 71 | $15,446 | $29,375 | $45,625 |
| Paynes Creek | CDP | 56 | $29,325 | $51,250 | $75,000 |
| Proberta | CDP | 254 | $19,601 | $32,049 | $31,111 |
| Rancho Tehama Reserve | CDP | 1,356 | $14,323 | $26,306 | $29,485 |
| Red Bluff | City | 14,026 | $17,877 | $31,690 | $39,388 |
| Richfield | CDP | 243 | $21,631 | $42,969 | $43,438 |
| Tehama | City | 383 | $20,801 | $36,786 | $39,712 |
| Vina | CDP | 107 | $40,851 | $51,607 | [17] |
2010
The 2010 United States Census reported that Tehama County had a population of 63,463. The racial makeup of Tehama County was 51,721 (81.5%) White, 406 (0.6%) African American, 1,644 (2.6%) Native American, 656 (1.0%) Asian, 76 (0.1%) Pacific Islander, 6,258 (9.9%) from other races, and 2,702 (4.3%) from two or more races. Hispanic or Latino of any race were 13,906 persons (21.9%).[18]
| Population reported at 2010 United States Census | |||||||||
|---|---|---|---|---|---|---|---|---|---|
Population | American | American | | Islander | races | more races | or Latino (of any race) | ||
| Tehama County | 63,463 | 51,721 | 406 | 1,644 | 656 | 76 | 6,258 | 2,702 | 13,906 |
cities and towns | Population | American | American | | Islander | races | more races | or Latino (of any race) | |
| Corning | 7,663 | 5,510 | 44 | 201 | 82 | 11 | 1,496 | 319 | 3,271 |
| Red Bluff | 14,076 | 11,366 | 128 | 438 | 187 | 16 | 1,168 | 773 | 3,037 |
| Tehama | 418 | 346 | 6 | 23 | 1 | 0 | 27 | 15 | 57 |
places | Population | American | American | | Islander | races | more races | or Latino (of any race) | |
| Bend | 619 | 570 | 4 | 15 | 3 | 0 | 14 | 13 | 48 |
| Flournoy | 101 | 90 | 0 | 1 | 3 | 2 | 4 | 1 | 9 |
| Gerber | 1,060 | 575 | 6 | 55 | 8 | 0 | 371 | 45 | 526 |
| Lake California | 3,054 | 2,751 | 11 | 81 | 31 | 6 | 55 | 119 | 251 |
| Las Flores | 187 | 127 | 0 | 5 | 0 | 0 | 41 | 14 | 72 |
| Los Molinos | 2,037 | 1,581 | 0 | 39 | 7 | 2 | 321 | 87 | 537 |
| Manton | 347 | 312 | 0 | 20 | 1 | 0 | 7 | 7 | 35 |
| Mineral | 123 | 115 | 0 | 1 | 1 | 0 | 1 | 5 | 4 |
| Paskenta | 112 | 95 | 0 | 0 | 0 | 0 | 8 | 9 | 19 |
| Paynes Creek | 57 | 51 | 0 | 2 | 0 | 0 | 1 | 3 | 7 |
| Proberta | 267 | 174 | 0 | 7 | 1 | 1 | 76 | 8 | 91 |
| Rancho Tehama Reserve | 1,485 | 1,181 | 21 | 52 | 21 | 5 | 102 | 103 | 214 |
| Richfield | 306 | 264 | 0 | 4 | 0 | 0 | 35 | 3 | 65 |
| Vina | 237 | 195 | 1 | 7 | 2 | 0 | 20 | 12 | 42 |
communities | Population | American | American | | Islander | races | more races | or Latino (of any race) | |
| All others not CDPs (combined) | 31,314 | 26,418 | 185 | 693 | 308 | 33 | 2,511 | 1,166 | 5,621 |
2000
| Historical population | |||
|---|---|---|---|
| Census | Pop. | %± | |
| 1860 | 4,044 | — | |
| 1870 | 3,587 | −11.3% | |
| 1880 | 9,301 | 159.3% | |
| 1890 | 9,916 | 6.6% | |
| 1900 | 10,996 | 10.9% | |
| 1910 | 11,401 | 3.7% | |
| 1920 | 12,882 | 13.0% | |
| 1930 | 13,866 | 7.6% | |
| 1940 | 14,316 | 3.2% | |
| 1950 | 19,276 | 34.6% | |
| 1960 | 25,305 | 31.3% | |
| 1970 | 29,517 | 16.6% | |
| 1980 | 38,888 | 31.7% | |
| 1990 | 49,625 | 27.6% | |
| 2000 | 56,039 | 12.9% | |
| 2010 | 63,463 | 13.2% | |
| Est. 2015 | 63,308 | [19] | −0.2% |
| U.S. Decennial Census[20] 1790-1960[21] 1900-1990[22] 1990-2000[23] 2010-2015[1] | |||
As of the census[24] of 2000, there were 56,039 people, 21,013 households, and 14,898 families residing in the county. The population density was 19 people per square mile (7/km²). There were 23,547 housing units at an average density of 8 per square mile (3/km²). The racial makeup of the county was 84.8% White, 0.6% Black or African American, 2.1% Native American, 0.8% Asian, 0.1% Pacific Islander, 8.3% from other races, and 3.4% from two or more races. 15.8% of the population were Hispanic or Latino of any race. 14.4% were of German, 11.0% English, 9.6% Irish and 9.5% American ancestry according to Census 2000. 86.0% spoke English and 13.0% Spanish as their first language.
There were 21,013 households out of which 32.9% had children under the age of 18 living with them, 54.6% were married couples living together, 11.6% had a female householder with no husband present, and 29.1% were non-families. 24.0% of all households were made up of individuals and 11.5% had someone living alone who was 65 years of age or older. The average household size was 2.62 and the average family size was 3.08.
In the county the population was spread out with 27.4% under the age of 18, 7.8% from 18 to 24, 25.7% from 25 to 44, 23.2% from 45 to 64, and 15.9% who were 65 years of age or older. The median age was 38 years. For every 100 females there were 97.7 males. For every 100 females age 18 and over, there were 95.0 males.
The median income for a household in the county was $31,206, and the median income for a family was $37,277. Males had a median income of $30,872 versus $22,864 for females. The per capita income for the county was $15,793. About 13.0% of families and 17.3% of the population were below the poverty line, including 24.0% of those under age 18 and 9.2% of those age 65 or over.
Politics
Voter registration statistics
| Population and registered voters | ||
|---|---|---|
| Total population[8] | 62,985 | |
| Registered voters[25][note 4] | 30,485 | 48.4% |
| Democratic[25] | 9,163 | 30.1% |
| Republican[25] | 13,542 | 44.4% |
| Democratic–Republican spread[25] | -4,379 | -14.3% |
| Independent[25] | 1,502 | 4.9% |
| Green[25] | 125 | 0.4% |
| Libertarian[25] | 234 | 0.8% |
| Peace and Freedom[25] | 92 | 0.3% |
| Americans Elect[25] | 0 | 0.0% |
| Other[25] | 108 | 0.4% |
| No party preference[25] | 5,719 | 18.8% |
Cities by population and voter registration
| Cities by population and voter registration | |||||||
|---|---|---|---|---|---|---|---|
| City | Population[8] | Registered voters[25] [note 4] |
Democratic[25] | Republican[25] | D–R spread[25] | Other[25] | No party preference[25] |
| Corning | 7,624 | 33.8% | 35.2% | 35.1% | +0.1% | 11.7% | 22.8% |
| Red Bluff | 14,026 | 42.1% | 33.8% | 37.2% | -3.4% | 12.8% | 21.6% |
| Tehama | 383 | 54.3% | 35.1% | 39.9% | -4.8% | 15.4% | 16.8% |
Overview
| Year | GOP | DEM | Others |
|---|---|---|---|
| 2012 | 62.0% 14,235 | 34.5% 7,934 | 3.5% 808 |
| 2008 | 60.4% 14,843 | 36.4% 8,945 | 3.1% 772 |
| 2004 | 66.4% 15,572 | 32.0% 7,504 | 1.6% 368 |
| 2000 | 63.6% 13,270 | 31.2% 6,507 | 5.2% 1,077 |
| 1996 | 50.3% 10,292 | 35.7% 7,290 | 14.0% 2,861 |
| 1992 | 35.4% 7,419 | 35.8% 7,508 | 28.9% 6,052 |
| 1988 | 56.5% 9,854 | 41.4% 7,213 | 2.1% 367 |
| 1984 | 62.8% 11,586 | 35.4% 6,527 | 1.9% 342 |
| 1980 | 59.1% 9,140 | 31.3% 4,832 | 9.6% 1,485 |
| 1976 | 44.8% 6,110 | 51.3% 6,990 | 3.9% 535 |
| 1972 | 48.7% 6,054 | 41.7% 5,175 | 9.6% 1,195 |
| 1968 | 47.3% 5,198 | 41.5% 4,565 | 11.2% 1,236 |
| 1964 | 39.0% 4,529 | 60.4% 6,928 | 0.1% 10 |
| 1960 | 50.0% 5,522 | 49.6% 5,483 | 0.4% 47 |
| 1956 | 53.8% 4,866 | 45.8% 4,143 | 0.4% 33 |
| 1952 | 64.3% 5,742 | 34.8% 3,110 | 0.9% 77 |
| 1948 | 51.3% 3,348 | 44.7% 2,920 | 4.0% 262 |
| 1944 | 47.8% 2,903 | 51.5% 3,130 | 0.7% 41 |
| 1940 | 44.0% 2,913 | 54.6% 3,618 | 1.5% 97 |
| 1936 | 38.5% 2,376 | 59.7% 3,687 | 1.9% 115 |
| 1932 | 34.2% 2,001 | 60.4% 3,534 | 5.4% 316 |
| 1928 | 65.6% 3,393 | 31.9% 1,650 | 2.5% 131 |
| 1924 | 46.0% 1,943 | 11.5% 486 | 42.5% 1,798 |
| 1920 | 61.8% 2,462 | 27.1% 1,079 | 11.1% 442 |
Tehama is a strongly Republican county in Presidential and congressional elections. The last Democrat to win a majority in the county was Jimmy Carter in 1976. Bill Clinton won a plurality in 1992.
In the United States House of Representatives, Tehama County is in California's 1st congressional district, represented by Republican Doug LaMalfa.[26]
In the California State Legislature, the county is in the 4th Senate District, represented by Republican Jim Nielsen,[27] and the 3rd Assembly District, represented by Republican James Gallagher.
On November 4, 2008, Tehama County voted 72.7% for Proposition 8, which amended the California Constitution to ban same-sex marriages.[28]
Communities
Population ranking
The population ranking of the following table is based on the 2010 census of Tehama County.[29]
† county seat
| Rank | City/Town/etc. | Municipal type | Population (2010 Census)
|
|---|---|---|---|
| 1 | † Red Bluff | City | 14,076 |
| 2 | Corning | City | 7,663 |
| 3 | Lake California | CDP | 3,054 |
| 4 | Los Molinos | CDP | 2,037 |
| 5 | Rancho Tehema Reserve | CDP | 1,485 |
| 6 | Gerber | CDP | 1,060 |
| 7 | Bend | CDP | 619 |
| 8 | Tehama | City | 418 |
| 9 | Manton | CDP | 347 |
| 10 | Richfield | CDP | 306 |
| 11 | Proberta | CDP | 267 |
| 12 | Vina | CDP | 237 |
| 13 | Las Flores | CDP | 187 |
| 14 | Mineral | CDP | 123 |
| 15 | Paskenta | CDP | 112 |
| 16 | Flournoy | CDP | 101 |
| 17 | Paynes Creek | CDP | 57 |
See also
- Hiking trails in Tehama County
- National Register of Historic Places listings in Tehama County, California
- Orland Buttes
Notes
- ↑ Only larceny-theft cases involving property over $400 in value are reported as property crimes.
- ↑ Other = Some other race + Two or more races
- ↑ Native American = Native Hawaiian or other Pacific Islander + American Indian or Alaska Native
- 1 2 Percentage of registered voters with respect to total population. Percentages of party members with respect to registered voters follow.
References
- 1 2 3 4 "State & County QuickFacts". United States Census Bureau. Retrieved April 6, 2016.
- ↑ "Find a County". National Association of Counties. Retrieved 2011-06-07.
- ↑ E. J. Lewis ,1891,Tehama County History:A Memorial and Biographical History of Northern California, Lewis Publishing Co., Chicago
- ↑ Chan, Sucheng (2000). Wu, Jean; Song, Min, eds. Hostility and Conflict. Asian American studies : a reader. Rutgers University Press. p. 53. ISBN 0-8135-2726-0. Retrieved 2015-10-10. Via Google Books
- ↑ "THE ANTI-COOLIE MOVE. Tehama Taking a Hand—Chinese Leaving Sacramento.". Daily Alta California. San Francisco, California. 29 January 1886. p. 5, column 4. Retrieved 2015-10-10. Volume 40, Number 13304. Via California Digital Newspaper Collection of the University of California at Riverside
- ↑ "US Gazetteer files: 2010, 2000, and 1990". United States Census Bureau. 2011-02-12. Retrieved 2011-04-23.
- ↑
 Ripley, George; Dana, Charles A., eds. (1879). "Tehama". The American Cyclopædia.
- 1 2 3 4 5 6 7 8 9 10 11 12 13 14 15 16 17 U.S. Census Bureau. American Community Survey, 2011 American Community Survey 5-Year Estimates, Table B02001. American FactFinder. Retrieved 2013-10-26.
- 1 2 3 4 5 6 7 8 9 10 Office of the Attorney General, Department of Justice, State of California. Table 11: Crimes – 2009. Retrieved 2013-11-14.
- 1 2 3 United States Department of Justice, Federal Bureau of Investigation. Crime in the United States, 2012, Table 8 (California). Retrieved 2013-11-14.
- 1 2 U.S. Census Bureau. American Community Survey, 2011 American Community Survey 5-Year Estimates, Table B03003. American FactFinder. Retrieved 2013-10-26.
- 1 2 U.S. Census Bureau. American Community Survey, 2011 American Community Survey 5-Year Estimates, Table B19301. American FactFinder. Retrieved 2013-10-21.
- 1 2 U.S. Census Bureau. American Community Survey, 2011 American Community Survey 5-Year Estimates, Table B19013. American FactFinder. Retrieved 2013-10-21.
- 1 2 U.S. Census Bureau. American Community Survey, 2011 American Community Survey 5-Year Estimates, Table B19113. American FactFinder. Retrieved 2013-10-21.
- 1 2 U.S. Census Bureau. American Community Survey, 2011 American Community Survey 5-Year Estimates. American FactFinder. Retrieved 2013-10-21.
- ↑ U.S. Census Bureau. American Community Survey, 2011 American Community Survey 5-Year Estimates, Table B01003. American FactFinder. Retrieved 2013-10-21.
- ↑ Data unavailable
- ↑ "2010 Census P.L. 94-171 Summary File Data". United States Census Bureau.
- ↑ "County Totals Dataset: Population, Population Change and Estimated Components of Population Change: April 1, 2010 to July 1, 2015". Retrieved July 2, 2016.
- ↑ "U.S. Decennial Census". United States Census Bureau. Retrieved May 31, 2014.
- ↑ "Historical Census Browser". University of Virginia Library. Retrieved May 31, 2014.
- ↑ "Population of Counties by Decennial Census: 1900 to 1990". United States Census Bureau. Retrieved May 31, 2014.
- ↑ "Census 2000 PHC-T-4. Ranking Tables for Counties: 1990 and 2000" (PDF). United States Census Bureau. Retrieved May 31, 2014.
- ↑ "American FactFinder". United States Census Bureau. Retrieved 2011-05-14.
- 1 2 3 4 5 6 7 8 9 10 11 12 13 14 15 16 17 California Secretary of State. February 10, 2013 - Report of Registration. Retrieved 2013-10-31.
- ↑ "California's 1st Congressional District - Representatives & District Map". Civic Impulse, LLC. Retrieved February 28, 2013.
- ↑ "Communities of Interest — County". California Citizens Redistricting Commission. Retrieved September 28, 2014.
- ↑ "County Results - Election Center 2008 - Elections & Politics from CNN.com". cnn.com.
- ↑ http://www.census.gov/2010census/
External links
| Wikimedia Commons has media related to Tehama County, California. |
- Official website
- TehamaPulse.com is an online events calendar for Tehama County.
 |
Shasta County | | ||
| Trinity County | |
Plumas County | ||
| ||||
| | ||||
| Mendocino County | Glenn County and Butte County |
Municipalities and communities of Tehama County, California, United States | ||
|---|---|---|
| Cities | | |
| CDPs | ||
| Unincorporated communities |
| |
Coordinates: 40°08′N 122°14′W / 40.13°N 122.23°W