Lake County, California
| Lake County, California | ||
|---|---|---|
| County | ||
| County of Lake | ||
|
Clear Lake, the dominant geographic feature in Lake County | ||
| ||
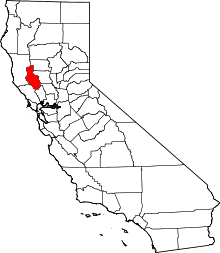 Location in the state of California | ||
 California's location in the United States | ||
| Country |
| |
| State |
| |
| Incorporated | May 20, 1861[1] | |
| Named for | Clear Lake | |
| County seat | Lakeport | |
| Area | ||
| • Total | 1,329 sq mi (3,440 km2) | |
| • Land | 1,256 sq mi (3,250 km2) | |
| • Water | 73 sq mi (190 km2) | |
| Highest elevation[2] | 7,059 ft (2,152 m) | |
| Population (April 1, 2010)[3] | ||
| • Total | 64,665 | |
| • Estimate (2015)[3] | 64,591 | |
| • Density | 49/sq mi (19/km2) | |
| Time zone | Pacific Standard Time (UTC-8) | |
| • Summer (DST) | Pacific Daylight Time (UTC-7) | |
| Area code | 707 | |
| FIPS code | 06-033 | |
| GNIS feature ID | 277281 | |
| Website | www.co.lake.ca.us | |

Lake County is a county located in the north central portion of the U.S. state of California. As of the 2010 census, the population was 64,665.[3] The county seat is Lakeport.[4] The county takes its name from Clear Lake, the dominant geographic feature in the county and the largest natural lake wholly within California[5] (Lake Tahoe is partially in Nevada; the Salton Sea was formed by flooding).
Lake County forms the Clearlake, CA Micropolitan Statistical Area.[6] It is directly north of the San Francisco Bay Area.
Lake County is part of California's Wine Country, which also includes Napa, Sonoma and Mendocino counties. It includes five American Viticultural Areas and over 35 wineries.
History
Lake County was formed in 1861 from parts of Napa and Mendocino counties,[7] but the area had European-American settlers from at least the 1840s. Lake County has long been known as a farming community.
The 1911 California Blue Book lists the major crops as Bartlett pears and beans. Other crops include grain, alfalfa, hay, prunes, peaches, apples, grapes and walnuts. Stockraising included goats, hogs, turkeys and dairying.[8]
Some vineyards were planted in the 1870s by European Americans but the first in the state were established in the 18th century by Spanish missionaries. By the early 20th century, the area was earning a reputation for producing some of the world's greatest wines. However, in 1920, national Prohibition essentially ended Lake County's wine production. With authorized cultivation limited to sacramental purposes, most of the vineyards were ripped out and replanted with walnut and pear farms.
Wine Country
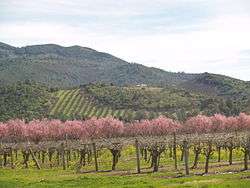
A re-emergence of Lake County's wine industry began in the 1960s when a few growers rediscovered the area's grape-growing potential and began planting vineyards. Several Lake County American Viticultural Areas, such as High Valley AVA and Red Hills Lake County AVA, have been recognized as having distinct character.
The area has increased vineyards from fewer than 100 acres in 1965 to more than 9,455 acres of vineyard in 2015 (a 7.6 percent increase over 2014).[9] Lake County's grape prices, at $1,634 per ton overall, also reached an all-time high in 2015.[9] In 2014, Lake County surpassed Mendocino County in price paid per ton of grapes in the North Coast premium market.[10]
The number of wineries also continues growing, with over 35 wineries now located in Lake County.[11] One notable new entry is Boatique Winery in Kelseyville, California, a Red Hills Lake County AVA region. It opened its tasting room in July and features a large complex and events center that also houses antique boats.[10]
Air Quality
Lake County has been consistently ranked by the American Lung Association as having the cleanest air in the nation, including in 2013, 2014 and 2015.[12] Lake County has also been ranked twenty-four times as having the cleanest air in California.[12]
Geography
According to the U.S. Census Bureau, the county has a total area of 1,329 square miles (3,440 km2), of which 1,256 square miles (3,250 km2) is land and 73 square miles (190 km2) (5.5%) is water.[13] Two main watercourses drain the county: Cache Creek, which is the outlet of Clear Lake; and Putah Creek. Both of these flow to the Sacramento River. The main streams which flow into Clear Lake are Forbes Creek, Scotts Creek, Middle Creek and Kelsey Creek. At the extreme north of the county Lake Pillsbury and the Van Arsdale Reservoir dam the Eel River, providing water and power to Ukiah in Mendocino County.
Clear Lake is believed to be the oldest lake in North America, due to a geological fluke. The lake sits on a huge block of stone which slowly tilts in the northern direction at the same rate as the lake fills in with sediment, thus keeping the water at roughly the same depth. The geology of the county is chaotic, being based on Franciscan Assemblage hills. Numerous small faults are present in the south end of the lake as well as many old volcanoes, the largest being Cobb Mountain. The geologic history of the county shows events of great violence, such as the eruption of Mount Konocti and Mount St. Helena and the collapse of Cow Mountain, which created the hills around the county seat of Lakeport. Blue Lakes, Lake Pillsbury, and Indian Valley Reservoir are the county's other major bodies of water.
Lake County has habitats for a variety of species of concern including the uncommon herb, Legenere limosa, the rare Eryngium constancei, and the tule elk. Waterfowl, bear, and other wildlife abound in the Clear Lake basin.
Due to its surrounding hilly terrain, Lake is the only one of California's 58 counties never to have been served by a railroad line.
National protected areas
- Mendocino National Forest (part)
- Cow Mountain Recreation Area
- Cache Creek Wilderness and Cache Creek Wildlife Area
In 2015 President Barack Obama created the Berryessa Snow Mountain National Monument, incorporating these and other areas.
State protected areas
- Boggs Mountain Demonstration State Forest
- Anderson Marsh State Historic Park
- Loch Lomond Vernal Pool Ecological Reserve
- Boggs Lake Ecological Reserve
- Clear Lake State Park
- Rodman Slough Preserve (108 acres managed by California Department of Fish and Game)
Mineral springs
In the late 19th century, the worldwide popularity of mineral water for the relief of myriad physical ailments resulted in the development of mineral resorts around Clear Lake.[14]
- Greene Bartlett discovered Bartlett hot springs in 1870. The springs were developed into a resort and by 1900 included a mineral water bottling plant. The resort burned down in 1934.[15]
- Harbin Hot Springs was developed by settlers in the 1860s. Unfortunately, Harbin burned to the ground in the Vally Fire of 2015.
- Highland Springs opened in 1891, and was destroyed by fire in 1945. During its time, Highland had an elegant dining room and a spacious hotel.[14]
- Saratoga Springs Resort was opened by J. J. Liebert in 1873 with several cabins, and within two decades had room for 350 guests.[16]
- Witter Springs Resort opened in 1873 with a hotel and guest cottages.[16]
Climate
Lake County has a mediterranean climate with hot summer daytime temperatures in its lower elevations. Nighttime temperatures remain cool year-round, somewhat moderating average temperatures and relieving the summer heat.
| Climate data for Clearlake, California (1981–2010 normals) | |||||||||||||
|---|---|---|---|---|---|---|---|---|---|---|---|---|---|
| Month | Jan | Feb | Mar | Apr | May | Jun | Jul | Aug | Sep | Oct | Nov | Dec | Year |
| Record high °F (°C) | 76 (24) |
81 (27) |
84 (29) |
94 (34) |
101 (38) |
114 (46) |
113 (45) |
112 (44) |
111 (44) |
104 (40) |
92 (33) |
78 (26) |
114 (46) |
| Average high °F (°C) | 55 (13) |
58 (14) |
62 (17) |
67 (19) |
75 (24) |
84 (29) |
92 (33) |
90 (32) |
85 (29) |
75 (24) |
62 (17) |
55 (13) |
71.7 (22) |
| Average low °F (°C) | 32 (0) |
34 (1) |
36 (2) |
39 (4) |
45 (7) |
51 (11) |
55 (13) |
53 (12) |
49 (9) |
42 (6) |
35 (2) |
32 (0) |
41.9 (5.6) |
| Record low °F (°C) | 8 (−13) |
16 (−9) |
17 (−8) |
23 (−5) |
28 (−2) |
34 (1) |
39 (4) |
40 (4) |
30 (−1) |
21 (−6) |
19 (−7) |
6 (−14) |
6 (−14) |
| Average precipitation inches (mm) | 6.45 (163.8) |
5.91 (150.1) |
4.53 (115.1) |
1.73 (43.9) |
1.13 (28.7) |
.22 (5.6) |
.02 (0.5) |
.10 (2.5) |
.43 (10.9) |
1.44 (36.6) |
3.51 (89.2) |
5.95 (151.1) |
31.42 (798) |
| Source: [17] | |||||||||||||
Demographics
2011
| Population, race, and income | |||||
|---|---|---|---|---|---|
| Total population[18] | 64,392 | ||||
| White[18] | 54,450 | 84.6% | |||
| Black or African American[18] | 1,440 | 2.2% | |||
| American Indian or Alaska Native[18] | 2,031 | 3.2% | |||
| Asian[18] | 727 | 1.1% | |||
| Native Hawaiian or other Pacific Islander[18] | 154 | 0.2% | |||
| Some other race[18] | 3,435 | 5.3% | |||
| Two or more races[18] | 2,155 | 3.3% | |||
| Hispanic or Latino (of any race)[19] | 10,784 | 16.7% | |||
| Per capita income[20] | $22,238 | ||||
| Median household income[21] | $39,525 | ||||
| Median family income[22] | $50,278 | ||||
Places by population, race, and income
| Places by population and race | ||||||||
|---|---|---|---|---|---|---|---|---|
| Place | Type[23] | Population[18] | White[18] | Other[18] [note 1] |
Asian[18] | Black or African American[18] |
Native American[18] [note 2] |
Hispanic or Latino (of any race)[19] |
| Clearlake | City | 15,134 | 76.9% | 14.2% | 1.0% | 5.4% | 2.5% | 23.9% |
| Clearlake Oaks | CDP | 1,291 | 85.8% | 2.8% | 0.0% | 5.0% | 6.4% | 0.8% |
| Clearlake Riviera | CDP | 2,850 | 96.3% | 0.8% | 0.0% | 2.2% | 0.7% | 12.7% |
| Cobb | CDP | 1,810 | 92.6% | 3.6% | 3.8% | 0.0% | 0.0% | 5.2% |
| Hidden Valley Lake | CDP | 6,243 | 87.2% | 9.4% | 1.4% | 0.0% | 2.0% | 17.1% |
| Kelseyville | CDP | 2,923 | 65.8% | 26.5% | 0.0% | 0.3% | 7.4% | 33.3% |
| Lakeport | City | 4,799 | 86.2% | 10.9% | 0.8% | 1.2% | 0.9% | 9.1% |
| Lower Lake | CDP | 1,308 | 71.9% | 11.7% | 0.5% | 0.0% | 15.9% | 13.3% |
| Lucerne | CDP | 2,493 | 76.1% | 2.4% | 0.5% | 5.3% | 15.6% | 4.6% |
| Middletown | CDP | 1,848 | 78.3% | 15.5% | 0.0% | 4.2% | 1.9% | 41.0% |
| Nice | CDP | 2,289 | 95.3% | 3.4% | 0.0% | 1.1% | 0.2% | 10.2% |
| North Lakeport | CDP | 3,514 | 89.8% | 6.4% | 2.0% | 0.6% | 1.1% | 21.7% |
| Soda Bay | CDP | 874 | 94.6% | 4.3% | 0.0% | 1.0% | 0.0% | 17.0% |
| Spring Valley | CDP | 1,120 | 97.1% | 1.0% | 0.0% | 1.9% | 0.0% | 4.6% |
| Upper Lake | CDP | 939 | 80.1% | 15.0% | 1.2% | 0.0% | 3.7% | 25.2% |
| Places by population and income | |||||
|---|---|---|---|---|---|
| Place | Type[23] | Population[24] | Per capita income[20] | Median household income[21] | Median family income[22] |
| Clearlake | City | 15,134 | $16,050 | $28,604 | $31,736 |
| Clearlake Oaks | CDP | 1,291 | $25,110 | $29,962 | $40,393 |
| Clearlake Riviera | CDP | 2,850 | $27,036 | $49,236 | $70,394 |
| Cobb | CDP | 1,810 | $28,876 | $71,544 | $90,608 |
| Hidden Valley Lake | CDP | 6,243 | $26,056 | $59,081 | $63,382 |
| Kelseyville | CDP | 2,923 | $17,607 | $41,461 | $46,324 |
| Lakeport | City | 4,799 | $28,301 | $45,302 | $61,450 |
| Lower Lake | CDP | 1,308 | $17,018 | $35,809 | $49,022 |
| Lucerne | CDP | 2,493 | $16,659 | $26,710 | $52,125 |
| Middletown | CDP | 1,848 | $16,261 | $42,159 | $43,125 |
| Nice | CDP | 2,289 | $18,303 | $29,167 | $34,701 |
| North Lakeport | CDP | 3,514 | $24,118 | $37,986 | $51,474 |
| Soda Bay | CDP | 874 | $26,170 | $55,096 | $61,083 |
| Spring Valley | CDP | 1,120 | $19,491 | $60,370 | $60,532 |
| Upper Lake | CDP | 939 | $14,312 | $28,255 | $29,792 |
2010
| Historical population | |||
|---|---|---|---|
| Census | Pop. | %± | |
| 1870 | 2,969 | — | |
| 1880 | 6,596 | 122.2% | |
| 1890 | 7,101 | 7.7% | |
| 1900 | 6,017 | −15.3% | |
| 1910 | 5,526 | −8.2% | |
| 1920 | 5,402 | −2.2% | |
| 1930 | 7,166 | 32.7% | |
| 1940 | 8,069 | 12.6% | |
| 1950 | 11,481 | 42.3% | |
| 1960 | 13,786 | 20.1% | |
| 1970 | 19,548 | 41.8% | |
| 1980 | 36,366 | 86.0% | |
| 1990 | 50,631 | 39.2% | |
| 2000 | 58,309 | 15.2% | |
| 2010 | 64,665 | 10.9% | |
| Est. 2015 | 64,591 | [25] | −0.1% |
| U.S. Decennial Census[26] 1790–1960[27] 1900–1990[28] 1990–2000[29] 2010–2015[3] | |||
The 2010 United States Census reported that Lake County had a population of 64,665. The racial makeup of Lake County was 52,033 (80.5%) White, 1,232 (1.9%) African American, 2,049 (3.2%) Native American, 724 (1.1%) Asian, 108 (0.2%) Pacific Islander, 5,455 (8.4%) from other races, and 3,064 (4.7%) from two or more races. Hispanic or Latino of any race were 11,088 persons (17.1%).[30]
| Population reported at 2010 United States Census | |||||||||
|---|---|---|---|---|---|---|---|---|---|
Population | American | American | | Islander | races | more races | or Latino (of any race) | ||
| Lake County | 64,665 | 52,033 | 1,232 | 2,049 | 724 | 108 | 5,455 | 3,064 | 11,088 |
city | Population | American | American | | Islander | races | more races | or Latino (of any race) | |
| Clearlake | 15,250 | 11,262 | 614 | 400 | 161 | 27 | 1,805 | 981 | 3,248 |
| Lakeport | 4,753 | 3,932 | 46 | 147 | 99 | 5 | 337 | 187 | 799 |
place | Population | American | American | | Islander | races | more races | or Latino (of any race) | |
| Clearlake Oaks | 2,359 | 2,054 | 54 | 45 | 34 | 1 | 60 | 111 | 192 |
| Clearlake Riviera | 3,090 | 2,641 | 36 | 75 | 40 | 5 | 167 | 126 | 424 |
| Cobb | 1,778 | 1,625 | 14 | 31 | 13 | 1 | 26 | 68 | 113 |
| Hidden Valley Lake | 5,579 | 4,830 | 63 | 80 | 75 | 12 | 326 | 193 | 733 |
| Kelseyville | 3,353 | 2,213 | 22 | 51 | 32 | 2 | 888 | 145 | 1,337 |
| Lower Lake | 1,294 | 1,031 | 20 | 18 | 13 | 1 | 125 | 86 | 219 |
| Lucerne | 3,067 | 2,581 | 60 | 105 | 26 | 9 | 94 | 192 | 367 |
| Middletown | 1,323 | 985 | 5 | 28 | 18 | 0 | 225 | 62 | 413 |
| Nice | 2,731 | 2,187 | 65 | 159 | 42 | 7 | 123 | 148 | 384 |
| North Lakeport | 3,314 | 2,685 | 28 | 126 | 40 | 4 | 271 | 160 | 571 |
| Soda Bay | 1,016 | 843 | 16 | 14 | 12 | 0 | 102 | 29 | 171 |
| Spring Valley | 845 | 766 | 15 | 10 | 6 | 3 | 24 | 21 | 71 |
| Upper Lake | 1,052 | 842 | 7 | 33 | 7 | 0 | 104 | 59 | 242 |
communities | Population | American | American | | Islander | races | more races | or Latino (of any race) | |
| All others not CDPs (combined) | 13,861 | 11,556 | 167 | 727 | 106 | 31 | 778 | 496 | 1,804 |
2005
There were a total of 34,031 homes in Lake County in 2005. This county has gone through a growth in housing units, adding a sum of 1,414 residential structures since 2001, a change of 4.3 percent. Lake County ranks 978 of 3,141, compared to change in residential structure growth in counties throughout the Unities States.
Lake County had a median home value in the year 2005 of $255,300, according to the American Community Survey. This median is less than the overall California 2005 home median value of $477,700 and greater than median home value of $167,500 for the rest of the nation in that year. In 2005, the American Community Survey reported that 14.4% of Lake County's owner-occupied dwellings are valued over a half a million dollars.
In the county the population was spread out with 24.1% under the age of 18, 6.0% from 18 to 24, 23.6% from 25 to 44, 26.8% from 45 to 64, and 19.5% who were 65 years of age or older. The median age was 43 years. For every 100 females there were 97.6 males. For every 100 females age 18 and over, there were 94.7 males.
The median income for a household in the county was $49,627, and the median income for a family was $55,818. Males had a median income of $45,771 versus $44,026 for females. The per capita income for the county was $43,825. About 6.9% of families and 4.6% of the population were below the poverty line, including 22.8% of those under age 18 and 7.3% of those age 65 or over. (Source: U.S. Census Bureau)
The recent sharp increase in per capita income can be directly linked to those people who have recently relocated to Lake County and telecommute to their jobs in the Bay Area. In addition, real estate values have risen due to a boom from 2003 to 2006, caused by Bay Area residents' discovery that Lake County residential real estate was lower in cost than that in adjacent Napa, Sonoma and Mendocino counties.
Within Lake County are two incorporated cities, the county seat of Lakeport and Clearlake, the largest city, and the communities of Kelseyville, Blue Lakes, Clearlake Oaks, Clearlake Park, Cobb, Finley, Glenhaven, Hidden Valley Lake, Clearlake Riviera, Loch Lomond, Lower Lake, Lucerne, Middletown, Nice, Spring Valley, Upper Lake, Whispering Pines, and Witter Springs.
The income of residents of the county varies widely. The county is the largest employer thus far, followed by large retailers such as Wal-Mart, Safeway, and Kmart. Several franchised retailers have recently entered the county (up 28% since 2003) and have created a diverse employment environment. Employment statistics continue to improve, again supported by the influx of Bay Area relocations and the benefit of telecommuting. Lake County is mostly agricultural, with tourist facilities and some light industry. Major crops include pears, walnuts and, increasingly, wine grapes.
2000
According to official estimates based on the 2000 Census, 30% of housing units in Lake County were manufactured housing units.[31] This was the highest percentage of any California county.[32]
Politics
Voter registration
| Population and registered voters | ||
|---|---|---|
| Total population[18] | 64,392 | |
| Registered voters[33][note 3] | 35,132 | 54.6% |
| Democratic[33] | 14,285 | 40.7% |
| Republican[33] | 9,664 | 27.5% |
| Democratic–Republican spread[33] | +4,621 | +13.2% |
| Independent[33] | 1,399 | 4.0% |
| Green[33] | 478 | 1.4% |
| Libertarian[33] | 278 | 0.8% |
| Peace and Freedom[33] | 157 | 0.4% |
| Americans Elect[33] | 2 | 0.0% |
| Other[33] | 71 | 0.2% |
| No party preference[33] | 8,798 | 25.0% |
Cities by population and voter registration
| Cities by population and voter registration | |||||||
|---|---|---|---|---|---|---|---|
| City | Population[18] | Registered voters[33] [note 3] |
Democratic[33] | Republican[33] | D–R spread[33] | Other[33] | No party preference[33] |
| Clearlake | 15,134 | 45.8% | 45.3% | 18.0% | +27.3% | 11.2% | 29.7% |
| Lakeport | 4,799 | 56.5% | 38.2% | 32.5% | +5.7% | 9.8% | 23.1% |
Overview
| Year | GOP | DEM | Others |
|---|---|---|---|
| 2012 | 39.3% 9,200 | 56.3% 13,163 | 4.4% 1,028 |
| 2008 | 38.8% 9,935 | 58.0% 14,854 | 3.3% 840 |
| 2004 | 44.9% 11,093 | 53.2% 13,141 | 2.8% 1,089 |
| 2000 | 41.6% 8,699 | 51.2% 10,717 | 7.2% 1,503 |
| 1996 | 35.0% 7,458 | 48.9% 10,432 | 16.1% 3,445 |
| 1992 | 28.8% 6,678 | 45.4% 10,548 | 25.8% 5,987 |
| 1988 | 48.0% 9,366 | 50.4% 9,828 | 1.6% 308 |
| 1984 | 54.8% 10,874 | 43.6% 8,648 | 1.6% 309 |
| 1980 | 53.6% 8,934 | 35.9% 5,978 | 10.5% 1,742 |
| 1976 | 44.5 5,462 | 51.9% 6,374 | 3.7% 449 |
| 1972 | 55.1% 6,477 | 40.1% 4,715 | 4.8% 558 |
| 1968 | 49.0% 4,464 | 41.5% 3,777 | 9.6% 870 |
| 1964 | 43.6% 3,616 | 56.4% 4,680 | 0.1% 6 |
| 1960 | 58.7% 4,176 | 40.8% 2,897 | 0.5% 36 |
| 1956 | 64.8% 4,073 | 34.8% 2,185 | 0.4% 24 |
| 1952 | 67.5% 4,367 | 31.5% 2,038 | 1.0% 63 |
| 1948 | 57.3% 3,054 | 37.5% 1,999 | 5.3% 280 |
| 1944 | 55.0% 2,059 | 44.6% 1,671 | 0.4% 16 |
| 1940 | 53.4% 2,215 | 45.7% 1,897 | 0.9% 39 |
| 1936 | 48.7% 1,797 | 49.8% 1,837 | 1.4% 53 |
| 1932 | 34.8% 1,301 | 62.6% 2,344 | 2.6% 99 |
| 1928 | 65.4% 1,820 | 33.3% 926 | 1.4% 38 |
| 1924 | 44.9% 795 | 14.8% 261 | 40.3% 713 |
| 1920 | 57.2% 993 | 32.9% 571 | 9.9% 171 |
Lake County leans Democratic in Presidential and congressional elections. The last Republican to win a majority in the county was Ronald Reagan in 1984.
Lake County is split between California's 3rd and 5th congressional districts, represented by John Garamendi (D–Walnut Grove) and Mike Thompson (D–St. Helena), respectively.[34]
In the state legislature, Lake is part of the 4th Assembly district and the 2nd Senate district.
On November 4, 2008, Lake County voted 52.6% for Proposition 8, which amended the California Constitution to ban same-sex marriages.[35]
Crime
The following table includes the number of incidents reported and the rate per 1,000 persons for each type of offense.
| Population and crime rates | ||
|---|---|---|
| Population[18] | 64,392 | |
| Violent crime[36] | 277 | 4.30 |
| Homicide[36] | 4 | 0.06 |
| Forcible rape[36] | 42 | 0.65 |
| Robbery[36] | 43 | 0.67 |
| Aggravated assault[36] | 188 | 2.92 |
| Property crime[36] | 1,110 | 17.24 |
| Burglary[36] | 609 | 9.46 |
| Larceny-theft[36][note 4] | 911 | 14.15 |
| Motor vehicle theft[36] | 221 | 3.43 |
| Arson[36] | 9 | 0.14 |
Cities by population and crime rates
| Cities by population and crime rates | ||||||||
|---|---|---|---|---|---|---|---|---|
| City | Population[37] | Violent crimes[37] | Violent crime rate per 1,000 persons |
Property crimes[37] | Property crime rate per 1,000 persons | |||
| Clearlake | 15,311 | 170 | 11.10 | 675 | 44.09 | |||
| Lakeport | 4,772 | 16 | 3.35 | 324 | 67.90 | |||
Economy
The main crops in 2011 and 2014 (in $1000's) are[38] [39]
| 2011 Rank | Crop | 2011 | 2014 |
| 1 | Grapes, Wine | 38,450 | 47,880 |
| 2 | Pears, Bartlett | 14,889 | 22,848 |
| 3 | Nursery Products, Misc. | 3,533 | 1,443 |
| 4 | Walnuts, English | 2,381 | 6,534 |
| 5 | Cattle & Calves, Unspecified | 1,895 | 2,174 |
| 6 | Pears, Asian | 1,558 | -- |
| 7 | Field Crops, Unspecified | 1,136 | 1,397 |
| 8 | Pasture, Range | 405 | 405 |
| 9 | Pears, Unspecified | 400 | 1,280 |
| 10 | Vegetables, Unspecified | 193 | 344 |
Transportation
Major highways
There are also several numbered county routes in Lake County.
Public transportation
Lake Transit serves all areas around Clear Lake. Local routes serve Lakeport, Clearlake and Lower Lake. Connections are also provided to St. Helena (Napa County) and Ukiah (Mendocino County). Some routes operate on weekdays only: no service is provided on Sundays and observed public holidays.[40][41]
Airports
Lampson Field is the county's public airport. There are also several private airstrips located throughout the county.
Railroads (historical)
In 1888 the Vaca Valley and Clear Lake Railroad reached Rumsey, but the planned line to Clear Lake was never built. The Clear Lake Railroad started work on a line from Hopland to Lakeport: "In November 1911 first ground was broken for the Hopland-Clear Lake railroad to Hopland. Mrs Harriet Lee Hammond, wife of the president of the road started construction. ... There were six miles of track out of Hopland ...", but this was also abandoned.[42][43][44]
Communities

Cities
Census-designated places
Unincorporated communities
Population ranking
The population ranking of the following table is based on the 2010 census of Lake County.[45]
† county seat
| Rank | City/Town/etc. | Municipal type | Population (2010 Census)
|
|---|---|---|---|
| 1 | Clearlake | City | 15,250 |
| 2 | Hidden Valley Lake | CDP | 5,579 |
| 3 | † Lakeport | City | 4,753 |
| 4 | Kelseyville | CDP | 3,353 |
| 5 | North Lakeport | CDP | 3,314 |
| 6 | Clearlake Riviera | CDP | 3,090 |
| 7 | Lucerne | CDP | 3,067 |
| 8 | Nice | CDP | 2,731 |
| 9 | Clearlake Oaks | CDP | 2,359 |
| 10 | Cobb | CDP | 1,778 |
| 11 | Middletown | CDP | 1,323 |
| 12 | Lower Lake | CDP | 1,294 |
| 13 | Upper Lake | CDP | 1,052 |
| 14 | Soda Bay | CDP | 1,016 |
| 15 | Spring Valley | CDP | 845 |
| 16 | Robinson Rancheria (Pomo Indians)[46] | AIAN | 207 |
| 17 | Big Valley Rancheria (Pomo Indians)[47] | AIAN | 139 |
| 18 | Upper Lake Rancheria (Pomo Indians)[48] | AIAN | 87 |
| 19 | Sulphur Bank Rancheria (Pomo Indians)[49] | AIAN | 61 |
| 20 | Middletown Rancheria (Pomo Indians)[50] | AIAN | 56 |
Notable people
- Lillie Langtry, British actress and royal mistress
- Michael Berryman, American actor
See also
- California wine
- Lampson Field Airport
- List of lakes in Lake County, California
- National Register of Historic Places listings in Lake County, California
Notes
- ↑ Other = Some other race + Two or more races
- ↑ Native American = Native Hawaiian or other Pacific Islander + American Indian or Alaska Native
- 1 2 Percentage of registered voters with respect to total population. Percentages of party members with respect to registered voters follow.
- ↑ Only larceny-theft cases involving property over $400 in value are reported as property crimes.
References
- ↑ "Lake County". Geographic Names Information System. United States Geological Survey.
- ↑ "Snow Mountain". Peakbagger.com. Retrieved April 9, 2015.
- 1 2 3 4 "State & County QuickFacts". United States Census Bureau. Retrieved April 4, 2016.
- ↑ "Find a County". National Association of Counties. Retrieved 2011-06-07.
- ↑ "Clear Lake Is Unique". Official Website of the County of Lake. County of Lake. 2013-09-13. Retrieved 2015-10-09.
- ↑ https://www.census.gov/econ/census02/data/metro1/M17340.HTM Clearlake, CA Micropolitan Statistical Area
- ↑ "Lake County, California". Genealogy Trails. 2006. Retrieved 2015-10-09.
- ↑ California Secretary of State (1911). California Blue Book. p. 655.
- 1 2 "Lake County's crop value surges past $100 million, setting new record". 2016-06-23. Retrieved 2016-07-02.
- 1 2 "Lake County wine industry is ready for takeoff". 2016-05-15. Retrieved 2016-07-02.
- ↑ "Wineries". www.lakecountywineries.org. Retrieved 2016-07-02.
- 1 2 "Lake County's air rated cleanest in the nation". 2015-04-30. Retrieved 2016-07-02.
- ↑ "2010 Census Gazetteer Files". United States Census Bureau. August 22, 2012. Retrieved September 26, 2015.
- 1 2 Sanderson, Marcia (2005). Lake County. Charlston, South Carolina: Arcadia Publishing. pp. 39–52. ISBN 978-0-7385-3030-7.
- ↑ "LAKE COUNTY HISTORY". Retrieved September 8, 2012.
- 1 2 "Lake County History Timeline". Retrieved September 8, 2012.
- ↑ http://www.wrcc.dri.edu/cgi-bin/cliMAIN.pl?ca1806
- 1 2 3 4 5 6 7 8 9 10 11 12 13 14 15 16 17 U.S. Census Bureau. American Community Survey, 2011 American Community Survey 5-Year Estimates, Table B02001. American FactFinder. Retrieved 2013-10-26.
- 1 2 U.S. Census Bureau. American Community Survey, 2011 American Community Survey 5-Year Estimates, Table B03003. American FactFinder. Retrieved 2013-10-26.
- 1 2 U.S. Census Bureau. American Community Survey, 2011 American Community Survey 5-Year Estimates, Table B19301. American FactFinder. Retrieved 2013-10-21.
- 1 2 U.S. Census Bureau. American Community Survey, 2011 American Community Survey 5-Year Estimates, Table B19013. American FactFinder. Retrieved 2013-10-21.
- 1 2 U.S. Census Bureau. American Community Survey, 2011 American Community Survey 5-Year Estimates, Table B19113. American FactFinder. Retrieved 2013-10-21.
- 1 2 U.S. Census Bureau. American Community Survey, 2011 American Community Survey 5-Year Estimates. American FactFinder. Retrieved 2013-10-21.
- ↑ U.S. Census Bureau. American Community Survey, 2011 American Community Survey 5-Year Estimates, Table B01003. American FactFinder. Retrieved 2013-10-21.
- ↑ "County Totals Dataset: Population, Population Change and Estimated Components of Population Change: April 1, 2010 to July 1, 2015". Retrieved July 2, 2016.
- ↑ "U.S. Decennial Census". United States Census Bureau. Retrieved September 26, 2015.
- ↑ "Historical Census Browser". University of Virginia Library. Retrieved September 26, 2015.
- ↑ Forstall, Richard L., ed. (March 27, 1995). "Population of Counties by Decennial Census: 1900 to 1990". United States Census Bureau. Retrieved September 26, 2015.
- ↑ "Census 2000 PHC-T-4. Ranking Tables for Counties: 1990 and 2000" (PDF). United States Census Bureau. April 2, 2001. Retrieved September 26, 2015.
- ↑ "2010 Census P.L. 94-171 Summary File Data". United States Census Bureau.
- ↑ U.S. Department of Commerce
- ↑ U.S. Department of Commerce
- 1 2 3 4 5 6 7 8 9 10 11 12 13 14 15 16 17 California Secretary of State. February 10, 2013 - Report of Registration. Retrieved 2013-10-31.
- ↑ "California's 3rd Congressional District - Representatives & District Map". Civic Impulse, LLC. Retrieved March 1, 2013.
- ↑ California Secretary of State: "Statement of Vote for November 4, 2008, General Election", page 62.
- 1 2 3 4 5 6 7 8 9 10 Office of the Attorney General, Department of Justice, State of California. Table 11: Crimes – 2009. Retrieved 2013-11-14.
- 1 2 3 United States Department of Justice, Federal Bureau of Investigation. Crime in the United States, 2012, Table 8 (California). Retrieved 2013-11-14.
- ↑ "California Agricultural Resource Directory 2010 –2011" (PDF). Mother Jones. Retrieved 1 March 2014.
- ↑ "California Agricultural Statistics Review 2013 –2014" (PDF). Retrieved 22 September 2015.
- ↑ http://laketransit.org/routes-schedules/
- ↑ http://laketransit.org/general-information/
- ↑ "Glimpses of the past". Cloverdale Reveille. 1 August 1984. Retrieved 28 February 2014.
- ↑ "CLEAR LAKE RAILROAD TO BEGIN WORK SOON". San Francisco Call. 30 September 1911. Retrieved 28 February 2014.
- ↑ Aurelius O. Carpenter And Percy H. Millberry, (Transcribed by Peggy Hooper) (1914). History of Mendocino and Lake Counties, California With Biographical Sketches. Historic Record Company, Los Angeles, California.
- ↑ http://www.census.gov/2010census/
- ↑ http://www.census.gov/2010census/popmap/ipmtext.php?fl=3195
- ↑ http://www.census.gov/2010census/popmap/ipmtext.php?fl=0275
- ↑ http://www.census.gov/2010census/popmap/ipmtext.php?fl=4430
- ↑ http://www.census.gov/2010census/popmap/ipmtext.php?fl=4030
- ↑ http://www.census.gov/2010census/popmap/ipmtext.php?fl=2255
External links
- Official website
- Lake County visitor website
- Lake County News
- Observer American Clear Lake Newspaper
- Lake County Record Bee Newspaper
- Lake County Community Resource Guide
- Wine country moves north (San Francisco Chronicle)
- Lake County Wineries
- The Ample Charms of a Well-Fed Lake, by Richerson & Richerson
- Lake County, California: History of the County
- Lake County Ca. Weather and Road Conditions
- Lake County Timeline
- Hiking trails in Lake County
 |
Glenn County | | ||
| Mendocino County | |
Colusa County | ||
| ||||
| | ||||
| Sonoma County | Napa County | Yolo County |
Coordinates: 39°05′N 122°46′W / 39.09°N 122.76°W