Sierra County, California
| Sierra County, California | |||||
|---|---|---|---|---|---|
| County | |||||
| County of Sierra | |||||
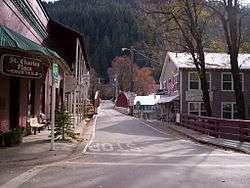
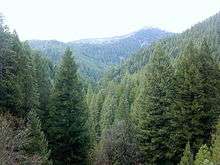
Images, from top down, left to right: Downieville, Conifer forest in the Tahoe National Forest, Stampede Dam | |||||
| |||||
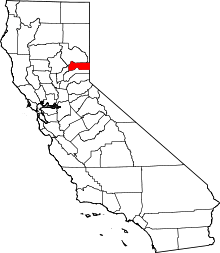 Location in the state of California | |||||
 California's location in the United States | |||||
| Country |
| ||||
| State |
| ||||
| Region | Sierra Nevada | ||||
| Incorporated | 1852 | ||||
| Named for | Sierra Nevada | ||||
| County seat | Downieville | ||||
| Largest city | Loyalton | ||||
| Government | |||||
| • Board of Supervisors |
Supervisors[1]
| ||||
| • Assemblymember | Brian Dahle (R) | ||||
| • State senator | Ted Gaines (R) | ||||
| • U. S. rep. | Doug LaMalfa (R) | ||||
| Area | |||||
| • Total | 2,490 km2 (962 sq mi) | ||||
| • Land | 2,470 km2 (953 sq mi) | ||||
| • Water | 20 km2 (9 sq mi) | ||||
| Population (April 1, 2010)[2] | |||||
| • Total | 3,240 | ||||
| • Estimate (2015)[2] | 2,967 | ||||
| • Density | 1.3/km2 (3.4/sq mi) | ||||
| Time zone | Pacific Standard Time (UTC-8) | ||||
| • Summer (DST) | Pacific Daylight Time (UTC-7) | ||||
| Area code(s) | 530 | ||||
| Website | www.sierracounty.ca.gov Website | ||||


Sierra County is a county located in the U.S. state of California. As of the 2010 census, the population was 3,240[2] making it the second-least populous county in California. The county seat is Downieville,[3] and the only incorporated city is Loyalton. The county is located in the Sierra Nevada, northeast of Sacramento on the border with Nevada.
History
Sierra County was formed from parts of Yuba County in 1852. The county derives its name from the Sierra Nevada.
Prior to the California Gold Rush, the area was home to both the Maidu and the Washoe peoples. They generally summered in the higher elevations to hunt and fish, and returned to lower elevations for the winter months.[4] After the discovery of gold in the Sierra foothills sparked the California Gold Rush, more than 16,000 miners settled in Sierra County between 1848-1860. Most mining settlements in the county sprung up along the North and Middle Forks of the Yuba River, both of which had rich deposits of gold. While some of the mining boom towns faded away once gold fever died down, other settlements such as Downieville and Sierra City have remained.[5][6]
Notable gold nuggets found in the county include a 26.5 pound specimen, avoirdupois, found by a group of sailors at Sailor Ravine, two miles above Downieville. A 51 pound specimen was found in 1853 by a group of Frenchmen in French Ravine. The 106 pound Monumental Nugget was found in Sept. 1869 at Sierra City.[7]
The Bald Mountain drift mine in Forest City was founded in Aug. 1864, and was the largest of its kind in the state at the time. The Bald Mountain Extension was located in 1874 east of Forest. The Monte Cristo Mine was located in 1854. The largest quartz-mine is the Sierra Buttes Gold Mine was located in 1850 near Sierra City. The Gold Bluff Mine was located near Downnieville in 1854. By 1880 the county was "crushing" 70,000 tons of quartz and had 266 miles of mining ditches.[7]
Geography
According to the U.S. Census Bureau, the county has a total area of 962 square miles (2,490 km2), of which 953 square miles (2,470 km2) is land and 9.0 square miles (23 km2) (0.9%) is water.[8]
Adjacent counties
- Nevada County, California - south
- Yuba County, California - west
- Plumas County, California - north
- Lassen County, California - northeast
- Washoe County, Nevada - east
National protected areas
- Plumas National Forest (part)
- Tahoe National Forest (part)
- Toiyabe National Forest (part)
Politics
Voter registration statistics
| Population and registered voters | ||
|---|---|---|
| Total population[9] | 3,277 | |
| Registered voters[10][note 1] | 2,223 | 67.8% |
| Democratic[10] | 631 | 28.4% |
| Republican[10] | 939 | 42.2% |
| Democratic–Republican spread[10] | -308 | -13.8% |
| Independent[10] | 126 | 5.7% |
| Green[10] | 24 | 1.1% |
| Libertarian[10] | 30 | 1.3% |
| Peace and Freedom[10] | 4 | 0.2% |
| Americans Elect[10] | 0 | 0.0% |
| Other[10] | 42 | 1.9% |
| No party preference[10] | 427 | 19.2% |
Cities by population and voter registration
| Cities by population and voter registration | |||||||
|---|---|---|---|---|---|---|---|
| City | Population[9] | Registered voters[10] [note 1] |
Democratic[10] | Republican[10] | D–R spread[10] | Other[10] | No party preference[10] |
| Loyalton | 890 | 49.1% | 32.3% | 38.7% | -6.4% | 14.6% | 19.9% |
Overview
| Year | GOP | DEM | Others |
|---|---|---|---|
| 2012 | 58.7% 1,056 | 36.3% 653 | 5.0% 90 |
| 2008 | 58.2% 1,158 | 37.3% 743 | 4.5% 90 |
| 2004 | 64.1% 1,249 | 33.2% 646 | 2.7% 53 |
| 2000 | 63.5% 1,172 | 29.2% 540 | 7.3% 135 |
| 1996 | 51.4% 877 | 33.6% 573 | 15.1% 257 |
| 1992 | 36.9% 691 | 34.8% 653 | 28.3% 531 |
| 1988 | 50.7% 860 | 46.6% 791 | 2.7% 45 |
| 1984 | 56.9% 1,078 | 41.2% 781 | 2.0% 37 |
| 1980 | 49.8% 855 | 37.9% 651 | 12.3% 212 |
| 1976 | 43.2% 680 | 53.4% 841 | 3.5% 55 |
| 1972 | 47.5% 629 | 49.7% 658 | 2.8% 37 |
| 1968 | 45.9% 548 | 46.9% 559 | 7.2% 86 |
| 1964 | 33.3% 413 | 66.7% 828 | 0.0% 0 |
| 1960 | 46.8% 576 | 52.6% 647 | 0.7% 8 |
| 1956 | 50.6% 638 | 49.1% 620 | 0.3% 4 |
| 1952 | 53.8% 822 | 45.7% 698 | 0.6% 9 |
| 1948 | 43.4% 546 | 52.5% 660 | 4.1% 52 |
| 1944 | 39.9% 443 | 59.6% 662 | 0.5% 5 |
| 1940 | 32.4% 511 | 67.0% 1,057 | 0.6% 10 |
| 1936 | 22.6% 340 | 76.4% 1,152 | 1.0% 15 |
| 1932 | 25.5% 292 | 69.4% 796 | 5.1% 59 |
| 1928 | 51.5% 457 | 47.4% 420 | 1.1% 10 |
| 1924 | 38.9% 276 | 10.3% 73 | 50.8% 360 |
| 1920 | 72.2% 506 | 22.5% 158 | 5.3% 37 |
Sierra County at one time had favored the Democratic party in Presidential elections and was one of few counties in California to be won by George McGovern. In more recent times it is a strongly Republican county in Presidential and congressional elections. The last Democrat to win a majority in the county was Jimmy Carter in 1976.
On November 4, 2008 Sierra County voted 64.2% for Proposition 8, which amended the California Constitution to ban same-sex marriages.
Transportation
Major highways
County roads
 County Route A23
 County Route A24
- Henness Pass Road
- Stampede Dam Road
- Gold Lake Road/Highway
Public transportation
Public transportation in Sierra County is limited to vans run by senior citizen agencies in Downieville and Loyalton which the general public may ride on a space-available basis.[11]
Airport
Sierraville-Dearwater Field Airport is a general aviation airport located near Sierraville.
Crime
The following table includes the number of incidents reported and the rate per 1,000 persons for each type of offense.
| Population and crime rates | ||
|---|---|---|
| Population[9] | 3,277 | |
| Violent crime[12] | 13 | 3.97 |
| Homicide[12] | 0 | 0.00 |
| Forcible rape[12] | 0 | 0.00 |
| Robbery[12] | 0 | 0.00 |
| Aggravated assault[12] | 13 | 3.97 |
| Property crime[12] | 33 | 10.07 |
| Burglary[12] | 15 | 4.58 |
| Larceny-theft[12][note 2] | 28 | 8.54 |
| Motor vehicle theft[12] | 0 | 0.00 |
| Arson[12] | 1 | 0.31 |
Demographics
2011
| Population, race, and income | |||||
|---|---|---|---|---|---|
| Total population[9] | 3,277 | ||||
| White[9] | 3,031 | 92.5% | |||
| Black or African American[9] | 38 | 1.2% | |||
| American Indian or Alaska Native[9] | 11 | 0.3% | |||
| Asian[9] | 3 | 0.1% | |||
| Native Hawaiian or other Pacific Islander[9] | 0 | 0.0% | |||
| Some other race[9] | 179 | 5.5% | |||
| Two or more races[9] | 15 | 0.5% | |||
| Hispanic or Latino (of any race)[13] | 247 | 7.5% | |||
| Per capita income[14] | $26,137 | ||||
| Median household income[15] | $50,308 | ||||
| Median family income[16] | $56,469 | ||||
Places by population, race, and income
| Places by population and race | ||||||||
|---|---|---|---|---|---|---|---|---|
| Place | Type[17] | Population[9] | White[9] | Other[9] [note 3] |
Asian[9] | Black or African American[9] |
Native American[9] [note 4] |
Hispanic or Latino (of any race)[13] |
| Alleghany | CDP | 65 | 100.0% | 0.0% | 0.0% | 0.0% | 0.0% | 0.0% |
| Calpine | CDP | 194 | 100.0% | 0.0% | 0.0% | 0.0% | 0.0% | 0.0% |
| Downieville | CDP | 192 | 100.0% | 0.0% | 0.0% | 0.0% | 0.0% | 0.0% |
| Goodyears Bar | CDP | 156 | 100.0% | 0.0% | 0.0% | 0.0% | 0.0% | 0.0% |
| Loyalton | City | 890 | 89.0% | 8.1% | 0.2% | 1.5% | 1.2% | 12.5% |
| Pike | CDP | 174 | 88.5% | 3.4% | 0.0% | 8.0% | 0.0% | 3.4% |
| Sattley | CDP | 28 | 100.0% | 0.0% | 0.0% | 0.0% | 0.0% | 0.0% |
| Sierra Brooks | CDP | 237 | 100.0% | 0.0% | 0.0% | 0.0% | 0.0% | 0.0% |
| Sierra City | CDP | 279 | 96.8% | 3.2% | 0.0% | 0.0% | 0.0% | 0.0% |
| Sierraville | CDP | 229 | 49.3% | 45.9% | 0.0% | 4.8% | 0.0% | 45.9% |
| Verdi | CDP | 158 | 100.0% | 0.0% | 0.0% | 0.0% | 0.0% | 0.0% |
| Places by population and income | |||||
|---|---|---|---|---|---|
| Place | Type[17] | Population[18] | Per capita income[14] | Median household income[15] | Median family income[16] |
| Alleghany | CDP | 65 | $16,843 | $30,278 | $30,278 |
| Calpine | CDP | 194 | $16,634 | $15,132 | [19] |
| Downieville | CDP | 192 | $22,868 | $2,499 | $52,266 |
| Goodyears Bar | CDP | 156 | $32,788 | $72,794 | $73,162 |
| Loyalton | City | 890 | $23,641 | $51,756 | $51,893 |
| Pike | CDP | 174 | $24,933 | $35,703 | $30,938 |
| Sattley | CDP | 28 | [19] | [19] | [19] |
| Sierra Brooks | CDP | 237 | $33,134 | $55,547 | $55,703 |
| Sierra City | CDP | 279 | $27,729 | $110,938 | $113,750 |
| Sierraville | CDP | 229 | $17,214 | $12,120 | $11,944 |
| Verdi | CDP | 158 | $46,291 | $76,987 | [19] |
2010
| Historical population | |||
|---|---|---|---|
| Census | Pop. | %± | |
| 1860 | 11,387 | — | |
| 1870 | 5,619 | −50.7% | |
| 1880 | 6,623 | 17.9% | |
| 1890 | 5,051 | −23.7% | |
| 1900 | 4,017 | −20.5% | |
| 1910 | 4,098 | 2.0% | |
| 1920 | 1,783 | −56.5% | |
| 1930 | 2,422 | 35.8% | |
| 1940 | 3,025 | 24.9% | |
| 1950 | 2,410 | −20.3% | |
| 1960 | 2,247 | −6.8% | |
| 1970 | 2,365 | 5.3% | |
| 1980 | 3,073 | 29.9% | |
| 1990 | 3,318 | 8.0% | |
| 2000 | 3,555 | 7.1% | |
| 2010 | 3,240 | −8.9% | |
| Est. 2015 | 2,967 | [20] | −8.4% |
| U.S. Decennial Census[21] 1790-1960[22] 1900-1990[23] 1990-2000[24] 2010-2015[2] | |||
The 2010 United States Census reported that Sierra County had a population of 3,240. The racial makeup of Sierra County was 3,022 (93.3%) White, 6 (0.2%) African American, 44 (1.4%) Native American, 12 (0.4%) Asian, 2 (0.1%) Pacific Islander, 75 (2.3%) from other races, and 79 (2.4%) from two or more races. Hispanic or Latino of any race were 269 persons (8.3%).[25]
| Population reported at 2010 United States Census | |||||||||
|---|---|---|---|---|---|---|---|---|---|
Population | American | American | | Islander | races | more races | or Latino (of any race) | ||
| Sierra County | 3,240 | 3,022 | 6 | 44 | 12 | 2 | 75 | 79 | 269 |
cities and towns | Population | American | American | | Islander | races | more races | or Latino (of any race) | |
| Loyalton | 769 | 701 | 2 | 21 | 0 | 0 | 20 | 25 | 108 |
places | Population | American | American | | Islander | races | more races | or Latino (of any race) | |
| Alleghany | 58 | 58 | 0 | 0 | 0 | 0 | 0 | 0 | 1 |
| Calpine | 205 | 184 | 0 | 0 | 0 | 1 | 10 | 10 | 26 |
| Downieville | 282 | 269 | 0 | 4 | 2 | 0 | 0 | 7 | 12 |
| Goodyears Bar | 68 | 64 | 0 | 4 | 0 | 0 | 0 | 0 | 1 |
| Pike | 134 | 130 | 0 | 1 | 2 | 0 | 0 | 1 | 2 |
| Sattley | 49 | 48 | 0 | 1 | 0 | 0 | 0 | 0 | 1 |
| Sierra Brooks | 478 | 466 | 0 | 4 | 1 | 1 | 0 | 6 | 22 |
| Sierra City | 221 | 200 | 0 | 2 | 3 | 0 | 12 | 4 | 21 |
| Sierraville | 200 | 187 | 2 | 0 | 0 | 0 | 10 | 1 | 16 |
| Verdi | 162 | 153 | 0 | 0 | 1 | 0 | 5 | 3 | 10 |
communities | Population | American | American | | Islander | races | more races | or Latino (of any race) | |
| All others not CDPs (combined) | 614 | 562 | 2 | 7 | 3 | 0 | 18 | 22 | 49 |
2000
As of the census[26] of 2000, there were 3,555 people, 1,520 households and 986 families residing in the county. The population density was 4 people per square mile (1/km²). There were 2,202 housing units at an average density of 2 per square mile (1/km²). The racial makeup of the county was 94.2% White, 0.2% Black or African American, 1.9% Native American, 0.2% Asian, 0.1% Pacific Islander, 1.0% from other races, and 2.5% from two or more races. Six percent of the population were Hispanic or Latino of any race.
Eighteen percent were of English ancestry, 16% were of Irish, 11% German and 8% Italian ancestry.[27] Over ninety-five (95.3) percent spoke English and 3.4% Spanish as their first language.
There were 1,520 households out of which 27.6% had children under the age of 18 living with them, 53.1% were married couples living together, 7.9% had a female householder with no husband present, and 35.1% were non-families. 29.0% of all households were made up of individuals and 11.5% had someone living alone who was 65 years of age or older. The average household size was 2.32 and the average family size was 2.83.
In the county the population was spread out with 23.3% under the age of 18, 4.8% from 18 to 24, 24.0% from 25 to 44, 30.2% from 45 to 64, and 17.7% who were 65 years of age or older. The median age was 44 years. For every 100 females there were 102.0 males. For every 100 females age 18 and over, there were 97.9 males.
The median income for a household in the county was $35,827, and the median income for a family was $42,756. Males had a median income of $36,121 versus $30,000 for females. The per capita income for the county was $18,815. About 9.0% of families and 11.3% of the population were below the poverty line, including 14.3% of those under age 18 and 2.2% of those age 65 or over.
Education
Communities
City
Census-designated places
Unincorporated communities
Ghost towns
- Eureka City
- Howland Flat
- Pine Grove
- Poker Flat
- Potosi
- Shady Flat
Population ranking
The population ranking of the following table is based on the 2010 census of Sierra County.[28]
† county seat
| Rank | City/Town/etc. | Municipal type | Population (2010 Census)
|
|---|---|---|---|
| 1 | Loyalton | City | 769 |
| 2 | Sierra Brooks | CDP | 478 |
| 3 | † Downieville | CDP | 282 |
| 4 | Sierra City | CDP | 221 |
| 5 | Calpine | CDP | 205 |
| 6 | Sierraville | CDP | 200 |
| 7 | Verdi | CDP | 162 |
| 8 | Pike | CDP | 134 |
| 9 | Goodyears Bar | CDP | 68 |
| 10 | Alleghany | CDP | 58 |
| 11 | Sattley | CDP | 49 |
Trivia
- Because Loyalton is Sierra County's most populous municipality and its only incorporated city, generally half of the meetings of the county's board of supervisors are held in Downieville and the other half are held in Loyalton.[29]
- There is only one traffic signal (a flashing red light at the intersection of highways 49 and 89) in Sierra County. In the winter of 2007 it was removed after an automobile accident and was replaced in the fall of 2008.
- In the 2009 special statewide election, Sierra County had the highest voter turnout of any county in California, with 53.6% of registered voters participating, according to the Los Angeles Times. The election was nearly double the overall voter turnout in the state, about 23%.[30]
See also
- Hiking trails in Sierra County
- National Register of Historic Places listings in Sierra County, California
Notes
- 1 2 Percentage of registered voters with respect to total population. Percentages of party members with respect to registered voters follow.
- ↑ Only larceny-theft cases involving property over $400 in value are reported as property crimes.
- ↑ Other = Some other race + Two or more races
- ↑ Native American = Native Hawaiian or other Pacific Islander + American Indian or Alaska Native
References
- ↑ "Board of Supervisors". County of Sierra. Retrieved November 28, 2016.
- 1 2 3 4 "State & County QuickFacts". United States Census Bureau. Retrieved April 6, 2016.
- ↑ "Find a County". National Association of Counties. Retrieved 2011-06-07.
- ↑ Sierra County History, 2008, The Online Guide to Sierra County, accessed 02 April 2013
- ↑ Deadlink April 2013
- ↑ Sierra Valley, Sierra County History, 2012, East Sierra Valley Chamber of Commerce, accessed 02 April 2013
- 1 2 Gilbert, Frank; Wells, Harry (1882). Illustrated History of Plumas, Lassen & Sierra Counties, with California from 1513 to 1850. San Francisco: Fariss & Smith. pp. 478–483.
- ↑ "US Gazetteer files: 2010, 2000, and 1990". United States Census Bureau. 2011-02-12. Retrieved 2011-04-23.
- 1 2 3 4 5 6 7 8 9 10 11 12 13 14 15 16 17 U.S. Census Bureau. American Community Survey, 2011 American Community Survey 5-Year Estimates, Table B02001. American FactFinder. Retrieved 2013-10-26.
- 1 2 3 4 5 6 7 8 9 10 11 12 13 14 15 16 17 California Secretary of State. February 10, 2013 - Report of Registration. Retrieved 2013-10-31.
- ↑ County of Sierra, Calif (2006-04-19). "Sierra County 2005 Regional Transportation Plan" (PDF). Sierra County 2005 Regional Transportation Plan. Archived from the original (PDF) on 2006-10-18. Retrieved 2007-04-01.
- 1 2 3 4 5 6 7 8 9 10 Office of the Attorney General, Department of Justice, State of California. Table 11: Crimes – 2009. Retrieved 2013-11-14.
- 1 2 U.S. Census Bureau. American Community Survey, 2011 American Community Survey 5-Year Estimates, Table B03003. American FactFinder. Retrieved 2013-10-26.
- 1 2 U.S. Census Bureau. American Community Survey, 2011 American Community Survey 5-Year Estimates, Table B19301. American FactFinder. Retrieved 2013-10-21.
- 1 2 U.S. Census Bureau. American Community Survey, 2011 American Community Survey 5-Year Estimates, Table B19013. American FactFinder. Retrieved 2013-10-21.
- 1 2 U.S. Census Bureau. American Community Survey, 2011 American Community Survey 5-Year Estimates, Table B19113. American FactFinder. Retrieved 2013-10-21.
- 1 2 U.S. Census Bureau. American Community Survey, 2011 American Community Survey 5-Year Estimates. American FactFinder. Retrieved 2013-10-21.
- ↑ U.S. Census Bureau. American Community Survey, 2011 American Community Survey 5-Year Estimates, Table B01003. American FactFinder. Retrieved 2013-10-21.
- 1 2 3 4 5 Data unavailable
- ↑ "County Totals Dataset: Population, Population Change and Estimated Components of Population Change: April 1, 2010 to July 1, 2015". Retrieved July 2, 2016.
- ↑ "U.S. Decennial Census". United States Census Bureau. Retrieved May 31, 2014.
- ↑ "Historical Census Browser". University of Virginia Library. Retrieved May 31, 2014.
- ↑ "Population of Counties by Decennial Census: 1900 to 1990". United States Census Bureau. Retrieved May 31, 2014.
- ↑ "Census 2000 PHC-T-4. Ranking Tables for Counties: 1990 and 2000" (PDF). United States Census Bureau. Retrieved May 31, 2014.
- ↑ "2010 Census P.L. 94-171 Summary File Data". United States Census Bureau.
- ↑ "American FactFinder". United States Census Bureau. Retrieved 2011-05-14.
- ↑ Sierra County, CA ANCESTRY & FAMILY HISTORY, 2007, accessed 02 April 2013
- ↑ http://www.census.gov/2010census/
- ↑ "Sierra County Government Directory". Retrieved 2011-03-05.
- ↑ La Ganga, Maria L., Sierra County (where everyone votes by mail) is serious about elections, 22 May 2009, Los Angeles Times, accessed 02 April 2013
External links
- Official website
- Sierra County Chamber of Commerce
- Sierra County Visitor Guide
- Sierra County Office of Education
- Discover Sierra County
 |
Plumas County | Lassen County | | |
| Yuba County | |
Washoe County, Nevada | ||
| ||||
| | ||||
| Nevada County |
Municipalities and communities of Sierra County, California, United States | ||
|---|---|---|
| City | | |
| CDPs | ||
| Unincorporated communities | ||
| Ghost towns |
| |
Coordinates: 39°35′N 120°30′W / 39.59°N 120.50°W