Economy of California
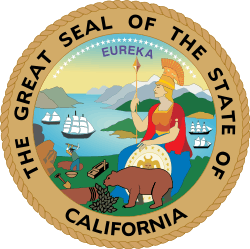 The Seal of California features sailing ships in the background, symbolizing the state's economic power. | |
| Statistics | |
|---|---|
| GDP | $2.496 trillion (2015) |
GDP per capita | $63,763 (2015)[1] |
Population below poverty line | 16.4% (absolute)[2] 23.5% (relative) [3] |
Labor force | 18,600,000 (June 2014)[4] |
| Unemployment | 5.2% (May 2016)[5] |
| Public finances | |
| Expenses | $220 billion (2011–12) State and local[6] |
The economy of California is the largest in the United States. As of 2015, California's gross state product (GSP) is about $2.496 trillion. The state's GSP grew 4.1% in 2015.[7]
History
California has experienced waves of migration. Once the Treaty of Guadalupe Hidalgo was signed in 1848 with Mexico that acquired and paid for the thinly settled future states of California, Nevada, Utah, Arizona, New Mexico as well as the independent territory of Texas the newly acquired territories underwent rapid and extensive development. In 1847, California was controlled (with much difficulty due to deserters leaving to look for gold) by a U.S. Army-appointed military governor and an inadequate force of a little over 600 troops. After the finding of extensive gold deposits in California the California gold rush started in 1848. Commerce and economic activity in California initially centered around the vastly expanded cities of San Francisco, San Jose and Sacramento as they scrambled to supply the hordes of gold miners. Los Angeles initially remained a sleepy backwater of less than 5,000 residents. Before 1850 government was judged inadequate and poorly run and statehood status was sought to start trying to remedy this problem. Due to the California Gold Rush, by 1850 California had grown to have a non-Indian and non-Californio population (about 7,000 Californios were residing in California in 1850) of over 110,000.[8] Despite a major conflict in the U.S. Congress on the number of slave versus non-slave states, the large, rapid and continuing California population gains and the large amount of gold being exported east gave California enough clout to choose its own extensive boundaries, elect its representatives and senators, write its Constitution, and be admitted to the Union as a free state in 1850 without going through territorial status as required for most other new states.
Soon after statehood in 1850 the state required and paid through taxes for nearly universal elementary school education. Other private schools were founded and are still doing well. In the 1930s the California was a leader in the high school movement to educate students beyond elementary school. State-subsidized college educations have a long history in California as well as many private elementary, middle, high schools, colleges and universities. There are three public funded higher education systems in the state: the California State University (CSU) (founded 1857), the University of California (UC) system (founded 1868), and the California Community College System (CCCS) founded in 1967. CSU is the largest university system in the United States.[9] CSU has 23 campuses and eight off-campus centers enrolling 437,000 students with 44,000 faculty members and staff,[10] The University of California was founded in 1868 in Berkeley as a state supported university. As of fall 2011, the University of California has 10 campuses, a combined student body of 234,464 students, 18,896 faculty members, 189,116 staff members, and over 1,600,000 living alumni.[11] The California Community College System consisting of 112 community colleges in 72 community college districts in California has over 1,800,000 students. California also has an extensive private college system of over 133 colleges and universities including California Institute of Technology and Stanford University.(See: List of colleges and universities in California)
About half the settlers coming to California after 1846 came by the wagon trains on the California Trail (a trip of about 140–160 days). The other half came by sea via paddle steamers going to and from the Isthmus of Panama or Nicaragua (about a 40+ day trip). The building of the Panama Railroad in 1855 made this a much more used route especially for passengers. The other main sailing ship route was going around Cape Horn, about a 120-day (via Clippers) or 200 day trip by regular sailing ship. Nearly all freight to California till 1869 took this long route around South America—shipping by ship has nearly always been relatively slow but cheap. Overland shipping was too difficult and took too long for nearly all cargo. The First Transcontinental Telegraph replaced the Pony Express in 1861 and established the first rapid communication with the east coast. The First Transcontinental Railroad was completed across the future states of Nebraska, Wyoming, Utah and the new states of Nevada (est. 1864) and California in 1869 and cut this trip to about 7 days. This rail link tied California and the rest of the Pacific states firmly into the union and led to much more rapid and profitable commerce between the states. In 1886 the first refrigerated cars on the Southern Pacific Railroad entered operation. The loading of such cars with oranges, at Los Angeles on February 14, 1886, started an economic boom in the citrus industry of Southern California, by making deliveries of perishable fruits and vegetables to the eastern United States possible.
Early farming in the state was primarily concentrated near the coast, and the Sacramento–San Joaquin River Delta in the Central Valley. Winter wheat was an early crop that grew well without irrigation if planted in the fall and harvested in the spring. By the 1880s extensive grape fields for producing wine were being planted in many areas in California. Many of the vine stock originally came from France and other parts of Europe. Starting in the late 1880s, Chinese workers and other laborers were used to construct hundreds of miles of levees throughout the Sacramento–San Joaquin River Delta's waterways in an effort to control flooding, reclaim and preserve flooded land that could be converted into farmland. This area now often grows extensive rice crops. Subsequent irrigation projects have brought many more parts of the Central Valley into productive agriculture use. The Central Valley Project, formed in 1935 to redistribute water from northern California to the Central valley and Southern California helped develop more of the Central Valley. Water for agricultural and municipal purposes was captured in the spring from snow melt in the Sierra Nevada (U.S.) and stored for later irrigation use with an extensive system of dams and canals. The even larger California State Water Project was formed in the 1950s, consisting of the California Aqueduct and its ancillary dams. The California Aqueduct, developed at the cost of several billion dollars, helps store and transport water from the Feather River Basin to agricultural and municipal users statewide. The Colorado River Aqueduct delivers water from the Colorado River to the Imperial Valley of California area and since 1905 the Los Angeles Aqueduct delivers water over from the Owens Valley to the city of Los Angeles. One of the state's most acute problems is its appetite for water. In the extensive fields of the Imperial Valley, irrigation is facilitated in part by the All-American Canal—part of the Colorado River Aqueduct project. Cutbacks in federally funded water projects in the 1970s and 80s led many cities to begin buying water from areas with a surplus; but political problems associated with water distribution continue. Ongoing challenges to develop a long-term plan to end surplus water withdrawals from the Colorado led the federal government to stop the release of surplus river water to the state in 2003.
Agriculture is one of the prominent elements of the state's economy: California leads the nation in the production of fruits, vegetables, wines and nuts. The state's most valuable crops are cannabis,[12] nuts, grapes, cotton, flowers, and oranges. California produces the major share of U.S. domestic wine. Dairy products contribute the single largest share of farm income. California's farms are highly productive as a result of good soil, a long growing season, the use of modern agricultural methods and extensive irrigation. Irrigation is critical since the long dry summers would not allow most crops to grow here--California Indians had almost no agriculture because of this. Extensive and expensive irrigation systems including furrow "gravity" irrigation, sprinkler and drip irrigation systems have been developed to supply the extensive irrigation needs of California.[13] Illegal immigration to the United States has been traditionally drawn to the state, in part, because corporations face intense pressure to control labor costs by using illegal means to harvest California's extensive crops.
| Top publicly traded companies in California for 2011 according to revenues with State and U.S. rankings | |||||
| State | Corporation | US | |||
| 1 | Chevron | 3 | |||
| 2 | Hewlett-Packard | 11 | |||
| 3 | McKesson | 15 | |||
| 4 | Wells Fargo | 23 | |||
| 5 | Apple | 35 | |||
| 6 | Intel | 56 | |||
| 7 | Safeway | 60 | |||
| 8 | Cisco | 62 | |||
| 9 | Walt Disney | 65 | |||
| 10 | Northrop Grumman | 72 | |||
| 11 | Ingram Micro | 75 | |||
| 12 | 92 | ||||
| 13 | Oracle | 96 | |||
| 14 | DirecTV | 110 | |||
| 15 | Occidental Petroleum | 129 | |||
| 16 | Amgen | 163 | |||
| 17 | Gap | 167 | |||
| 18 | PG&E | 177 | |||
| 19 | Health Net | 179 | |||
| 20 | Edison International | 198 | |||
| 21 | Qualcomm | 222 | |||
| 22 | Jacobs Engineering | 250 | |||
| 23 | Western Digital | 251 | |||
| 24 | Applied Materials | 259 | |||
| 25 | URS | 267 | |||
| 26 | eBay | 269 | |||
| 27 | Sempra Energy | 274 | |||
| 28 | Synnex | 281 | |||
| 29 | Visa | 297 | |||
| 30 | Gilead Sciences | 299 | |||
| Further information: List of California companies Source: Fortune[14] | |||||
California's location along the Pacific coast and its rapidly growing population initially led to the constructions of major seaports at San Francisco in the San Francisco Bay area and inland ports at Sacramento, etc. The first paddle steamer, the SS California, arrived in the port of San Francisco on February 29, 1849, with over 400 passengers trying to get to the gold rush territory. She left New York City October 6, 1848, before the gold discoveries were verified and the gold rush truly stated. Shipment of passengers and freight to Sacramento was accomplished by off-loading the cargoes and passengers onto paddle steamers for transit up the Sacramento River to Sacramento, Stockton, etc. As the population spread out and grew ports were established up and down the California coast with other major ports in Long Beach, Los Angeles and San Diego. The largest U.S. Naval base on the west coast is now in San Diego. (See: Maritime history of California for more information). The state's shipping industry evolved to handle cargoes to and from California to Europe and the eastern United States and help support the growing international trade with South America, Asia and Oceania. During World War II, numerous military bases and various wartime industries were quickly established in the state to support the Pacific Ocean and Atlantic ocean fleets—ships could use the Panama Canal to get from ocean to ocean. California led in the number of merchant ships built at the Kaiser shipyards in Richmond and the Los Angeles areas. Mare Island Naval Shipyard (now closed) in the San Francisco Bay built submarines as well as repaired many of the ships used by the U.S. Navy Pacific Fleet in World War II. The rapidly growing California aircraft industries was greatly expanded. Since then these defense connected industries have largely closed down or moved to cheaper areas in the U.S.
With Thomas Edison's invention of the Kinetoscope (early movie camera) in 1894, California would become a leader when "talkies" were introduced in the sound film movie industry. The idea of combining motion pictures with recorded sound is nearly as old as film itself, but because of the technical challenges involved, synchronized dialogue was only made practical in the late 1920s with the perfection of the Audion amplifier tube and the introduction of the Vitaphone system. After the release of The Jazz Singer in 1927, "talkies" became more and more commonplace. Within a decade, popular widespread production of silent films had ceased. Cheap land, good year-round climate and large natural spaces prompted the growing film industry to begin migrating to Southern California in the early part of the 20th century. The film patent wars of the early 20th century actually led to the spread of film companies across the U.S. Many worked with equipment for which they did not own the patent rights, and thus filming in New York was "dangerous"; it was too close to Edison's company headquarters, and to his agents which the company sent out to seize "illegal" cameras. By 1912, most major film companies had set up movie production facilities in Southern California near or in Los Angeles because of the region's favorable year-round weather and the rapidly growing supply of "talent" both before and behind the cameras.[15] Since the 1920s California continues to be a major U.S. center for motion-picture shows, television shows, cartoons, and related entertainment industries, especially in Hollywood and Burbank areas.
Since 1945, manufacturing of electronic equipment, computers, machinery, transportation equipment, and metal products, has increased rapidly while aircraft and naval construction has largely ceased. Stanford University, its affiliates, and graduates played a major role in the development of California's electronics and high-tech industry.[16] From the 1890s, Stanford University's leaders saw its mission as leading the development of the West and shaped the school accordingly. Regionalism helped align Stanford's interests with those of the Stanford area's high-tech firms for the first fifty years of Silicon Valley's development.[17] During the 1940s and 1950s, Frederick Terman, as Stanford's dean of engineering and provost, encouraged faculty and graduates to start their own companies. He is credited with nurturing Hewlett-Packard, Varian Associates, and other high-tech firms such as Apple Inc., Google, etc. in what would become Silicon Valley that grew up around the Stanford campus. Despite the development of other high-tech economic centers throughout the United States and the world, Silicon Valley continues to be a leading hub for high-tech innovation and development, accounting for one-third (1/3) of all of the venture capital investment in the United States.[18] Geographically, Silicon Valley encompasses all of the Santa Clara Valley, the southern Peninsula, and the southern East Bay. A number of high-tech companies and small low-tech, often low-wage, companies are also located in Southern California.
Tourism is also an important part of California's economy. Yosemite National Park was established in 1890, followed by nine other national parks and seashores,[19] as well as various other protected areas across California. Disneyland, established in 1955, and other theme parks draw millions of visitors each year.
California also pioneered numerous innovations in retailing during the mid-20th century, particularly fast food restaurants and credit cards. Nationwide fast food chains A&W Restaurants (1919), McDonald's (1940), Taco Bell (1961), and Panda Express (1983) were all founded in California. Visa Inc. (originally BankAmericard) was born from a 1958 experiment by Bank of America in Fresno, while MasterCard (originally Master Charge) was formed as the Interbank Card Association in 1966 by a group of California banks to compete against BankAmericard.
California has a large productive economy. If it was ranked as a country it would rank at $1,800 billion GDP (2013) at about the same size as Canada. (See: Comparison between U.S. states and countries by GDP (nominal)).
Sectors
In 2002, the U.S government began to use the North American Industry Classification System (NAICS) system of classifying economic activities, to better reflect today's economy.[20]
Government is California's largest industry, like most states, with about 2.5 million employees. The second largest industry, according to the Census, is Healthcare and Social Assistance.[21]
International trade and tourism
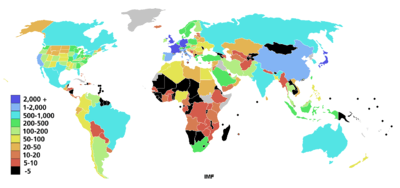
California has historically derived significant revenue from international trade and tourism. However, the state's share of America's merchandise export trade has been steadily shrinking since 2000, from 15.4% to 11.1% in 2008.[22] The exports of goods made in California totaled $134 billion in 2007. $48 billion of that total was computers and electronics, followed by transportation, non-electrical machinery, agriculture, and chemicals. California trade and exports translate into high-paying jobs for over one million Californians. According to the US Bureau of Economic Analysis (BEA), in 2005, foreign-controlled companies employed 542,600 California workers, the most of any state. Major sources of foreign investment in California in 2005 were Japan, the United Kingdom, Switzerland, France, and Germany. Foreign investment in California was responsible for 4.6 percent of the state's total private-industry employment in 2009.[23] Total direct travel spending in California reached $96.7 billion in 2008, a 0.8% increase over the preceding year.[24] Los Angeles County receives the most tourism in the state.[24]
.svg.png)
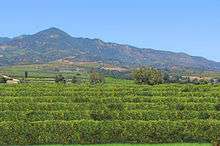
Agriculture
Agriculture (including fruit, vegetables, dairy, and wine production) is a major California industry, but at 2% of GSP it makes a minor contribution to the state's overall economy. Airborne exports of perishable fruits and vegetables amounted to approximately $579 million in 2007.[26] By way of comparison, California exported more agricultural products by air that year than 23 other states did by all modes of transport.[26]
According to the California Department of Food and Agriculture, "California agriculture is a $42.6 billion dollar industry that generates at least $100 billion in related economic activity."[27] The state’s agricultural sales first exceeded $30 billion in 2004,[28] making it more than twice the size of any other state's agriculture industry.
California is the leading dairy state.[29] Milk is California's number one farm commodity.[28] Exports of almonds continued to be the top commodity from California, with a value of $2.83 billion in foreign sales. Dairy and dairy products ranked second to almonds with a California total export value of $1.42 billion, a 24 percent increase over 2010.[30] California's dairy industry generated $47 billion "in economic activity" in 2004 and employed over 400,000 people."[29]
Energy
Oil drilling has played a significant role in the development of the state. There have been major strikes in the Bakersfield, Long Beach, Los Angeles areas and off the California coast.
Solar power in California is also a large employer in the state. There are over 43,000[31] Californians working in the solar industry, primarily around the San Francisco Bay Area, Los Angeles, San Diego, and the Central Valley
Personal income
.svg.png)
Per capita income was $38,956 as of 2006, ranking 11th in the nation, but varies widely by geographic region and profession.[32] Some coastal cities include some of the wealthiest per-capita areas in the U.S., notably La Jolla in San Diego, Beverly Hills in Los Angeles County, Newport Beach in Orange County, and Santa Barbara in Southern California, San Francisco, Silicon Valley and Marin County. The most expensive and largest housing markets in the U.S. are in the state of California, so there are a number of communities where average housing prices hover between US$1–2 million. Generally, the Central Valley in northern California is the least expensive area, as is the Inland Empire in Southern California, though prices in these regions are still much more expensive than most other areas of the country, to the point that there are also communities in these areas where housing prices average around the $1 million mark. The agricultural central counties have some of the highest poverty rates in the state. The high-technology sectors in Northern California, specifically Silicon Valley, in Santa Clara and San Mateo counties, are currently emerging from the economic downturn caused by the dot-com bust, which caused the loss of over 250,000 jobs in Northern California alone. As of spring 2005, data from UCLA Anderson indicates that economic growth has resumed in California, although still slightly below the national annualized forecast of 3.9%.[33]
California
| California state and local tax revenue 2011 (in thousands)[34] | ||||
|---|---|---|---|---|
| Revenue type | State and local revenue | State revenue | Local revenue | |
| General revenue from own sources | 268,224,2941 | 142,927,463 | 125,296,8312 | |
| Various taxes | 185,218,208 | 116,695,284 | 68,522,924 | |
| Property taxes | 53,506,490 | 3,207,301 | 50,299,189 | |
| Sales and gross receipts tax | 59,179,135 | 45,147,657 | 14,031,478 | |
| General sales tax | 40,101,659 | 30,996,372 | 9,105,287 | |
| Selective sales tax | 19,077,476 | 14,151,285 | 4,926,191 | |
| Motor fuel tax | 5,705,527 | 5,705,527 | (X) | |
| Alcoholic beverage tax | 334,178 | 334,178 | (X) | |
| Tobacco products tax | 905,245 | 905,245 | (X) | |
| Public utilities | 3,974,053 | 790,501 | 3,183,552 | |
| Other selective sales tax | 8,158,473 | 6,415,834 | 1,742,639 | |
| Individual income tax | 50,508,441 | 50,508,441 | (X) | |
| Corporate income tax | 9,613,594 | 9,613,594 | (X) | |
| Vehicle license tax | 3,131,975 | 3,090,610 | 41,365 | |
| Other taxes | 9,278,573 | 5,127,681 | 4,150,892 | |
| Charges and misc. general revenue | 83,006,086 | 26,232,179 | 56,773,907 | |
| Current charges | 60,339,164 | 16,701,739 | 43,637,425 | |
| Education K-14 | 10,168,290 | 7,258,220 | 2,910,070 | |
| Institutions of higher education | 9,104,750 | 7,252,680 | 1,852,070 | |
| School lunch sales (gross) | 426,647 | (X) | 426,647 | |
| Hospital fees | 17,007,989 | 6,542,258 | 10,465,731 | |
| Highway fees | 651,115 | 38,490 | 612,625 | |
| Airport fees | 2,498,811 | (X) | 2,498,811 | |
| Parking facilities | 435,455 | 12,261 | 423,194 | |
| Sea and inland port facilities | 1,334,929 | (X) | 1,334,929 | |
| Natural resources | 2,137,297 | 1,297,670 | 839,627 | |
| Parks and recreation | 1,416,246 | 96,167 | 1,320,079 | |
| Housing and community development | 951,021 | 487 | 950,534 | |
| Sewerage | 6,485,827 | (X) | 6,485,827 | |
| Solid waste management | 2,469,196 | (X) | 2,469,196 | |
| Other charges & fees | 14,782,988 | 1,456,186 | 13,326,802 | |
| Miscellaneous general revenue | 22,666,922 | 9,530,440 | 13,136,482 | |
| Interest earnings | 6,253,309 | 2,374,030 | 3,879,279 | |
| Special assessments | 1,466,292 | (X) | 1,466,292 | |
| Sale of property | 333,326 | 14,168 | 319,158 | |
| Other general revenue | 14,613,995 | 7,142,242 | 7,471,753 | |
| Utility revenue | 25,316,003 | 2,496,154 | 22,819,849 | |
| Water supply | 10,334,952 | (X) | 10,334,952 | |
| Electric power | 12,795,350 | 2,496,154 | 10,299,196 | |
| Gas supply | 242,213 | (X) | 242,213 | |
| Transit | 1,943,488 | (X) | 1,943,488 | |
| Insurance trust revenue3 | 149,964,876 | 120,379,020 | 29,585,856 | |
| Unemployment compensation | 17,009,070 | 17,009,070 | (X) | |
| Employee retirement | 124,640,863 | 95,055,007 | 29,585,856 | |
| Workers' compensation | 2,077,574 | 2,077,574 | (X) | |
| Other insurance trust revenue | 6,237,369 | 6,237,369 | (X) | |
| Notes: 1. Federal Transfers add $75.876 billion to state and local funds.
| ||||
California is divided into counties which are legal subdivisions of the state.[35] There are 58 California counties,[36] 480 California cities,[37] and about 3,400 special districts and school districts.[38] Special districts deliver specific public programs and public facilities to constituents, and are defined as "any agency of the state for the local performance of governmental or proprietary functions within limited boundaries."[39] Much of the government of California is in practice the responsibility of city, county and school governments. All these different governments have their own sources of tax revenue and fees; making a complicated mix of taxes, fees, transfers and responsibilities. Most taxes are collected by the state and then redistributed to the different government branches. Many fees are collected at the city and county level.
According to the U.S. Census the federal Internal Revenue Service collected in California in 2012 $292.563 billion. This included federal income & payroll ($193.489 bn), excise ($3.227 bn), corporate income ($37.181 bn), gift $0.288 bn), estate ($2.590 bn), unemployment ($0.838 bn), and trust ($1.091 bn) taxes.[40]
State and local tax and fee collections in California (2011) were $268.224 billion plus another $75.875 billion in federal transfers were spent by state and local government agencies.[41]
California in 2010, when measured as a percentage of GDP, had the 4th highest tax burden of all the fifty states at 13.4% of the state GDP.[42]
The maximum 13.3% state personal income tax rate is the highest in the nation, but only applies to incomes over $1 million.[42] For a married couple the first $15,164 has an income tax rate of 1.0% on taxable income (all income minus allowable deductions). The rate on taxable income between $15,164 and $35,952 is 2.0%; from $35,952 to $56,742 it is 4.0%; from $56,742 to $78,768 it is 6.0%; from $78,768 to $99,548 income has an 8.0% rate. On taxable income from $99,548 to $508,500 the rate is 9.3%. Taxable income from $508,500 to $610,200 the tax is 10.30% (of all income over $508,500). Taxable income from $610,200 to $1,017,000 the tax is 11.30% of all income over $610,200. All income over $1,017,000 has a tax of 13.3%. The standard deduction for a married couple is now $212.00. This means a married couple earning less than $18,182.00 pays no income tax. Rates for single persons are the same but the bracket amounts are halved.[43]
The 8.4 percent "average" sales tax assessed by the state and local governments of California is one of the highest in the nation and varies by city and county from a low of 7.5% to 10.0%. Food, prescription drugs and services are exempt from sales tax—about 1/3 of all purchases have sales tax applied to them. Sales taxes are collected by the state who re-allocates them to the various counties, cities, districts etc.. The basic statewide sales and use tax rate is 7.50% and is divided as follows: 6.50% State, 0.75% plus a 0.25% local transportation fund to city or county of place of sale (distributed quarterly). All taxes above 7.5% are so called "District Taxes" which are imposed locally, after an area wide vote, under the Transactions and Use Tax Law. Local, voter approved, sales tax rate increases have resulted in higher sales tax rates in various California locations. Sales taxes imposed for general governmental purposes are subject to simple majority approval. Sales taxes imposed for specific purposes like transportation are subject to two-thirds voter approval.[44]
Used cars have a 7.5% to 10.0% sales tax applied to the used car purchase price. This sales tax is applied to all new and used car, planes, boats, etc. purchased even if they are purchased out of state. In addition to having a clear title, a passed smog and emission inspection on the vehicle plus proof of insurance are needed before a car can be registered. New residents to California are required to register their vehicle(s) within 20 days of establishing residency. A department of motor vehicle (DMV) employee will perform a physical inspection of the vehicle and verify the vehicle identification number (VIN) number before you receive a California registration certificate, license plates and correct yearly registration stickers for your vehicle. State and local government vehicles are exempt from paying fees and are issued "exempt" license plates.
California vehicle license fees are 0.65% of depreciated vehicle's value. These fees are applied annually. Licenses are renewed in the month the vehicle was originally registered and have a yearly sticker applied to them after paying the registration fee to show fee payment.
The 8.84% state corporate income flat tax rate is the highest in the west and one of the highest in the nation. Banks and financials have a 10.84% flat tax applied to their profits. S corporation rate is 1.5% while S corporation bank and financial rate is 3.5%.[45]
California property tax rates are ranked 17th highest in the nation[46] having been capped by the Proposition 13 overwhelmingly passed in 1978. Property taxes in California amounted to over $54.0 billion (2011) and are one of the largest taxes in California of which about $12.0 billion of the $54.0 billion collected was for voter approved "extras".[47] The property tax, despite being used primarily to finance local governments, has a significant effect on the state budget. The state's convoluted education finance system attempts to "equalize" school district property tax revenue for K–14 districts by using the states general funds collected mostly from income and sales taxes. The state has changed the laws regarding property tax allocation many times to attempt to limit its extensive education costs.
Property in California, when sold, is assessed at 100% of full cash value. Under Proposition 13, the maximum amount of tax on real estate in California is limited to 1.0% plus local voter approved surcharges for "extras". Revenue from these "extra" taxes are used primarily to repay general obligation bonds issued for local infrastructure projects such as school district surcharges for rehabilitation of school facilities or building new buildings. These extras may also include: water districts, sidewalk maintenance, flood control, street lighting, etc.. The state also has statewide property taxes collected and used by the state on privately owned railroad cars and timber. The statewide average property tax is about 1.26% of assessed value but can range from about 1.03% to nearly 2.0% in some cities and counties. Proposition 13 limits property tax assessment increases to 2.0% of previously assessed value or the inflation rate over the previous year, whichever is lower. Because property prices have increased in California faster than 2.0%, on average, older properties are taxed at lower "effective" rates then newly sold properties. This feature was part in the Proposition 13 language to encourage people to stay put in their residences longer—they do. Property taxes were allocated as follows: counties 17%, cities 10%, schools (school districts and community colleges) 54%, and special districts 19%. In 2013 the state legislature abolished special districts. Intangible personal property, personal effects, business inventory property held for resale are exempt from property taxes. A principal residence qualifies for a $7,000 homestead reduction in the taxable value of their property. Property owned by governments, non-profit hospitals, religious institutions, and charitable organizations—are exempt from the 1.0% property tax rate.
In California gasoline is taxed at $0.719/gallon and diesel at $0.749/gallon—these are the highest gas and diesel taxes in the nation. The state legislature switched its gas taxation system in 2010 so it could re-appropriate some of the gas and diesel tax money from road maintenance to other areas of the state budget which was in deficit.[48] Since they re-purposed much of the state and federal fuel taxes there are now complaints that there is not enough money in the transportation funds to do all the required highway upgrades and maintenance.
Cigarette excise taxes in California are $0.87/pack. The federal excise tax on cigarettes is an additional $1.01 making the total excise taxes on a package of cigarettes $1.88/pack. Because excise taxes are "hidden" (not listed separately) the price of the cigarettes plus the excise tax have a 7.5% to 10.0% sales tax added to the purchase price—a tax on a tax.
California alcoholic beverage taxes varies by beverage, from 20¢ per gallon of wine or beer to $6.60 per gallon of spirits (over 100 proof).
The unemployment insurance rate, paid by the employer, is experienced based and averages about 1.0%-6.0% of the first $7,000 of worker's income—employers with high turnovers pay more. The federal unemployment insurance rate (now) is 6.2% of the first $7,000 of worker's income. The Great Recession resulted in a high unemployment rate, causing California to borrow about $10 billion from the federal government.
The Employment Training Tax (ETT) rate for 2014 is 0.1 percent on the first $7,000 per employee per calendar year.
The State Disability Insurance (SDI) withholding rate for 2014 is 1.0 percent up to a salary limit of $101,636 income—maximum disability tax for each employee is $1,016.36.[49]
Housing
The international boom in housing prices has been most pronounced in California, with the median property price in the state rising to about the half-million dollar mark in April 2005. Orange County, Ventura County and the San Francisco Bay Area have the highest median prices, each approaching $650,000.[50] The least expensive region is the Central Valley, with a median price of $290,000.[50]
Various real estate markets in California experienced sharp increases in value in the early 2000s, followed by declines in 2007 and 2008, as a housing bubble burst.
However, beginning in 2007 with the credit crunch in the banking system, thousands of homes have been foreclosed statewide, thereby leading to plummeting home prices. As of 2014 California was found to be the most expensive state in which to lease a home.[51]
See also
- California locations by per capita income
- California unemployment statistics
- 2008–10 California budget crisis
- Comparison between U.S. states and countries by GDP (PPP)
- Comparison between U.S. states and countries by GDP (nominal)
- List of country subdivisions by GDP over USD 100 billions
- List of US state economies
References
- ↑ "STATE PERSONAL INCOME 2013" (PDF). Bureau of Economic Analysis, U.S. Department of Labor. March 25, 2014. Retrieved June 11, 2014.
- ↑ http://www.ppic.org/main/publication_show.asp?i=261
- ↑ http://www.businessinsider.com/new-census-data-on-poverty-rates-yields-some-pretty-shocking-results-2012-11
- ↑ http://research.stlouisfed.org/fred2/data/CALFN.txt
- ↑ "Current Unemployment Rates for States and Historical Highs/Lows". bls.gov. Bureau of Labor Statistics.
- ↑ State and local taxes in California are 11.2% of state GDP as determined by the Tax Fiundation. Trying to unscramble the state & local taxes and tax transfers between the state, local and school districts is difficult; but the Tax foundation has been doing it for over 20 years. accessed 16 Dec 2013
- ↑ "Widespread But Slower Growth in 2013" (PDF). Bureau of Economic Analysis, U.S. Department of Labor. June 11, 2014. Retrieved June 11, 2014.
- ↑ U.S. 1850 California Census counts 92,597 residents but omits the residents of San Francisco (estimated at about 21,000) whose census records were destroyed by fire. Contra Costa County (estimated at about 2,000 residents) and Santa Clara County (estimated at about 4,000 residents) 1850 records were "lost" and also not included. The total non-Indian (Indians were not counted) population was over 120,000. See: "Historical Statistical Abstracts - U.S. Census Bureau"; [www.census.gov/prod/www/abs/statab.html]
- ↑ "CSU Facts 2013" (PDF). The California State University.
- ↑ "The California State University homepage". The California State University. Retrieved 2012-10-23.
- ↑ "About the University of California".
- ↑ "Marijuana Production in the United States (2006)".
- ↑ California Irrigation accessed 15 Dec 2013
- ↑ Fortune 500 companies - California.CNN Money. Retrieved on February 26, 2012.
- ↑ Jacobs, Lewis; Rise of the American film, The; Harcourt Brace, New York, 1930; p. 85
- ↑ Markoff, John (2009-04-17). "Searching for Silicon Valley". New York Times. The New York Times Company. Retrieved 2009-04-17.
- ↑ Stephen B. Adams, "Regionalism in Stanford's Contribution to the Rise of Silicon Valley," Enterprise & Society 2003 4(3): 521-543
- ↑ from PriceWaterhouseCoopers.com
- ↑ accessed 15 Dec 2013
- ↑ "NAICS - North American Industry Classification System Main Page". US Census Bureau. January 14, 2010. Retrieved January 29, 2010.
- ↑ http://www.theatlantic.com/magazine/archive/1995/11/in-the-strawberry-fields/5754/?single_page=true
- ↑ "Origin of Movement of U S Exports of Goods by State by NAICS-Based Product" (PDF). US Census Bureau. February 9, 2009. Retrieved January 29, 2010.
- ↑ "California: Exports, Jobs, and Foreign Investment" (PDF). International Trade Administration. Retrieved May 2012. Check date values in:
|access-date=(help) - 1 2 "California Statistics & Trends: Economic Impact of Travel in California". California Travel Impacts by County, 1992-2007. California Travel & Tourism Commission. April 2009. p. 3. Retrieved January 29, 2010.
- ↑ "Regional Economic Accounts (interactive tables)". Bureau of Economic Analysis. Retrieved January 31, 2010.
- 1 2 O'Connell, Jack. "The Role of Air Cargo in California's Agricultural Export Trade: A 2007 Update" (PDF). Center for Agricultural Business, California State University Fresno. Retrieved May 2012. Check date values in:
|access-date=(help) - ↑ "CDFA History". California Department of Food and Agriculture. Retrieved April 2, 2015.
- 1 2 "Agricultural Statistical Review, 2006 Overview" (PDF). California Department of Food and Agriculture. p. 17. Retrieved January 30, 2010.
- 1 2 "Real California Milk Facts". California Milk Advisory Board. June 2009. Retrieved January 30, 2010.
- ↑ "California Agricultural Export Values, 2002-2012" (PDF). California Department of Food and Agriculture. Retrieved November 20, 2015.
- ↑ http://www.greentechmedia.com/articles/read/California-Has-More-Solar-Jobs-Than-Movie-Actors
- ↑ "State Personal Income 2006". Bureau of Economic Analysis, U.S. Department of Commerce.
- ↑ "The UCLA Anderson Forecast". UCLA Anderson Forecast.
- ↑ Gross Collections Federal taxes by tax and state. US Census Summary Alabama- Mississippi (Excel spreadsheet) accessed 23 Dec 2013
- ↑ Constitution of California, article 11, section 1
- ↑ State of California, Counties Archived May 27, 2010, at the Wayback Machine.
- ↑ State of California, Cities Archived April 28, 2012, at the Wayback Machine.
- ↑ A Citizen's Guide to Special Districts in California
- ↑ (Government Code §16271 [d])
- ↑ Gross Collections Federal taxes by tax and state, Table 5 accessed 23 Dec 2013
- ↑ Gross Collections Federal taxes by tax and state. US Summary Alabama- Mississippi (Excel spreadsheet) accessed 23 Dec 2013
- 1 2 http://blogs.sacbee.com/capitolalertlatest/2012/12/high-income-californians-may-pay-nations-highest-tax-rate.html
- ↑ California tax rates accessed 23 Dec 2013
- ↑ California Sales tax allocations accessed 26 Dec 2013
- ↑ California business tax rates accessed 23 Dec 2013
- ↑ Property tax rank accessed 23 Dec 2013
- ↑ California Property taxes accessed 29 Dec 2013
- ↑ State gas and diesel taxes accessed 23 Dec 2013
- ↑ California withholding schedules accessed 29 Dec 2013
- 1 2 "Cal Facts 2004 State Economy". Legislative Analyst's Office of California. December 3, 2004. Retrieved January 31, 2010.
- ↑ EZ Landlord Forms. "Cost To Rent A Home". ezlandlordforms.com. Retrieved 2014-08-21.
External links
| Wikimedia Commons has media related to Economy of California. |
- California's homepage
- California Department of Finance
- California Legislative Analyst's Office — California's Nonpartisan Fiscal and Policy Advisor
- Bureau of Economic Analysis — an agency of the U.S. Department of Commerce
- California's Commerce & Economic Development Program
- Analyses of California's International Trade
- California Tourism
- California Commission for Jobs and Economic Growth
- Rancho de Los Arcos — about agriculture & economy
- California state budget