Shasta County, California
| Shasta County, California | |||||
|---|---|---|---|---|---|
| County | |||||
| County of Shasta | |||||
| |||||
| |||||
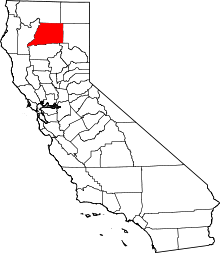 Location in the state of California | |||||
 California's location in the United States | |||||
| Country |
| ||||
| State |
| ||||
| Region | Sacramento Valley/Cascade Range | ||||
| Incorporated | 1850 | ||||
| Named for | Mount Shasta[1] | ||||
| County seat | Redding | ||||
| Area | |||||
| • Total | 9,960 km2 (3,847 sq mi) | ||||
| • Land | 9,780 km2 (3,775 sq mi) | ||||
| • Water | 190 km2 (72 sq mi) | ||||
| Population (April 1, 2010)[2] | |||||
| • Total | 177,223 | ||||
| • Estimate (2015)[2] | 179,533 | ||||
| • Density | 18/km2 (46/sq mi) | ||||
| Time zone | Pacific Standard Time (UTC-8) | ||||
| • Summer (DST) | Pacific Daylight Time (UTC-7) | ||||
| Website | www.co.shasta.ca.us | ||||
Shasta County, officially the County of Shasta, is a county located in the northern portion of the U.S. state of California. As of the 2010 census, the population was 177,223.[2] The county seat is Redding.[3]
Shasta County comprises the Redding, California Metropolitan Statistical Area. The county occupies the northern reaches of the Sacramento Valley, with portions extending into the southern reaches of the Cascade Range.
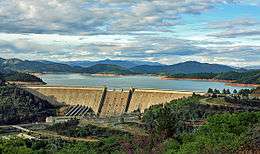
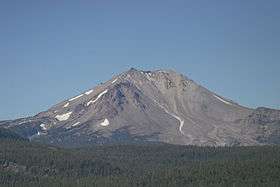
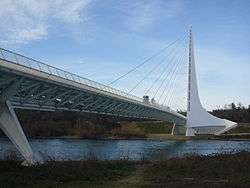
Points of interest in Shasta County include Shasta Lake, Lassen Peak, and the Sundial Bridge.
History
Shasta County was one of the original counties of California, created in 1850 at the time of statehood. Parts of the county's territory were given to Siskiyou County in 1852, and to Tehama County in 1856.
The county was named after Mount Shasta; the name "Shasta" is derived from the English equivalent for the name of an Indian tribe that once lived in the area. The name of the tribe was spelled in various ways until the present version was used when the county was established. Originally Mt. Shasta was within the county, but it is now part of Siskiyou County, to the north. Its 14,179-foot (4,322 m) peak is visible throughout most of Shasta County.
Geography
According to the U.S. Census Bureau, the county has a total area of 3,847 square miles (9,960 km2), of which 3,775 square miles (9,780 km2) is land and 72 square miles (190 km2) (1.9%) is water.[4] Mountains line the county on the east, north and west. The Sacramento River flows out of the mountains to the north, through the center of the county, and toward the Sacramento Valley to the south.
Flora and fauna
According to Willis Linn Jepson the biota of Shasta County were not explored in a scientific manner until just before the year 1900. Up until the 1920s the Southern Pacific Railroad Company owned vast tracts of natural grasslands; however, during the 1920s the railroad sold off much of its grassland holdings, leading to the rapid clearing of brush and large scale conversion from habitat to agricultural uses.[5] Shasta County has extensive forests, which cover over one half the land area with commercially productive forest systems.[6] Common forest alliances include mixed oak woodland and mixed conifer-oak woodland as well as douglas fir forest. Common trees found include White-bark pine,[7] California Black Oak and California Buckeye.[8]
National protected areas
Politics
Voter registration statistics
| Population and registered voters | ||
|---|---|---|
| Total population[9] | 177,231 | |
| Registered voters[10][note 1] | 98,013 | 55.3% |
| Democratic[10] | 25,957 | 26.5% |
| Republican[10] | 45,815 | 46.7% |
| Democratic–Republican spread[10] | -19,858 | -20.2% |
| Independent[10] | 3,620 | 3.7% |
| Green[10] | 453 | 0.5% |
| Libertarian[10] | 786 | 0.8% |
| Peace and Freedom[10] | 268 | 0.3% |
| Americans Elect[10] | 2 | 0.0% |
| Other[10] | 344 | 0.4% |
| No party preference[10] | 20,768 | 21.2% |
Cities by population and voter registration
| Cities by population and voter registration | |||||||
|---|---|---|---|---|---|---|---|
| City | Population[9] | Registered voters[10] [note 1] |
Democratic[10] | Republican[10] | D–R spread[10] | Other[10] | No party preference[10] |
| Anderson | 9,927 | 45.1% | 30.7% | 38.8% | -8.1% | 11.4% | 24.0% |
| Redding | 89,674 | 53.4% | 26.5% | 46.7% | -20.2% | 8.6% | 21.5% |
| Shasta Lake | 10,121 | 51.0% | 29.5% | 39.1% | -9.6% | 10.9% | 24.7% |
Overview
| Year | GOP | DEM | Others |
|---|---|---|---|
| 2016 | 64.0% 51,778 | 27.5% 22,301 | 8.5% 6,879 |
| 2012 | 62.8% 48,067 | 33.8% 25,819 | 3.4% 2,615 |
| 2008 | 61.7% 49,588 | 35.9% 28,867 | 2.4% 1,935 |
| 2004 | 67.2% 52,249 | 31.3% 24,339 | 1.5% 1,143 |
| 2000 | 65.0% 43,278 | 30.3% 20,127 | 4.7% 3,139 |
| 1996 | 55.2% 34,736 | 33.1% 20,848 | 11.7% 7,377 |
| 1992 | 41.2% 28,190 | 31.6% 21,605 | 27.2% 18,564 |
| 1988 | 59.4% 32,402 | 38.8% 21,171 | 1.9% 1,012 |
| 1984 | 62.2% 33,041 | 36.3% 19,298 | 1.5% 788 |
| 1980 | 58.1% 27,547 | 32.4% 15,364 | 9.5% 4,507 |
| 1976 | 45.6% 17,273 | 50.7% 19,200 | 3.7% 1,381 |
| 1972 | 46.7% 16,618 | 48.4% 17,214 | 5.0% 1,771 |
| 1968 | 40.4% 11,821 | 49.6% 14,510 | 9.9% 2,899 |
| 1964 | 32.4% 9,178 | 67.5% 19,142 | 0.1% 30 |
| 1960 | 38.9% 9,462 | 60.5% 14,691 | 0.6% 148 |
| 1956 | 43.8% 8,833 | 55.8% 11,239 | 0.4% 77 |
| 1952 | 56.4% 10,073 | 42.9% 7,656 | 0.7% 122 |
| 1948 | 39.7% 5,010 | 56.9% 7,177 | 3.5% 436 |
| 1944 | 40.9% 4,023 | 58.9% 5,798 | 0.2% 22 |
| 1940 | 30.7% 3,909 | 68.0% 8,662 | 1.3% 162 |
| 1936 | 28.8% 2,159 | 69.7% 5,236 | 1.5% 115 |
| 1932 | 23.9% 1,382 | 72.1% 4,170 | 4.0% 230 |
| 1928 | 52.2% 2,301 | 45.9% 2,025 | 1.9% 82 |
| 1924 | 42.0% 1,951 | 12.9% 598 | 45.2% 2,102 |
| 1920 | 62.1% 2,108 | 30.3% 1,028 | 7.7% 260 |
Shasta at one time favored the Democratic party in Presidential elections and was one of the few counties in the state to be won by George McGovern. In more recent times it is a strongly Republican county in Presidential and congressional elections. The last Democrat to win a majority in the county was Jimmy Carter in 1976.
In the United States House of Representatives, Shasta County is in California's 1st congressional district, represented by Republican Doug LaMalfa.[12]
In the California State Legislature, Shasta County is in the 1st Senate District, represented by Republican Ted Gaines,[13] and the 1st Assembly District, represented by Republican Brian Dahle.[14]
Transportation
Major highways
.svg.png) Interstate 5
Interstate 5 State Route 36
 State Route 44
 State Route 89
 State Route 151
 State Route 273
 State Route 299
Public transportation
Redding Area Bus Authority (RABA) provides service in and around Redding. One route operates to Burney via State Route 299.
Greyhound buses and Amtrak trains both serve Redding.
Airports
Redding Municipal Airport has scheduled passenger flights. Other (general aviation) airports within the county include Benton Field (near Redding), Fall River Mills Airport, and Shingletown Airport.
Crime
The following table includes the number of incidents reported and the rate per 1,000 persons for each type of offense.
| Population and crime rates | ||
|---|---|---|
| Population[9] | 177,231 | |
| Violent crime[15] | 1,280 | 7.22 |
| Homicide[15] | 3 | 0.02 |
| Forcible rape[15] | 111 | 0.63 |
| Robbery[15] | 130 | 0.73 |
| Aggravated assault[15] | 1,036 | 5.85 |
| Property crime[15] | 2,722 | 15.36 |
| Burglary[15] | 1,462 | 8.25 |
| Larceny-theft[15][note 2] | 2,839 | 16.02 |
| Motor vehicle theft[15] | 339 | 1.91 |
| Arson[15] | 27 | 0.15 |
Cities by population and crime rates
| Cities by population and crime rates | ||||||||
|---|---|---|---|---|---|---|---|---|
| City | Population[16] | Violent crimes[16] | Violent crime rate per 1,000 persons |
Property crimes[16] | Property crime rate per 1,000 persons | |||
| Anderson | 10,056 | 87 | 8.65 | 606 | 60.26 | |||
| Redding | 90,974 | 705 | 7.75 | 4,380 | 48.15 | |||
Demographics
2011
| Population, race, and income | |||||
|---|---|---|---|---|---|
| Total population[9] | 177,231 | ||||
| White[9] | 155,791 | 87.9% | |||
| Black or African American[9] | 1,650 | 0.9% | |||
| American Indian or Alaska Native[9] | 3,855 | 2.2% | |||
| Asian[9] | 4,609 | 2.6% | |||
| Native Hawaiian or other Pacific Islander[9] | 286 | 0.2% | |||
| Some other race[9] | 3,350 | 1.9% | |||
| Two or more races[9] | 7,690 | 4.3% | |||
| Hispanic or Latino (of any race)[17] | 14,622 | 8.3% | |||
| Per capita income[18] | $23,691 | ||||
| Median household income[19] | $44,058 | ||||
| Median family income[20] | $55,250 | ||||
Places by population, race, and income
| Places by population and race | ||||||||
|---|---|---|---|---|---|---|---|---|
| Place | Type[21] | Population[9] | White[9] | Other[9] [note 3] |
Asian[9] | Black or African American[9] |
Native American[9] [note 4] |
Hispanic or Latino (of any race)[17] |
| Anderson | City | 9,927 | 86.4% | 6.5% | 3.1% | 1.4% | 2.6% | 10.4% |
| Bella Vista | CDP | 2,344 | 97.1% | 0.4% | 0.8% | 0.0% | 1.7% | 6.0% |
| Big Bend | CDP | 95 | 89.5% | 0.0% | 5.3% | 5.3% | 0.0% | 11.6% |
| Burney | CDP | 2,824 | 91.5% | 3.0% | 0.2% | 0.0% | 5.2% | 3.5% |
| Cassel | CDP | 473 | 100.0% | 0.0% | 0.0% | 0.0% | 0.0% | 4.7% |
| Cottonwood | CDP | 3,426 | 81.8% | 14.7% | 0.0% | 0.4% | 3.1% | 18.9% |
| Fall River Mills | CDP | 572 | 76.9% | 21.2% | 1.9% | 0.0% | 0.0% | 35.1% |
| French Gulch | CDP | 222 | 85.6% | 10.4% | 3.2% | 0.0% | 0.9% | 0.0% |
| Hat Creek | CDP | 183 | 100.0% | 0.0% | 0.0% | 0.0% | 0.0% | 24.0% |
| Keswick | CDP | 660 | 96.5% | 3.5% | 0.0% | 0.0% | 0.0% | 3.0% |
| Lakehead | CDP | 347 | 78.1% | 1.7% | 12.1% | 0.0% | 8.1% | 4.0% |
| McArthur | CDP | 229 | 100.0% | 0.0% | 0.0% | 0.0% | 0.0% | 21.8% |
| Millville | CDP | 833 | 94.6% | 2.0% | 0.0% | 0.1% | 3.2% | 3.1% |
| Montgomery Creek | CDP | 103 | 77.7% | 20.4% | 0.0% | 1.9% | 0.0% | 0.0% |
| Mountain Gate | CDP | 1,293 | 81.4% | 15.4% | 0.0% | 0.0% | 3.2% | 0.0% |
| Old Station | CDP | 41 | 100.0% | 0.0% | 0.0% | 0.0% | 0.0% | 0.0% |
| Palo Cedro | CDP | 1,217 | 87.3% | 6.7% | 0.0% | 1.8% | 4.1% | 10.6% |
| Redding | City | 89,674 | 87.6% | 6.3% | 2.8% | 1.1% | 2.2% | 8.7% |
| Round Mountain | CDP | 124 | 81.5% | 0.0% | 0.0% | 0.0% | 18.5% | 0.0% |
| Shasta | CDP | 1,576 | 92.4% | 2.9% | 2.6% | 0.0% | 2.2% | 11.4% |
| Shasta Lake | City | 10,121 | 87.6% | 5.6% | 4.2% | 0.4% | 2.2% | 6.1% |
| Shingletown | CDP | 2,240 | 85.8% | 4.6% | 3.7% | 1.2% | 4.6% | 0.5% |
| Places by population and income | |||||
|---|---|---|---|---|---|
| Place | Type[21] | Population[22] | Per capita income[18] | Median household income[19] | Median family income[20] |
| Anderson | City | 9,927 | $17,210 | $34,862 | $39,766 |
| Bella Vista | CDP | 2,344 | $24,537 | $54,958 | $64,487 |
| Big Bend | CDP | 95 | $20,027 | $19,250 | $15,250 |
| Burney | CDP | 2,824 | $19,422 | $33,875 | $46,131 |
| Cassel | CDP | 473 | $22,696 | $65,156 | $66,406 |
| Cottonwood | CDP | 3,426 | $17,701 | $47,532 | $49,615 |
| Fall River Mills | CDP | 572 | $26,462 | $39,600 | $38,100 |
| French Gulch | CDP | 222 | $19,226 | $30,500 | $32,014 |
| Hat Creek | CDP | 183 | $38,961 | $55,536 | $56,339 |
| Keswick | CDP | 660 | $22,534 | $61,023 | $76,250 |
| Lakehead | CDP | 347 | $33,629 | $71,094 | $47,222 |
| McArthur | CDP | 229 | $24,510 | $21,563 | $39,276 |
| Millville | CDP | 833 | $31,570 | $72,250 | $76,667 |
| Montgomery Creek | CDP | 103 | $24,544 | $12,009 | $6,875 |
| Mountain Gate | CDP | 1,293 | $10,862 | $19,821 | $14,324 |
| Old Station | CDP | 41 | $18,946 | [23] | [23] |
| Palo Cedro | CDP | 1,217 | $32,302 | $68,688 | $75,772 |
| Redding | City | 89,674 | $23,548 | $43,157 | $54,987 |
| Round Mountain | CDP | 124 | $17,967 | $20,521 | $25,521 |
| Shasta | CDP | 1,576 | $35,850 | $67,548 | $83,009 |
| Shasta Lake | City | 10,121 | $21,026 | $42,901 | $52,860 |
| Shingletown | CDP | 2,240 | $26,325 | $48,953 | $71,719 |
2010
The 2010 United States Census reported that Shasta County had a population of 177,223. The racial makeup of Shasta County was 153,726 (86.7%) White, 1,548 (0.9%) African American, 4,950 (2.8%) Native American, 4,391 (2.5%) Asian, 271 (0.2%) Pacific Islander, 4,501 (2.5%) from other races, and 7,836 (4.4%) from two or more races. Hispanic or Latino of any race were 14,878 persons (8.4%).[24]
| Population reported at 2010 United States Census | |||||||||
|---|---|---|---|---|---|---|---|---|---|
Population | American | American | | Islander | races | more races | or Latino (of any race) | ||
| Shasta County | 177,223 | 153,726 | 1,548 | 4,950 | 4,391 | 271 | 4,501 | 7,836 | 14,878 |
cities and towns | Population | American | American | | Islander | races | more races | or Latino (of any race) | |
| Anderson | 9,932 | 8,273 | 70 | 426 | 256 | 17 | 353 | 537 | 1,070 |
| Redding | 89,861 | 77,117 | 1,092 | 2,034 | 3,034 | 156 | 2,307 | 4,121 | 7,787 |
| Shasta Lake City | 10,164 | 8,749 | 67 | 389 | 233 | 13 | 201 | 512 | 865 |
places | Population | American | American | | Islander | races | more races | or Latino (of any race) | |
| Bella Vista | 2,781 | 2,559 | 16 | 41 | 30 | 6 | 43 | 86 | 179 |
| Big Bend | 102 | 85 | 0 | 10 | 0 | 0 | 1 | 6 | 2 |
| Burney | 3,154 | 2,685 | 13 | 233 | 7 | 2 | 61 | 153 | 265 |
| Cassel | 207 | 194 | 0 | 3 | 0 | 0 | 4 | 6 | 6 |
| Cottonwood | 3,316 | 2,844 | 4 | 99 | 108 | 2 | 120 | 139 | 352 |
| Fall River Mills | 573 | 450 | 0 | 30 | 3 | 2 | 56 | 32 | 105 |
| French Gulch | 346 | 296 | 3 | 15 | 3 | 1 | 8 | 20 | 17 |
| Hat Creek | 309 | 239 | 4 | 45 | 2 | 4 | 9 | 6 | 20 |
| Keswick | 451 | 389 | 0 | 23 | 6 | 0 | 4 | 29 | 14 |
| Lakehead | 461 | 421 | 0 | 13 | 2 | 0 | 3 | 22 | 11 |
| McArthur | 338 | 217 | 0 | 15 | 0 | 0 | 98 | 8 | 119 |
| Millville | 727 | 673 | 0 | 6 | 6 | 1 | 22 | 19 | 50 |
| Montgomery Creek | 163 | 117 | 2 | 16 | 0 | 0 | 9 | 19 | 18 |
| Mountain Gate | 943 | 850 | 7 | 27 | 5 | 0 | 13 | 41 | 49 |
| Old Station | 51 | 49 | 0 | 1 | 0 | 0 | 0 | 1 | 2 |
| Palo Cedro | 1,269 | 1,164 | 7 | 24 | 6 | 1 | 22 | 45 | 74 |
| Round Mountain | 155 | 126 | 1 | 12 | 3 | 1 | 1 | 11 | 12 |
| Shasta | 1,771 | 1,612 | 11 | 37 | 23 | 1 | 7 | 80 | 56 |
| Shingletown | 2,283 | 2,124 | 5 | 49 | 8 | 1 | 13 | 83 | 86 |
communities | Population | American | American | | Islander | races | more races | or Latino (of any race) | |
| All others not CDPs (combined) | 47,866 | 42,493 | 246 | 1,402 | 656 | 63 | 1,146 | 1,860 | 3,719 |
2000
| Historical population | |||
|---|---|---|---|
| Census | Pop. | %± | |
| 1850 | 378 | — | |
| 1860 | 4,360 | 1,053.4% | |
| 1870 | 4,173 | −4.3% | |
| 1880 | 9,492 | 127.5% | |
| 1890 | 12,133 | 27.8% | |
| 1900 | 17,318 | 42.7% | |
| 1910 | 18,920 | 9.3% | |
| 1920 | 13,361 | −29.4% | |
| 1930 | 13,927 | 4.2% | |
| 1940 | 28,800 | 106.8% | |
| 1950 | 36,413 | 26.4% | |
| 1960 | 59,468 | 63.3% | |
| 1970 | 77,640 | 30.6% | |
| 1980 | 115,715 | 49.0% | |
| 1990 | 147,036 | 27.1% | |
| 2000 | 163,256 | 11.0% | |
| 2010 | 177,223 | 8.6% | |
| Est. 2015 | 179,533 | [25] | 1.3% |
| U.S. Decennial Census[26] 1790-1960[27] 1900-1990[28] 1990-2000[29] 2010-2015[2] | |||
As of the census[30] of 2000, there were 163,256 people, 63,426 households, and 44,017 families residing in the county. The population density was 43 people per square mile (17/km²). There were 68,810 housing units at an average density of 18 per square mile (7/km²). The racial makeup of the county was 89.3% White, 0.8% Black or African American, 2.8% Native American, 1.9% Asian, 0.1% Pacific Islander, 1.7% from other races, and 3.5% from two or more races. 5.5% of the population were Hispanic or Latino of any race. 15.7% were of German, 12.3% English, 11.2% Irish, 9.9% American and 5.2% Italian ancestry according to Census 2000. 94.0% spoke English and 3.3% Spanish as their first language.
There were 63,426 households out of which 31.7% had children under the age of 18 living with them, 53.0% were married couples living together, 11.9% had a female householder with no husband present, and 30.6% were non-families. 24.7% of all households were made up of individuals and 10.2% had someone living alone who was 65 years of age or older. The average household size was 2.52 and the average family size was 2.98.
In the county the population was spread out with 26.1% under the age of 18, 8.2% from 18 to 24, 25.3% from 25 to 44, 25.2% from 45 to 64, and 15.2% who were 65 years of age or older. The median age was 39 years. For every 100 females there were 95.1 males. For every 100 females age 18 and over, there were 91.2 males.
The median income for a household in the county was $34,335, and the median income for a family was $40,491. Males had a median income of $35,959 versus $24,773 for females. The per capita income for the county was $17,738. About 11.3% of families and 15.4% of the population were below the poverty line, including 21.0% of those under age 18 and 7.3% of those age 65 or over.
Annual events
- Kool April Nites (April): A classic car show
- Rodeo Week Festivities (May)
- Art Fair and Fiddler’s Jamboree (May)
- Whiskeytown Regatta (May)
- Watershed Festival (May)
- Strawberry Festival (May)
- Shasta Dragonwood Celtic Faire (May)
- Redding Exchange Club Air Show (June)
- Shasta District Fair (June)
- Fall River Valley Century Bike Ride (July)
- Fourth of July Fireworks Celebration (July)
- Burney Basin Days (July)
- Fall River Valley Wild Rice Festival (Aug)
- Intermountain Fair, Fall River Valley (September) The Shasta County Fair
- Stillwater Pow Wow (September)
- Big Bike Weekend (October)
- Fall River Valley Lights of Christmas Parade (December)
Education
High schools and below
- 43 elementary schools
- 10 junior high schools
- 8 high schools
- 35 private schools
Colleges and universities
Shasta County has four colleges and universities:
- Shasta College, Redding: 2 year, fully accredited
- Simpson University, Redding: 4 year, fully accredited
- National University, Redding: 4 year, fully accredited
- Shasta Bible College: 4 year
Housing
- Median price for a house is about $183,000 as of early 2014.[31]
- Median rental rate is $700/month.
Points of interest
- Lassen Peak
- Lassen Volcanic National Park
- Shasta Lake
- Turtle Bay Exploration Park
- Hat Creek Radio Observatory
- Iron Mountain Mine, one of the nation's most toxic waste sites
- Sundial Bridge/Turtle Bay, an architectural beauty and a natural habitat area surrounded by urbanization.
- Burney Falls
- Whiskeytown Dam and Lake, with John F. Kennedy Memorial
Communities
Cities
Census-designated places
Unincorporated communities
Population ranking
The population ranking of the following table is based on the 2010 census of Shasta County.[32]
† county seat
| Rank | City/Town/etc. | Municipal type | Population (2010 Census)
|
|---|---|---|---|
| 1 | † Redding | City | 89,861 |
| 2 | Shasta Lake | City | 10,164 |
| 3 | Anderson | City | 9,932 |
| 4 | Cottonwood | CDP | 3,316 |
| 5 | Burney | CDP | 3,154 |
| 6 | Bella Vista | CDP | 2,781 |
| 7 | Shingletown | CDP | 2,283 |
| 8 | Shasta | CDP | 1,771 |
| 9 | Palo Cedro | CDP | 1,269 |
| 10 | Mountain Gate | CDP | 943 |
| 11 | Millville | CDP | 727 |
| 12 | Fall River Mills | CDP | 573 |
| 13 | Lakehead | CDP | 461 |
| 14 | Keswick | CDP | 451 |
| 15 | French Gulch | CDP | 346 |
| 16 | McArthur | CDP | 338 |
| 17 | Hat Creek | CDP | 309 |
| 18 | Cassel | CDP | 207 |
| 19 | Montgomery Creek | CDP | 163 |
| 20 | Round Mountain | CDP | 155 |
| 21 | Big Bend | CDP | 102 |
| 22 | Old Station | CDP | 51 |
| 23 | Redding Rancheria[33] | AIAN | 34 |
| 24 | Roaring Creek Rancheria[34] | AIAN | 14 |
| 25 | Montgomery Creek Rancheria[35] | AIAN | 12 |
| 26 | Big Bend Rancheria[36] | AIAN | 9 |
See also
- List of school districts in Shasta County, California
- National Register of Historic Places listings in Shasta County, California
Notes
- 1 2 Percentage of registered voters with respect to total population. Percentages of party members with respect to registered voters follow.
- ↑ Only larceny-theft cases involving property over $400 in value are reported as property crimes.
- ↑ Other = Some other race + Two or more races
- ↑ Native American = Native Hawaiian or other Pacific Islander + American Indian or Alaska Native
References
- ↑ Originally, Mount Shasta was within the county, but it is now part of Siskiyou County.
- 1 2 3 4 "State & County QuickFacts". United States Census Bureau. Retrieved April 6, 2016.
- ↑ "Find a County". National Association of Counties. Retrieved 2011-06-07.
- ↑ "US Gazetteer files: 2010, 2000, and 1990". United States Census Bureau. 2011-02-12. Retrieved 2011-04-23.
- ↑ Mary C. Brinton, Victor Nee and Robert K. Merton (2001) The New Institutionalism in Sociology, Stanford University Press ISBN 0-8047-4276-6, 352 pages
- ↑ Forest Survey Release (1952) By California Forest and Range Experiment Station, Berkeley, California, no.13-3
- ↑ George Bishop Sudworth (1908) Forest Trees of the Pacific Slope, United States Forest Service, published by the United States G.P.O., Washington DC
- ↑ C. Michael Hogan. 2008. Aesculus californica, Globaltwitcher.com, ed. N. Stromberg
- 1 2 3 4 5 6 7 8 9 10 11 12 13 14 15 16 17 U.S. Census Bureau. American Community Survey, 2011 American Community Survey 5-Year Estimates, Table B02001. American FactFinder. Retrieved 2013-10-26.
- 1 2 3 4 5 6 7 8 9 10 11 12 13 14 15 16 17 California Secretary of State. February 10, 2013 - Report of Registration. Retrieved 2013-10-31.
- ↑ http://uselectionatlas.org/RESULTS/
- ↑ "California's 1st Congressional District - Representatives & District Map". Civic Impulse, LLC. Retrieved February 28, 2013.
- ↑ "Communities of Interest - Counties". California Citizens Redistricting Commission. Retrieved September 24, 2014.
- ↑ "Members Assembly". State of California. Retrieved March 2, 2013.
- 1 2 3 4 5 6 7 8 9 10 Office of the Attorney General, Department of Justice, State of California. Table 11: Crimes – 2009. Retrieved 2013-11-14.
- 1 2 3 United States Department of Justice, Federal Bureau of Investigation. Crime in the United States, 2012, Table 8 (California). Retrieved 2013-11-14.
- 1 2 U.S. Census Bureau. American Community Survey, 2011 American Community Survey 5-Year Estimates, Table B03003. American FactFinder. Retrieved 2013-10-26.
- 1 2 U.S. Census Bureau. American Community Survey, 2011 American Community Survey 5-Year Estimates, Table B19301. American FactFinder. Retrieved 2013-10-21.
- 1 2 U.S. Census Bureau. American Community Survey, 2011 American Community Survey 5-Year Estimates, Table B19013. American FactFinder. Retrieved 2013-10-21.
- 1 2 U.S. Census Bureau. American Community Survey, 2011 American Community Survey 5-Year Estimates, Table B19113. American FactFinder. Retrieved 2013-10-21.
- 1 2 U.S. Census Bureau. American Community Survey, 2011 American Community Survey 5-Year Estimates. American FactFinder. Retrieved 2013-10-21.
- ↑ U.S. Census Bureau. American Community Survey, 2011 American Community Survey 5-Year Estimates, Table B01003. American FactFinder. Retrieved 2013-10-21.
- 1 2 Data unavailable
- ↑ "2010 Census P.L. 94-171 Summary File Data". United States Census Bureau.
- ↑ "County Totals Dataset: Population, Population Change and Estimated Components of Population Change: April 1, 2010 to July 1, 2015". Retrieved July 2, 2016.
- ↑ "U.S. Decennial Census". United States Census Bureau. Retrieved May 31, 2014.
- ↑ "Historical Census Browser". University of Virginia Library. Retrieved May 31, 2014.
- ↑ "Population of Counties by Decennial Census: 1900 to 1990". United States Census Bureau. Retrieved May 31, 2014.
- ↑ "Census 2000 PHC-T-4. Ranking Tables for Counties: 1990 and 2000" (PDF). United States Census Bureau. Retrieved May 31, 2014.
- ↑ "American FactFinder". United States Census Bureau. Retrieved 2011-05-14.
- ↑ "Zillow". Retrieved 23 February 2014.
- ↑ http://www.census.gov/2010census/
- ↑ http://www.census.gov/2010census/popmap/ipmtext.php?fl=3095
- ↑ http://www.census.gov/2010census/popmap/ipmtext.php?fl=3185
- ↑ http://www.census.gov/2010census/popmap/ipmtext.php?fl=2330
- ↑ http://www.census.gov/2010census/popmap/ipmtext.php?fl=0215
External links
| Wikimedia Commons has media related to Shasta County, California. |
- Official website
- Shasta Historical Society—large database of historical Shasta County photographs
- Shastasearch.com: Shasta Regional Travel and Resource Guide
- Hiking trails in Shasta County
 |
Siskiyou County | Modoc County | | |
| Trinity County | |
Lassen County | ||
| ||||
| | ||||
| Tehama County | Plumas County |
Municipalities and communities of Shasta County, California, United States | ||
|---|---|---|
| Cities | | |
| CDPs | ||
| Unincorporated communities |
| |
| Indian reservations | ||
| Ghost town |
| |
Coordinates: 40°46′N 122°02′W / 40.76°N 122.04°W