Hidalgo County, Texas
| Hidalgo County, Texas | |||
|---|---|---|---|
| County | |||
| County of Hidalgo | |||
|
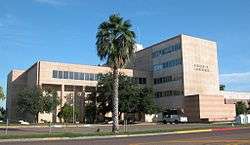
The Hidalgo County Courthouse at Edinburg in 2002. | |||
| |||
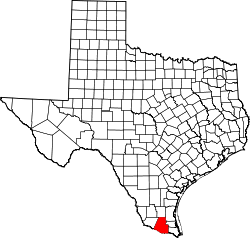 Location in the U.S. state of Texas | |||
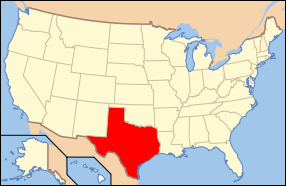 Texas's location in the U.S. | |||
| Founded | 1852 | ||
| Named for | Miguel Hidalgo y Costilla | ||
| Seat | Edinburg | ||
| Largest city | McAllen | ||
| Area | |||
| • Total | 1,583 sq mi (4,100 km2) | ||
| • Land | 1,571 sq mi (4,069 km2) | ||
| • Water | 12 sq mi (31 km2), 0.8% | ||
| Population | |||
| • (2010) | 774,769 | ||
| • Density | 493/sq mi (190/km²) | ||
| Congressional districts | 15th, 28th, 34th | ||
| Time zone | Central: UTC-6/-5 | ||
| Website |
www | ||


Hidalgo County is a county in the U.S. state of Texas. As of the 2010 census, the population was 774,769,[1] making it the eighth-most populous county in Texas. The county seat is Edinburg,[2] while the largest city is McAllen. The county is named for Miguel Hidalgo y Costilla, the priest who raised the call for Mexico's independence from Spain.[3]
Hidalgo County is also designated by the U.S. Census Bureau as the McAllen-Edinburg-Mission Metropolitan Statistical Area. It is located in the Rio Grande Valley of South Texas and is one of the fastest-growing counties in the United States.
Geography
According to the U.S. Census Bureau, the county has a total area of 1,583 square miles (4,100 km2), of which 1,571 square miles (4,070 km2) is land and 12 square miles (31 km2) (0.8%) is water.[4] The northern part of the county has sandy and light loamy soils over deep reddish or mottled, clayey subsoils. In some areas limestone lies within forty inches of the surface. The southern part of the county has moderately deep to deep loamy surfaces over clayey subsoils. Along the Rio Grande brown to red clays occur. Hidalgo County is in the South Texas Plains vegetation area, which features grasses, mesquite, live oaks, and chaparral. Native plants, reduced in recent years by extensive farming, include chapote, guayacan, ebony, huisache, brasil, and yucca.
In 1982, 91 percent of the land was in farms and ranches, with 52 percent of the farmland under cultivation and 85 percent irrigated; 51 to 60 percent of the county was considered prime farmland. The primary crops were sorghum, cotton, corn, and vegetables; Hidalgo County led Texas counties in the production of cabbage, onions, cantaloupes, carrots, and watermelons. The primary fruits and nuts grown in the county were grapefruit, oranges, and pecans. Cattle, milk cows, and hogs were the primary livestock products. Natural resources included caliche, sand, gravel, oil, and gas. Oil and gas production in 1982 totaled 98,487,211,000 cubic feet (2.7888472×10⁹ m3) of gas-well gas, 139,995 barrels of crude oil, 1,101,666 barrels of condensate, and 15,784,000 cubic feet (447,000 m3) of casinghead gas. The climate is subtropical and subhumid. Temperatures range from an average low of 47 °F (8 °C) in January to an average high to 96 °F (36 °C) in July; the average annual temperature is 73 °F (23 °C). Rainfall averages 23 inches (580 mm) a year, and the growing season lasts for 320 days of the year.[5]
Major highways
 Interstate 2
 Interstate 69C (under construction)
 U.S. Highway 83
 U.S. Highway 281
 Texas State Highway 107
 Texas State Highway 186
 Texas State Highway 336
 Texas State Highway 495
 Farm to Market Road 364
 Farm to Market Road 490
 Farm to Market Road 492
 Farm to Market Road 493
 Farm to Market Road 494
 Farm to Market Road 676
 Farm to Market Road 681
 Farm to Market Road 907
 Farm to Market Road 1016
 Farm to Market Road 1017
 Farm to Market Road 1423
 Farm to Market Road 1426
 Farm to Market Road 1924
 Farm to Market Road 1925
 Farm to Market Road 2061
 Farm to Market Road 2557
 Farm to Market Road 3072
Adjacent counties and municipalities
- Brooks County (north)
- Kenedy County (northeast)
- Willacy County (east)
- Cameron County (east)
- Starr County (west)
- Gustavo Díaz Ordaz Municipality, Tamaulipas, Mexico (south)
- Reynosa Municipality, Tamaulipas, Mexico (south)
- Río Bravo Municipality, Tamaulipas, Mexico (south)
- Matamoros Municipality, Tamaulipas, Mexico (southeast)
National protected areas
Demographics
| Historical population | |||
|---|---|---|---|
| Census | Pop. | %± | |
| 1860 | 1,182 | — | |
| 1870 | 2,387 | 101.9% | |
| 1880 | 4,347 | 82.1% | |
| 1890 | 6,534 | 50.3% | |
| 1900 | 6,837 | 4.6% | |
| 1910 | 13,728 | 100.8% | |
| 1920 | 38,110 | 177.6% | |
| 1930 | 77,004 | 102.1% | |
| 1940 | 106,059 | 37.7% | |
| 1950 | 160,446 | 51.3% | |
| 1960 | 180,904 | 12.8% | |
| 1970 | 181,535 | 0.3% | |
| 1980 | 283,229 | 56.0% | |
| 1990 | 383,545 | 35.4% | |
| 2000 | 569,463 | 48.5% | |
| 2010 | 774,769 | 36.1% | |
| Est. 2015 | 842,304 | [6] | 8.7% |
| U.S. Decennial Census[7] 1850–2010[8] 2010–2014[1] | |||
As of the 2010 United States Census, there were 774,769 people residing in the county. 88.0% were White, 1.0% Asian, 0.6% Black or African American, 0.3% Native American, 8.8% of some other race and 1.3% of two or more races. 90.6% were Hispanic or Latino (of any race).
There were 216,471 households, and 179,668 families residing in the county. The population density was 363 people per square mile (140/km²). There were 248,287 housing units at an average density of 123 per square mile (47/km²). There were 216,471 households out of which 54.2% had children under the age of 18 living with them, 65.00% were married couples living together, 18.8% had a female householder with no husband present, and 17.0% were non-families. 14.0% of all households were made up of individuals and 5.6% had someone living alone who was 65 years of age or older. The average household size was 3.55 and the average family size was 3.94.
In the county, the population was spread out with 34.7% under the age of 18, 10.7% from 18 to 24, 27.1% from 25 to 44, 18.2% from 45 to 64, and 9.3% who were 65 years of age or older. The median age was 28.3 years. For every 100 females there were 94.40 males. For every 100 females age 18 and over, there were 89.90 males.
The median income for a household in the county was $30,134, and the median income for a family was $31,760. Males had a median income of $22,635 versus $17,526 for females. The per capita income for the county was $12,130. About 32.60% of families and 35.80% of the population were below the poverty line, including 47.4% of those under age 18 and 29.8% of those age 65 or over. The county's per-capita income makes it one of the poorest counties in the United States. In 2009, it was tied with Bronx County, New York for "the greatest share of people receiving food stamps: 29 percent."[9]
Las Milpas, previously unincorporated, was annexed by Pharr in 1987.[10]
Metropolitan Statistical Area
The United States Office of Management and Budget has designated Hidalgo County as the McAllen-Edinburg-Mission, TX Metropolitan Statistical Area.[11] The United States Census Bureau ranked the McAllen-Edinburg-Mission, TX Metropolitan Statistical Area as the 70th most populous metropolitan statistical area of the United States as of July 1, 2012.[12]
The Office of Management and Budget has further designated the McAllen-Edinburg-Mission, TX Metropolitan Statistical Area as a component of the more extensive McAllen-Edinburg, TX Combined Statistical Area,[11] the 60th most populous combined statistical area and the 67th most populous primary statistical area of the United States as of July 1, 2012.[12][13]
Government and politics
| Year | GOP | DEM | Others |
|---|---|---|---|
| 2016 | 28.3% 38,981 | 68.6% 94,418 | 3.13% 4,321 |
| 2012 | 28.6% 39,865 | 70.4% 97,969 | 1.07% 1,488 |
| 2008 | 30.3% 39,688 | 69.0% 90,261 | 0.80% 1,043 |
| 2004 | 44.8% 50,931 | 55.9% 62,369 | 0.33% 383 |
| 2000 | 37.9% 38,301 | 60.8% 61,390 | 1.4% 1,359 |
| 1996 | 28.8%24.437 | 66.5% 56,335 | 4.5% 7,910 |
| 1992 | 30.5% 26,976 | 58.0% 51,205 | 11.3% 9,979 |
| 1988 | 34.9%29,246 | 64.8% 54,330 | 0.40% 294 |
| 1984 | 44.1% 35.059 | 55.6% 44,147 | 0.30% 226 |
| 1980 | 41.8% 25,808 | 56.0% 34,542 | 2.20% 1,367 |
| 1976 | 35.2% 19,199 | 64.1% 35,021 | 0.70% 373 |
| 1972 | 55.2% 22,920 | 44.3% 18,366 | 0.50% 213 |
| 1968 | 39.0% 14,455 | 54.1% 20,087 | 5.90% 2,569 |
| 1964 | 34.3%11,563 | 65.5% 22,110 | 0.20% 83 |
| 1960 | 42.1% 13,628 | 57.6% 18,663 | 0.40% 115 |
Hidalgo County tends to vote for the Democratic Party, although there is representation of the Republican Party in some of the offices that affect the county. Hidalgo County is represented by Ruben Hinojosa of Texas's 15th congressional district, and Henry Cuellar of Texas's 28th congressional district. In the 2012 presidential election, 70.4% of the voters voted for Barack Obama while 28.6% voted for Mitt Romney. The last time Hidalgo County voted Republican was in the 1972 presidential election when Richard Nixon won over 55% of the votes.
County services
The Hidalgo County Sheriff's Office (Texas) operates jail facilities and is the primary provider of law enforcement services to the unincorporated areas of the county.
County government
| Position | Name | Party | |
|---|---|---|---|
| County Judge | Ramon Garcia | Democratic | |
| Commissioner, Precinct 1 | A.C. Cuellar, Jr. | Democratic | |
| Commissioner, Precinct 2 | Eduardo "Eddie" Cantu | Democratic | |
| Commissioner, Precinct 3 | Joe M. Flores | Democratic | |
| Commissioner, Precinct 4 | Joseph Palacios | Democratic | |
| Criminal District Attorney | Ricardo Rodriguez | Democratic | |
| District Clerk | Laura Hinojosa | Democratic | |
| County Clerk | Arturo Guajardo, Jr. | Democratic | |
| Sheriff | J.E. "Eddie" Guerra | Democratic | |
| Tax Assessor-Collector | Pablo "Paul" Villarreal | Democratic | |
| Treasurer | Norma Garcia | Democratic | |
| Constable, Precinct 1 | Celestino Avila, Jr. | Democratic | |
| Constable, Precinct 2 | Martin Cantu | Democratic | |
| Constable, Precinct 3 | Lazaro Gallardo, Jr. | Democratic | |
| Constable, Precinct 4 | Atanacio "J.R." Gaitan | Democratic | |
Education
The following school districts serve Hidalgo County
- Donna Independent School District
- Edcouch-Elsa Independent School District
- Edinburg Consolidated Independent School District
- Hidalgo Independent School District
- La Joya Independent School District
- La Villa Independent School District
- Lyford Consolidated Independent School District (partial)
- McAllen Independent School District
- Mercedes Independent School District
- Mission Consolidated Independent School District
- Monte Alto Independent School District
- Progreso Independent School District
- Pharr-San Juan-Alamo Independent School District
- Sharyland Independent School District
- Valley View Independent School District
- Weslaco Independent School District
In addition, the county is served by the multi-county South Texas Independent School District. The Catholic Diocese of Brownsville operates three PK-8th Grade schools, two lower-level elementary schools and two high schools.
The Edinburg campus of the University of Texas Rio Grande Valley (formerly University of Texas-Pan American)is located in Hidalgo County, which along with neighboring Starr County is part of the South Texas College.
Media
Newspapers
- The Valley Town Crier
- The Edinburg Review
- The Monitor
- The Mid Valley Town Crier
- RGV Business Journal
- The Progress Times
- Texas Border Business
- Mega Doctor News
Radio stations
- KGBT 98.5FM
- KGBT 1530AM
- KBTQ 96.1FM
- KFRQ 94.5FM
- KKPS 99.5FM
- KNVO 101.1FM
- KVLY 107.9FM
- KURV 710 AM
- KVMV 96.9FM
- KRGE (AM) 1290 AM
- KTEX 100.3 FM
- KQXX 105.5 FM
Magazine
Communities
Cities
Town
Census-designated places
- Abram-Perezville
- Alton North (former)
- Cesar Chavez
- Citrus City
- Cuevitas
- Doffing
- Doolittle
- Faysville
- Hargill
- Havana
- Heidelberg
- Indian Hills
- La Blanca
- La Homa
- Laguna Seca
- Llano Grande
- Lopezville
- Los Ebanos
- McCook[14]
- Midway North
- Midway South
- Mila Doce
- Monte Alto
- Muniz
- North Alamo
- Nurillo
- Olivarez
- Palmview South
- Relampago
- San Carlos
- San Manuel-Linn
- Scissors
- South Alamo
- Villa Verde
- West Sharyland
See also
- List of museums in South Texas
- List of museums in the Texas Gulf Coast
- National Register of Historic Places listings in Hidalgo County, Texas
References
- 1 2 "State & County QuickFacts". United States Census Bureau. Retrieved December 17, 2013.
- ↑ "Find a County". National Association of Counties. Retrieved 2011-06-07.
- ↑ Gannett, Henry (1905). The Origin of Certain Place Names in the United States. Govt. Print. Off. p. 156.
- ↑ "2010 Census Gazetteer Files". United States Census Bureau. August 22, 2012. Retrieved April 30, 2015.
- ↑ "Hidalgo County". Texas Almanac. Retrieved Nov 23, 2011.
- ↑ "County Totals Dataset: Population, Population Change and Estimated Components of Population Change: April 1, 2010 to July 1, 2015". Retrieved July 2, 2016.
- ↑ "U.S. Decennial Census". United States Census Bureau. Retrieved April 30, 2015.
- ↑ "Texas Almanac: Population History of Counties from 1850–2010" (PDF). Texas Almanac. Retrieved April 30, 2015.
- ↑ Bloch, Matthew; Jason DeParle; Matthew Ericson; Robert Gebeloff (November 28, 2009). "Food Stamp Usage Across the Country". New York Times. Retrieved November 28, 2009.
- ↑ "LAS MILPAS, TX." Handbook of Texas. Retrieved on September 27, 2013.
- 1 2 "OMB Bulletin No. 13-01: Revised Delineations of Metropolitan Statistical Areas, Micropolitan Statistical Areas, and Combined Statistical Areas, and Guidance on Uses of the Delineations of These Areas" (PDF). United States Office of Management and Budget. February 28, 2013. Retrieved March 20, 2013.
- 1 2 "Table 1. Annual Estimates of the Population of Metropolitan and Micropolitan Statistical Areas: April 1, 2010 to July 1, 2012" (CSV). 2012 Population Estimates. United States Census Bureau, Population Division. March 2013. Retrieved March 20, 2013.
- ↑ "Table 2. Annual Estimates of the Population of Combined Statistical Areas: April 1, 2010 to July 1, 2012" (CSV). 2012 Population Estimates. United States Census Bureau, Population Division. March 2013. Retrieved March 20, 2013.
- ↑ Garza, Alicia A. "McCook, Texas". The Handbook of Texas. Retrieved July 14, 2009.
External links
- Official website
- Historic photos of Hidalgo County hosted by the Portal to Texas History
- Hidalgo County in Handbook of Texas Online at the University of Texas
- Hidalgo County Profile from the Texas Association of Counties
- Hidalgo County at the Wayback Machine (archived February 10, 2000)
 |
Brooks County | Kenedy County | | |
| Starr County | |
Willacy County and Cameron County | ||
| ||||
| | ||||
| Ciudad Gustavo Díaz Ordaz, Tamaulipas, Mexico; Matamoros, Tamaulipas, Mexico; Reynosa, Tamaulipas, Mexico; and Río Bravo, Tamaulipas, Mexico |
Coordinates: 26°24′N 98°11′W / 26.40°N 98.18°W