Los Angeles County, California
| Los Angeles County, California | ||||||||||
|---|---|---|---|---|---|---|---|---|---|---|
| County | ||||||||||
| County of Los Angeles | ||||||||||
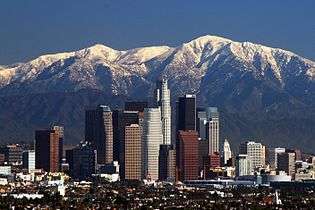
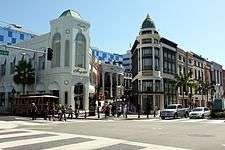
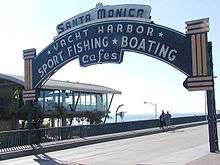
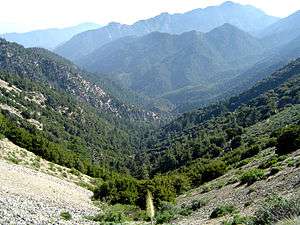
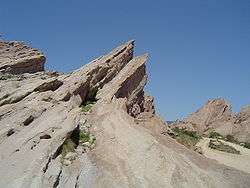
Images, from top down, left to right: Downtown Los Angeles in December 2007, Venice, Los Angeles during sunset, Rodeo Drive in Beverly Hills, CA, Satellite picture of Santa Catalina Island, the Santa Monica Pier, Angeles National Forest, Vasquez Rocks, Antelope Valley California Poppy Reserve | ||||||||||
| ||||||||||
| Nickname(s): "L.A. County" | ||||||||||
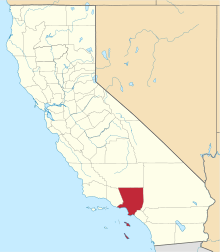 Location of the county in California | ||||||||||
 California's location in the contiguous United States | ||||||||||
| Coordinates: 34°3′N 118°15′W / 34.050°N 118.250°WCoordinates: 34°3′N 118°15′W / 34.050°N 118.250°W | ||||||||||
| Country |
| |||||||||
| State |
| |||||||||
| Region | Southern California | |||||||||
| Metro area | Greater Los Angeles Area | |||||||||
| Formed | February 18, 1850[1] | |||||||||
| Named for |
| |||||||||
| County seat | Los Angeles | |||||||||
| Largest city | Los Angeles | |||||||||
| Incorporated cities | 88 | |||||||||
| Government | ||||||||||
| • Type | Council–manager | |||||||||
| • Body | Board of Supervisors | |||||||||
| • Board of Supervisors[2] | ||||||||||
| • Chief executive officer | Sachi A. Hamai | |||||||||
| Area | ||||||||||
| • Total | 4,751 sq mi (12,310 km2) | |||||||||
| • Land | 4,058 sq mi (10,510 km2) | |||||||||
| • Water | 693 sq mi (1,790 km2) | |||||||||
| Highest elevation[3] | 10,068 ft (3,069 m) | |||||||||
| Lowest elevation[4] | 0 ft (0 m) | |||||||||
| Population (April 1, 2010)[5] | ||||||||||
| • Total | 9,818,605 | |||||||||
| • Estimate (2015)[5] | 10,170,292 | |||||||||
| • Density | 2,100/sq mi (800/km2) | |||||||||
| Time zone | Pacific Time Zone (UTC-8) | |||||||||
| • Summer (DST) | Pacific Daylight Time (UTC-7) | |||||||||
| ZIP codes | 90001–90899, 91001–93599 | |||||||||
| Area codes | 213, 310/424, 323, 562, 626, 661, 747/818, 909 | |||||||||
| FIPS code | 06-037 | |||||||||
| GNIS feature ID | 277283 | |||||||||
| Website |
www | |||||||||


Los Angeles County, officially the County of Los Angeles,[6] is a county in California. With a population of more than ten million people, it is the most populous county in the United States. Los Angeles County's population is larger than that of 40 individual U.S. states. It has 88 incorporated cities and many unincorporated areas and at 4,083 square miles (10,570 km2) it is larger than the combined areas of the U.S. states of Delaware and Rhode Island. The county is home to more than one quarter of all California residents and is one of the most ethnically diverse counties in the U.S.[7] Its county seat is the city of Los Angeles, which is the second most populous city in the nation and the most populous that lies entirely in a single county.
History
Los Angeles County is one of the original counties of California, created at the time of statehood in 1850.[8] The county originally included parts of what are now Kern, San Bernardino, Riverside and Orange counties. As the population increased, sections were split off to organize San Bernardino County in 1853, Kern County in 1866, and Orange County in 1889.
Geography

According to the U.S. Census Bureau, the county has an area of 4,751 square miles (12,310 km2), of which 4,058 square miles (10,510 km2) is land and 693 square miles (1,790 km2) (15%) is water.[9] Los Angeles County borders 70 miles (110 km) of coast on the Pacific Ocean and encompasses mountain ranges, valleys, forests, islands, lakes, rivers, and desert. The Los Angeles River, Rio Hondo, the San Gabriel River and the Santa Clara River flow in Los Angeles County, while the primary mountain ranges are the Santa Monica Mountains and the San Gabriel Mountains. The western extent of the Mojave Desert begins in the Antelope Valley, in the northeastern part of the county. Most of the population of Los Angeles County is located in the south and southwest, with major population centers in the Los Angeles Basin, San Fernando Valley and San Gabriel Valley. Other population centers are found in the Santa Clarita Valley, Pomona Valley, Crescenta Valley and Antelope Valley.
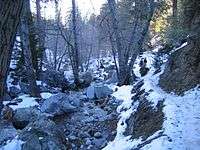
The county is divided west-to-east by the San Gabriel Mountains, which are part of the Transverse Ranges of southern California, and are contained mostly within the Angeles National Forest. Most of the county's highest peaks are in the San Gabriel Mountains, including Mount San Antonio 10,068 feet (3,069 m)) at the Los Angeles-San Bernardino county lines, Mount Baden-Powell 9,399 feet (2,865 m), Mount Burnham 8,997 feet (2,742 m) and Mount Wilson 5,710 feet (1,740 m). Several lower mountains are in the northern, western, and southwestern parts of the county, including the San Emigdio Mountains, the southernmost part of Tehachapi Mountains and the Sierra Pelona Mountains.
Los Angeles County includes San Clemente Island and Santa Catalina Island, which are part of the Channel Islands archipelago off the Pacific Coast.
Lakes and reservoirs
Major divisions of the county
- East: Eastside, San Gabriel Valley, portions of the Pomona Valley
- West: Westside, Beach Cities
- South: South Bay, South Los Angeles, Palos Verdes Peninsula, Gateway Cities, Los Angeles Harbor Region
- North: San Fernando Valley, Crescenta Valley, portions of the Conejo Valley, portions of the Antelope Valley and Santa Clarita Valley
- Central: Downtown Los Angeles, Mid-Wilshire, Northeast Los Angeles
National protected areas
- Angeles National Forest (part)
- Los Padres National Forest (part)
- Santa Monica Mountains National Recreation Area (part)
Demographics
Los Angeles County had a population of 9,818,605 in the 2010 United States Census. The racial makeup of Los Angeles County was 4,936,599 (50%) White, 1,346,865 (13.7%) Asian, 856,874 (9%) African American, 72,828 (0.7%) Native American, 26,094 (0.3%) Pacific Islander, 2,140,632 (21.8%) from other races, and 438,713 (4.5%) from two or more races.
Non-Hispanic whites numbered 2,728,321, or 28% of the population.[10] Hispanic or Latino residents of any race numbered 4,687,889 (48%); 36% of Los Angeles County's population was of Mexican ancestry; 3.7% Salvadoran, and 2.2% Guatemalan heritage.[11]
The county has a large population of Asians, being home to the largest concentration of immigrants who are Burmese, Cambodian, Chinese, Filipino, Indonesian, Korean, Sri Lankan, Taiwanese, and Thai in the world.[12] The largest Asian groups of the 1,346,865 (13.7%) Asians in Los Angeles County are 4.0% Chinese, 3.3% Filipino, 2.2% Korean, 1.0% Japanese, 0.9% Vietnamese, 0.8% Indian, and 0.3% Cambodian.
| Historical population | |||
|---|---|---|---|
| Census | Pop. | %± | |
| 1850 | 3,530 | — | |
| 1860 | 11,333 | 221.0% | |
| 1870 | 15,309 | 35.1% | |
| 1880 | 33,381 | 118.0% | |
| 1890 | 101,454 | 203.9% | |
| 1900 | 170,298 | 67.9% | |
| 1910 | 504,131 | 196.0% | |
| 1920 | 936,455 | 85.8% | |
| 1930 | 2,208,492 | 135.8% | |
| 1940 | 2,785,643 | 26.1% | |
| 1950 | 4,151,687 | 49.0% | |
| 1960 | 6,038,771 | 45.5% | |
| 1970 | 7,041,980 | 16.6% | |
| 1980 | 7,477,421 | 6.2% | |
| 1990 | 8,863,164 | 18.5% | |
| 2000 | 9,519,338 | 7.4% | |
| 2010 | 9,818,605 | 3.1% | |
| Est. 2015 | 10,170,292 | [13] | 3.6% |
| U.S. Decennial Census[14] 1790–1960[15] 1900–1990[16] 1990–2000[17] 2010–2015[18] | |||
Race and ancestry
| Population, race, and income (2011) | |||||
|---|---|---|---|---|---|
| Total population[19] | 9,787,747 | ||||
| White[19] | 5,126,367 | 52.4% | |||
| Black or African American[19] | 844,048 | 8.6% | |||
| American Indian or Alaska Native[19] | 49,329 | 0.5% | |||
| Asian[19] | 1,347,782 | 13.8% | |||
| Native Hawaiian or other Pacific Islander[19] | 26,310 | 0.3% | |||
| Some other race[19] | 2,064,759 | 21.1% | |||
| Two or more races[19] | 329,152 | 3.4% | |||
| Hispanic or Latino (of any race)[20] | 4,644,328 | 47.5% | |||
| Per capita income[21] | $27,954 | ||||
| Median household income[22] | $56,266 | ||||
| Median family income[23] | $62,595 | ||||
The racial makeup of the county is 48.7% White,[24] 11.0% African American, 0.8% Native American, 10.0% Asian, 0.3% Pacific Islander, 23.5% from other races, and 4.9% from two or more races. 44.6% of the population are Hispanic or Latino of any race. The largest European-American ancestry groups are German (6%), Irish (5%), English (4%) and Italian (3%). 45.9% of the population reported speaking only English at home; 37.9% spoke Spanish, 2.22% Tagalog, 2.0% Chinese, 1.9% Korean, and 1.87% Armenian.[25]
The county has the largest Native American population of any county in the nation: according to the 2000 census, it has more than 153,550 people of indigenous descent, and most are from Latin America.
As estimated by the Public Policy Institute of California in 2008, Los Angeles County is home to more than one-third of California's illegal immigrants, who make up more than ten percent of the population.[26]
2000

At the census[27] of 2000, there were 9,519,338 people, 3,133,774 households, and 2,137,233 families residing in the county. The population density was 2,344 people per square mile (905/km²). There were 3,270,909 housing units at an average density of 806 per square mile (311/km²).
There were 3,133,774 households out of which 37% had children under the age of 18 living with them, 48% were married couples living together, 15% had a female householder with no husband present, and 32% were non-families. 25% of all households were made up of individuals and 7% had someone living alone who was 65 years of age or older. The average household size was 2.98 and the average family size was 3.61.
In the county the population was spread out with 28% under the age of 18, 10% from 18 to 24, 33% from 25 to 44, 19% from 45 to 64, and 10% who were 65 years of age or older. The median age was 32 years. For every 100 females there were 97.7 males. For every 100 females age 18 and over, there were 95.0 males.
Income

The median income for a household in the county was $42,189, and the median income for a family was $46,452. Males had a median income of $36,299 versus $30,981 for females. The per capita income for the county was $20,683. There are 14.4% of families living below the poverty line and 17.9% of the population, including 24.2% of under 18 and 10.5% of those over 64. Los Angeles County has the highest number of millionaires of any county in the nation, totaling 261,081 households as of 2007.[28]
The homeownership rate is 47.9%, and the median value for houses is $409,300. 42.2% of housing units are in multi-unit structures. Los Angeles County has the largest number of homeless people, with "48,000 people living on the streets, including 6,000 veterans."[29]
Religion
In 2000, there were hundreds of Christian churches, 202 Jewish synagogues, 145 Buddhist temples, 48 Muslim mosques, 44 Bahai worship centers, 37 Hindu temples, 28 Tenrikyo churches and fellowships, 16 Shinto worship centers, and 14 Sikh gurdwaras in the county.[30] The Los Angeles Archdiocese has approximately 5 million members and is the largest in the United States.
Law, government and politics
Government
The Government of Los Angeles County is defined and authorized under the California Constitution, California law and the Charter of the County of Los Angeles.[31] Much of the Government of California is in practice the responsibility of local governments such as the Government of Los Angeles County.
The county's voters elect a governing five-member Los Angeles County Board of Supervisors. The small size of the board means each supervisor represents over 2 million people. The board operates in a legislative, executive, and quasi-judicial capacity. As a legislative authority, it can pass ordinances for the unincorporated areas (ordinances that affect the whole county, like posting of restaurant ratings, must be ratified by the individual city). As an executive body, it can tell the county departments what to do, and how to do it. As a quasi-judicial body, the Board is the final venue of appeal in the local planning process, and holds public hearings on various agenda items.
As of 2008, the Board of Supervisors oversees a $22.5 billion annual budget and approximately 100,000 employees.[32] The county government is managed on a day-to-day basis by a Chief Executive Officer and is organized into many departments, each of which is enormous in comparison to equivalent county-level (and even many state-level) departments anywhere else in the United States. Some of the larger or better-known departments include:

- Los Angeles County Department of Consumer and Business Affairs – offers consumers in the county a variety of services including: consumer and real estate counseling, mediation, and small claims counseling investigates consumer complains, real estate fraud and identity theft issues. The department also provides small business certifications and helps entrepreneurs navigate the process of opening a business.
- Los Angeles County Department of Children and Family Services – administers foster care
- Los Angeles County Fire Department – provides fire protection services.
- Los Angeles County Department of Health Services – operates several county hospitals and a network of primary care clinics,
- Los Angeles County Department of Public Health - administers public health programs including STD programs, smoking cessation, and restaurant inspection. In the majority of the county LACDPH puts letter grades relating to the food cleanliness and safety of a restaurant in the front window of restaurants.
- Los Angeles County Department of Public Social Services – administers many federal and state welfare programs
- Los Angeles County Department of Public Works – operates countywide flood control system, constructs and maintains roads in unincorporated areas
- Los Angeles County District Attorney – prosecutes criminal suspects.
- Los Angeles County Office of the Public Defender – Defends indigent people accused of criminal offenses.
- Los Angeles County Probation Department
- Los Angeles County Sheriff's Department – provides law enforcement services.
The Los Angeles County Metropolitan Transportation Authority, despite its name, is not a County department. Technically it is a state-mandated county transportation commission that also operates bus and rail.
Politics
| Year | GOP | DEM | Others |
|---|---|---|---|
| 2016 | 22.5% 764,984 | 72.0% 2,447,329 | 5.5% 185,693 |
| 2012 | 27.8% 885,333 | 69.7% 2,216,903 | 2.5% 78,831 |
| 2008 | 28.8% 956,425 | 69.2% 2,295,853 | 2.0% 65,970 |
| 2004 | 35.6% 1,076,225 | 63.2% 1,907,736 | 1.3% 39,319 |
| 2000 | 32.4% 871,930 | 63.5% 1,710,505 | 4.2% 112,719 |
| 1996 | 31.0% 746,544 | 59.3% 1,430,629 | 9.7% 233,841 |
| 1992 | 29.0% 799,607 | 52.5% 1,446,529 | 18.4% 507,267 |
| 1988 | 46.9% 1,239,716 | 51.9% 1,372,352 | 1.2% 32,603 |
| 1984 | 54.5% 1,424,113 | 44.4% 1,158,912 | 1.1% 29,889 |
| 1980 | 50.2% 1,224,533 | 40.2% 979,830 | 9.7% 235,822 |
| 1976 | 47.8% 1,174,926 | 49.7% 1,221,893 | 2.5% 62,258 |
| 1972 | 54.8% 1,549,717 | 42.0% 1,189,977 | 3.2% 90,676 |
| 1968 | 47.6% 1,266,480 | 46.0% 1,223,251 | 6.3% 168,251 |
| 1964 | 42.5% 1,161,067 | 57.4% 1,568,300 | 0.1% 1,551 |
| 1960 | 49.4% 1,302,661 | 50.2% 1,323,818 | 0.3% 8,020 |
| 1956 | 55.4% 1,260,206 | 44.3% 1,007,887 | 0.3% 7,331 |
| 1952 | 56.2% 1,278,407 | 42.7% 971,408 | 1.1% 24,725 |
| 1948 | 46.5% 804,232 | 47.0% 812,690 | 6.5% 112,160 |
| 1944 | 42.7% 666,441 | 56.8% 886,252 | 0.6% 8,871 |
| 1940 | 40.6% 574,266 | 58.1% 822,718 | 1.3% 18,285 |
| 1936 | 31.6% 357,401 | 67.0% 757,351 | 1.4% 15,663 |
| 1932 | 38.6% 373,738 | 57.2% 554,476 | 4.3% 41,380 |
| 1928 | 70.2% 513,526 | 28.7% 209,945 | 1.1% 7,830 |
| 1924 | 65.5% 299,675 | 7.3% 33,554 | 27.2% 124,228 |
| 1920 | 69.1% 178,117 | 21.6% 55,661 | 9.3% 23,992 |
Voter registration
| Population and registered voters | ||
|---|---|---|
| Total population[19] | 9,787,747 | |
| Registered voters[34][note 1] | 4,865,403 | 49.7% |
| Democratic[34] | 2,486,479 | 51.1% |
| Republican[34] | 1,048,507 | 21.6% |
| Democratic–Republican spread[34] | +1,437,972 | +29.5% |
| Independent[34] | 109,055 | 2.2% |
| Green[34] | 24,534 | 0.5% |
| Libertarian[34] | 25,808 | 0.5% |
| Peace and Freedom[34] | 24,950 | 0.5% |
| Americans Elect[34] | 2,583 | 0.1% |
| Other[34] | 262,180 | 5.4% |
| No party preference[34] | 881,307 | 18.1% |
Overview
Los Angeles County has voted for the Democratic candidate in most of the presidential elections in the past four decades, and has gone Democratic in every election since 1988. However, it did vote twice for Dwight Eisenhower (1952, 1956), Richard Nixon (1968, 1972), and Ronald Reagan (1980, 1984) the latter two of whom were Californians. From 1920 to 1984 it was a bellwether county that always voted for the eventual national winner. It voted against the national popular vote winner in 1988 and 2004. In 2008 and 2012 approximately 69% of the electorate voted for Democrat Barack Obama.
In the United States House of Representatives, Los Angeles County is split between 18 congressional districts:[35] In the California State Senate, Los Angeles County is split between 15 legislative districts:[36] In the California State Assembly, Los Angeles County is split between 24 legislative districts:[37]
On November 4, 2008, Los Angeles County was almost evenly split over Proposition 8 which amended the California Constitution to ban same-sex marriages. The county voted for the amendment 50.1% with a margin of 2,385 votes.[38]
Legal system
The Los Angeles Superior Court, has jurisdiction over all cases arising under state law, while the U.S. District Court for the Central District of California hears all federal cases. Both are headquartered in a large cluster of government buildings in the city's Civic Center.
Historically, the courthouses were county-owned buildings that were maintained at county expense, which created significant friction since the trial court judges, as officials of the state government, had to lobby the county Board of Supervisors for facility renovations and upgrades. In turn, the state judiciary successfully persuaded the state Legislature to authorize the transfer of all courthouses to the state government in 2008 and 2009 (so that judges would have direct control over their own courthouses). Courthouse security is still provided by the county government under a contract with the state.
Unlike the largest city in the United States, New York City, all of the city of Los Angeles and most of its important suburbs are located within a single county. As a result, both the county superior court and the federal district court are respectively the busiest courts of their type in the nation.[39][40]
Many celebrities like O. J. Simpson have been seen in Los Angeles courts. In 2003, the television show Extra (based in nearby Glendale) found itself running so many reports on the legal problems of local celebrities that it spun them off into a separate show, Celebrity Justice.
State cases are appealed to the Court of Appeal for the Second Appellate District, which is also headquartered in the Civic Center, and then to the California Supreme Court, which is headquartered in San Francisco but also hears argument in Los Angeles (again, in the Civic Center). Federal cases are appealed to the Court of Appeals for the Ninth Circuit, which hears them at its branch building in Pasadena. The court of last resort for federal cases is the U.S. Supreme Court in Washington, D.C.
Crime
The following table includes the number of incidents reported and the rate per 1,000 persons for each type of offense.
| Population and crime rates | ||
|---|---|---|
| Population[19] | 9,787,747 | |
| Violent crime[41] | 54,747 | 5.59 |
| Homicide[41] | 699 | 0.07 |
| Forcible rape[41] | 2,114 | 0.22 |
| Robbery[41] | 24,528 | 2.51 |
| Aggravated assault[41] | 27,406 | 2.80 |
| Property crime[41] | 155,583 | 15.90 |
| Burglary[41] | 50,558 | 5.17 |
| Larceny-theft[41][note 2] | 144,589 | 14.77 |
| Motor vehicle theft[41] | 46,710 | 4.77 |
| Arson[41] | 2,815 | 0.29 |
Cities by population and crime rates
| Cities by population and crime rates | ||||||||
|---|---|---|---|---|---|---|---|---|
| City | Population[42] | Violent crimes[42] | Violent crime rate per 1,000 persons |
Property crimes[42] | Property crime rate per 1,000 persons | |||
| Agoura Hills | 20,667 | 12 | 0.58 | 236 | 11.42 | |||
| Alhambra | 84,469 | 149 | 1.76 | 1,919 | 22.72 | |||
| Arcadia | 57,295 | 57 | 0.99 | 1,388 | 24.23 | |||
| Artesia | 16,793 | 60 | 3.57 | 262 | 15.60 | |||
| Avalon | 3,795 | 13 | 3.43 | 64 | 16.86 | |||
| Azusa | 47,111 | 220 | 4.67 | 1,204 | 25.56 | |||
| Baldwin Park | 76,644 | 261 | 3.41 | 1,585 | 20.68 | |||
| Bell | 36,062 | 225 | 6.24 | 662 | 18.36 | |||
| Bellflower | 77,886 | 304 | 3.90 | 1,802 | 23.14 | |||
| Bell Gardens | 42,769 | 125 | 2.92 | 728 | 17.02 | |||
| Beverly Hills | 34,677 | 89 | 2.57 | 1,081 | 31.17 | |||
| Bradbury | 1,067 | 0 | 0.00 | 10 | 9.37 | |||
| Burbank | 105,057 | 243 | 2.31 | 2,493 | 23.73 | |||
| Calabasas | 23,442 | 13 | 0.55 | 238 | 10.15 | |||
| Carson | 93,233 | 520 | 5.58 | 2,709 | 29.06 | |||
| Cerritos | 49,856 | 120 | 2.41 | 1,870 | 37.51 | |||
| Claremont | 35,469 | 40 | 1.13 | 901 | 25.40 | |||
| Commerce | 13,035 | 112 | 8.59 | 1,010 | 77.48 | |||
| Compton | 98,057 | 1,218 | 12.42 | 2,399 | 24.47 | |||
| Covina | 48,588 | 151 | 3.11 | 1,651 | 33.98 | |||
| Cudahy | 24,201 | 151 | 6.24 | 347 | 14.34 | |||
| Culver City | 39,528 | 179 | 4.53 | 1,760 | 44.53 | |||
| Diamond Bar | 56,470 | 55 | 0.97 | 952 | 16.86 | |||
| Downey | 113,628 | 381 | 3.35 | 3,537 | 31.13 | |||
| Duarte | 21,673 | 71 | 3.28 | 507 | 23.39 | |||
| El Monte | 115,356 | 395 | 3.42 | 2,230 | 19.33 | |||
| El Segundo | 16,931 | 38 | 2.24 | 595 | 35.14 | |||
| Gardena | 59,802 | 287 | 4.80 | 1,321 | 22.09 | |||
| Glendale | 194,902 | 233 | 1.20 | 3,043 | 15.61 | |||
| Glendora | 50,903 | 59 | 1.16 | 1,293 | 25.40 | |||
| Hawaiian Gardens | 14,493 | 69 | 4.76 | 193 | 13.32 | |||
| Hawthorne | 85,692 | 637 | 7.43 | 2,181 | 25.45 | |||
| Hermosa Beach | 19,830 | 54 | 2.72 | 678 | 34.19 | |||
| Hidden Hills | 1,887 | 0 | 0.00 | 4 | 2.12 | |||
| Huntington Park | 59,079 | 373 | 6.31 | 1,917 | 32.45 | |||
| Industry | 222 | 68 | 306.31 | 1,110 | 5,000.00 | |||
| Inglewood | 111,488 | 780 | 7.00 | 2,673 | 23.98 | |||
| Irwindale | 1,447 | 15 | 10.37 | 243 | 167.93 | |||
| La Canada Flintridge | 20,584 | 12 | 0.58 | 324 | 15.74 | |||
| La Habra Heights | 5,413 | 6 | 1.11 | 44 | 8.13 | |||
| Lakewood | 81,382 | 227 | 2.79 | 2,062 | 25.34 | |||
| La Mirada | 49,312 | 98 | 1.99 | 776 | 15.74 | |||
| Lancaster | 159,155 | 859 | 5.40 | 3,498 | 21.98 | |||
| La Puente | 40,479 | 121 | 2.99 | 521 | 12.87 | |||
| La Verne | 31,575 | 50 | 1.58 | 823 | 26.06 | |||
| Lawndale | 33,312 | 167 | 5.01 | 397 | 11.92 | |||
| Lomita | 20,591 | 95 | 4.61 | 391 | 18.99 | |||
| Long Beach | 469,893 | 2,705 | 5.76 | 14,131 | 30.07 | |||
| Los Angeles | 3,855,122 | 18,547 | 4.81 | 87,478 | 22.69 | |||
| Lynwood | 70,908 | 541 | 7.63 | 1,373 | 19.36 | |||
| Malibu | 12,854 | 15 | 1.17 | 329 | 25.60 | |||
| Manhattan Beach | 35,719 | 62 | 1.74 | 855 | 23.94 | |||
| Maywood | 27,850 | 175 | 6.28 | 286 | 10.27 | |||
| Monrovia | 37,199 | 81 | 2.18 | 948 | 25.48 | |||
| Montebello | 63,538 | 146 | 2.30 | 1,775 | 27.94 | |||
| Monterey Park | 61,270 | 75 | 1.22 | 1,022 | 16.68 | |||
| Norwalk | 107,295 | 433 | 4.04 | 2,609 | 24.32 | |||
| Palmdale | 155,294 | 812 | 5.23 | 3,393 | 21.85 | |||
| Palos Verdes Estates | 13,661 | 6 | 0.44 | 136 | 9.96 | |||
| Paramount | 54,997 | 244 | 4.44 | 1,536 | 27.93 | |||
| Pasadena | 139,382 | 433 | 3.11 | 3,379 | 24.24 | |||
| Pico Rivera | 63,988 | 261 | 4.08 | 1,780 | 27.82 | |||
| Pomona | 151,511 | 1,021 | 6.74 | 5,055 | 33.36 | |||
| Rancho Palos Verdes | 42,335 | 35 | 0.83 | 498 | 11.76 | |||
| Redondo Beach | 67,856 | 190 | 2.80 | 1,596 | 23.52 | |||
| Rolling Hills | 1,891 | 0 | 0.00 | 27 | 14.28 | |||
| Rolling Hills Estates | 8,202 | 9 | 1.10 | 129 | 15.73 | |||
| Rosemead | 54,656 | 143 | 2.62 | 913 | 16.70 | |||
| San Dimas | 33,923 | 51 | 1.50 | 668 | 19.69 | |||
| San Fernando | 24,039 | 77 | 3.20 | 380 | 15.81 | |||
| San Gabriel | 40,376 | 88 | 2.18 | 550 | 13.62 | |||
| San Marino | 13,364 | 13 | 0.97 | 183 | 13.69 | |||
| Santa Clarita | 179,248 | 342 | 1.91 | 2,742 | 15.30 | |||
| Santa Fe Springs | 16,492 | 99 | 6.00 | 1,272 | 77.13 | |||
| Santa Monica | 91,215 | 395 | 4.33 | 3,398 | 37.25 | |||
| Sierra Madre | 11,098 | 4 | 0.36 | 112 | 10.09 | |||
| Signal Hill | 11,198 | 43 | 3.84 | 536 | 47.87 | |||
| South El Monte | 20,452 | 88 | 4.30 | 399 | 19.51 | |||
| South Gate | 95,966 | 553 | 5.76 | 2,545 | 26.52 | |||
| South Pasadena | 26,045 | 27 | 1.04 | 443 | 17.01 | |||
| Temple City | 36,148 | 38 | 1.05 | 354 | 9.79 | |||
| Torrance | 147,851 | 190 | 1.29 | 2,690 | 18.19 | |||
| Vernon | 114 | 27 | 236.84 | 311 | 2,728.07 | |||
| Walnut | 29,658 | 37 | 1.25 | 382 | 12.88 | |||
| West Covina | 107,861 | 281 | 2.61 | 3,224 | 29.89 | |||
| West Hollywood | 34,971 | 338 | 9.67 | 1,642 | 46.95 | |||
| Westlake Village | 8,406 | 3 | 0.36 | 154 | 18.32 | |||
| Whittier | 86,740 | 247 | 2.85 | 2,502 | 28.84 | |||
Other statistics
Crime in 2008 (reported by the sheriff's office or police)[43]
- Assaults: 5452
- Auto thefts: 7727
- Burglaries: 5254
- Murders: 568 (5.7 per 100,000)
- Rapes: 582
- Robberies: 2210
- Thefts: 9682
Crime in 2013
- Homicides: 386[44]
- Thefts: 54,971 [45]
- Burglaries: 17,606
- Car Thefts: 15,866[45]
- Robberies: 10,202
- Violent Crimes: 20,318[45]
- Rapes: 843
- Assaults: 8,976[45]
- Murders: 297
Economy
Los Angeles County is commonly associated with the entertainment and digital media industry; all six major film studios—Paramount Pictures, 21st Century Fox, Sony, Warner Bros., Universal Pictures, and Walt Disney Studios—are located within the county. Numerous other major industries also define the economy of Los Angeles County, including international trade supported by the Port of Los Angeles and the Port of Long Beach, music recording and production, aerospace and defense, fashion, and professional services such as law, medicine, engineering and design services, financial services and more. High-tech sector employment within Los Angeles County is 368,500 workers,[46] and manufacturing employment within Los Angeles County is 365,000 workers.[47]
The following major companies have headquarters in Los Angeles County:
Education
The Los Angeles County Office of Education provides a supporting role for school districts in the area. The county office also operates two magnet schools, the International Polytechnic High School and Los Angeles County High School for the Arts. There are a number of private schools in the county, most notably those operated by the Los Angeles Archdiocese.
Colleges
- Antelope Valley College, Lancaster
- Art Center College of Design, Pasadena
- The Art Institute of California - Los Angeles (AICALA), Santa Monica
- California Institute of the Arts, Santa Clarita
- Cerritos College, Norwalk
- Citrus College, Glendora
- Claremont McKenna College, Claremont
- Claremont School of Theology, Claremont
- College of the Canyons, Santa Clarita
- DeVry University, Long Beach and West Hills (Los Angeles)
- East Los Angeles College, Monterey Park
- El Camino College, Torrance
- Fuller Theological Seminary, Pasadena
- Glendale Community College, Glendale
- Harvey Mudd College, Claremont
- Hebrew Union College, Los Angeles
- ITT Technical Institute, Culver City, San Dimas, Sylmar (Los Angeles), Torrance, and West Covina
- Life Pacific College, San Dimas
- Long Beach City College, Long Beach
- Los Angeles City College (LACC), Los Angeles
- Los Angeles Harbor College, Los Angeles
- Los Angeles Mission College, Sylmar (Los Angeles)
- Los Angeles Music Academy College of Music, Pasadena
- Los Angeles Pierce College (Pierce), Woodland Hills
- Los Angeles Southwest College, Los Angeles
- Los Angeles Trade Technical College (LATTC), Los Angeles
- Los Angeles Valley College, Valley Glen (Los Angeles)
- The Master's College, Santa Clarita
- Mount St. Mary's College, Los Angeles
- Mt. San Antonio College, Walnut
- Mt. Sierra College, Monrovia
- Occidental College (Oxy), Eagle Rock (Los Angeles)
- Otis College of Art and Design, Westchester (Los Angeles)
- Pacific Oaks College, Pasadena
- Pasadena City College, Pasadena
- Pitzer College, Claremont
- Pomona College, Claremont
- Rio Hondo College, Whittier
- Santa Monica College (SMC), Santa Monica
- Scripps College, Claremont
- West Los Angeles College, Culver City
- Whittier College, Whittier
- Wyoming Technical Institute (WyoTech), Long Beach
Universities
- American Jewish University (AJULA), Los Angeles
- Azusa Pacific University, Azusa
- Biola University, La Mirada
- California Institute of Technology (Caltech), Pasadena
- California State Polytechnic University, Pomona, (Cal Poly Pomona), Pomona
- California State University, Dominguez Hills (CSUDH), Carson
- California State University, Long Beach (CSULB), Long Beach
- California State University, Los Angeles (CSULA), Los Angeles
- California State University, Northridge (CSUN), Northridge (Los Angeles)
- Charles R. Drew University of Medicine and Science (Los Angeles)
- Claremont Graduate University, (CGU)
- Loyola Law School, (Downtown Los Angeles)
- Loyola Marymount University (LMU), Westchester (Los Angeles)
- National University, Los Angeles and Woodland Hills
- Pepperdine University, Malibu
- Southern California University of Health Sciences, Whittier
- Southern California Institute of Architecture (SCI-Arc), Los Angeles
- Southwestern University School of Law, Los Angeles
- University of Antelope Valley (UAV), Lancaster
- University of California, Los Angeles (UCLA), Westwood (Los Angeles)
- University of La Verne, La Verne
- University of Southern California (USC), Los Angeles
- University of the West (UWest), Rosemead
- Western University of Health Sciences (WesternU), Pomona
- Woodbury University, Burbank
Sites of interest


The county's most visited park is Griffith Park, owned by the city of Los Angeles. The county is also known for the annual Rose Parade in Pasadena, the annual Los Angeles County Fair in Pomona, the Los Angeles County Museum of Art, the Los Angeles Zoo, the Natural History Museum of Los Angeles County, the La Brea Tar Pits, the Arboretum of Los Angeles, and two horse racetracks and two car racetracks (Pomona Raceway and Irwindale Speedway), also the RMS Queen Mary located in Long Beach, and the Long Beach Grand Prix, and miles of beaches—from Zuma to Cabrillo.
Venice Beach is a popular attraction where its Muscle Beach used to find throngs of tourists admiring "hardbodies". Today, it is more arts-centered. Santa Monica's pier is a well known tourist spot, famous for its ferris wheel and bumper car rides, which were featured in the introductory segment of the television sitcom Three's Company. Further north in Pacific Palisades one finds the beaches used in the television series Baywatch. The fabled Malibu, home of many a film or television star, lies west of it.
In the mountain, canyon, and desert areas one may find Vasquez Rocks Natural Area Park, where many old westerns were filmed. Mount Wilson Observatory in the San Gabriel Mountains is open for the public to view astronomical stars from its telescope, now computer-assisted. Many county residents find relaxation in water skiing and swimming at Castaic Lake Recreation Area – the county's largest park by area – as well as enjoying natural surroundings and starry nights at Saddleback Butte State Park in the eastern Antelope Valley – California State Parks' largest in area within the county. The California Poppy Reserve is located in the western Antelope Valley and shows off the State's flower in great quantity on its rolling hills every spring.
Museums
- Battleship USS Iowa, Los Angeles Waterfront in San Pedro
- SS Lane Victory, Los Angeles Waterfront in San Pedro, just south of the USS Iowa
- California African American Museum
- California Science Center, Los Angeles (formerly the Museum of Science and Industry)
- Eli and Edythe Broad Art Museum
- Hammer Museum
- Huntington Library, San Marino
- Long Beach Museum of Art in the historic Elizabeth Milbank Anderson residence
- Los Angeles Children's Museum
- Los Angeles County Fire Museum, in Bellflower
- Los Angeles County Museum of Art, Mid-City, Los Angeles
- Museum of Contemporary Art, Downtown Los Angeles (founded in 1950); The Geffen Contemporary at MOCA, Downtown Los Angeles (founded in 1980)
- Museum of Jurassic Technology, Culver City
- Museum of Latin American Art in Long Beach
- Museum of Neon Art
- Museum of the American West (Gene Autry Museum), in Griffith Park
- Museum of Tolerance
- Natural History Museum of Los Angeles County
- Pasadena Museum of California Art, in Pasadena
- J. Paul Getty Center, Brentwood (Ancient Roman, Greek, and European Renaissance Art)
- J. Paul Getty Villa, Pacific Palisades, Getty's original house
- George C. Page Museum at La Brea Tar Pits
- Santa Monica Museum of Art, Santa Monica (Contemporary art)
- Norton Simon Museum, Pasadena (19th- and early 20th-century art)
- Skirball Cultural Center, Los Angeles
- Southwest Museum
Entertainment
Music venues

- California Plaza, which comprises:
- Cerritos Center for the Performing Arts
- The Forum
- Disney Concert Hall
- Greek Theatre
- Pantages Theatre
- Hollywood Bowl
- Hollywood Palladium
- House of Blues Sunset Strip
- John Anson Ford Amphitheatre
- The Orpheum Theatre
- The Roxy Theatre
- Royce Hall (UCLA)
- The Music Box
- El Rey Theatre
- Staples Center
- The Troubadour
- The Wiltern
- Whisky a Go Go
- Gibson Amphitheatre
Amusement parks
- Universal Studios Hollywood
- Raging Waters
- Six Flags Magic Mountain
- Six Flags Hurricane Harbor
- Pacific Park
Other attractions
Other areas
- Ridge Route
- Angeles National Forest
- Mount Wilson Observatory
- Malibu Creek State Park
- Vasquez Rocks Natural Area Park
- Plant 42's Blackbird Airpark and Heritage Airpark
- Antelope Valley California Poppy Reserve
- Cortes Bank
- Santa Catalina Island
- Mojave Desert
- Saddleback Butte State Park
- Antelope Valley Indian Museum State Historic Park
- Arthur B. Ripley Desert Woodland State Park
Transportation
Major highways
-
.svg.png) Interstate 5
Interstate 5 -
 I-5 Bus.
 .svg.png) I-10
I-10-
.svg.png) Interstate 105
Interstate 105 -
.svg.png) Interstate 405
Interstate 405 -
.svg.png) Interstate 605
Interstate 605 -
.svg.png) Interstate 110
Interstate 110 -
.svg.png) Interstate 210
Interstate 210 -
.svg.png) Interstate 710
Interstate 710 -
.svg.png) U.S. Route 101
U.S. Route 101 -
 State Route 1
 -
 State Route 2
 -
 State Route 14
 -
 State Route 18
 -
 State Route 19
 -
 State Route 22
 -
 State Route 23
 -
 State Route 27
 -
 State Route 39
 -
 State Route 47
 -
 State Route 57
 -
 State Route 60
 -
 State Route 66
 -
 State Route 71
 -
 State Route 72
 -
 State Route 90
 -
 State Route 91
 -
 State Route 103
 -
 State Route 107
 -
 State Route 110
 -
 State Route 118
 -
 State Route 126
 -
 State Route 134
 -
 State Route 138
 -
 State Route 170
 -
 State Route 187
 -
 State Route 210
 -
 State Route 213
Air
Los Angeles International Airport (LAX), located in the Westchester district, is the primary commercial airport for commercial airlines in the county and the Greater Los Angeles Area. LAX is operated by Los Angeles World Airports, an agency of the City of Los Angeles. Other important commercial airports in Los Angeles County include:
- Long Beach Municipal Airport operated by the City of Long Beach
- Bob Hope Airport in Burbank, operated by the Burbank-Glendale-Pasadena Airport Authority
The following general aviation airports also are located in Los Angeles County:
- County operated airports (Department of Public Works, Aviation Division)
- Compton/Woodley Airport in Compton
- San Gabriel Valley Airport in El Monte
- Brackett Field in La Verne
- Whiteman Airport in Pacoima
- General William J. Fox Airfield in Lancaster
- City operated airports
- Van Nuys Airport in Van Nuys, also operated by LAWA. Van Nuys Airport sees significant executive jet air traffic.
- LA/Palmdale Regional Airport in Palmdale. The airport is a separate facility on the grounds of Air Force Plant 42.
- Santa Monica Airport in Santa Monica, which also has major executive jet traffic.
- Hawthorne Municipal Airport, also known as Jack Northrop Field, in Hawthorne
- Zamperini Field in Torrance
Besides the non-flying Los Angeles Air Force Base in El Segundo, the U.S. Air Force has two airports in Los Angeles County:
- Portions of Edwards Air Force Base, located at the northern edge of the county, and
- Air Force Plant 42 in Palmdale, sharing runways with LA/Palmdale Regional.
Rail
Los Angeles is a major freight railroad transportation center, largely due to the large volumes of freight moving in and out of the county's port facilities. The ports are connected to the downtown rail yards and to the main lines of Union Pacific and Burlington Northern Santa Fe headed east via a grade-separated, freight rail corridor known as the Alameda Corridor.
Passenger rail service is provided in the county by Amtrak, Los Angeles Metro Rail and Metrolink.
Amtrak has the following intercity Amtrak service at Union Station in the city of Los Angeles.
- The Pacific Surfliner to Santa Barbara, San Luis Obispo, and San Diego.
- The Coast Starlight to Seattle
- The Southwest Chief to Chicago
- The Sunset Limited to New Orleans and Orlando
Union Station is also the primary hub for Metrolink commuter rail, which serves much of the Greater Los Angeles Area.
Light rail, subway (heavy rail), and long-distance bus service are all provided by the Los Angeles County Metropolitan Transportation Authority (Metro).
Sea
The county's two main seaports are the Port of Los Angeles and the Port of Long Beach. Together they handle over a quarter of all container traffic entering the United States, making the complex the largest and most important port in the country, and the third-largest port in the world by shipping volume.
The Port of Los Angeles is the largest cruise ship center on the West Coast, handling more than 1 million passengers annually.
The Port of Long Beach is home to the Sea Launch program, which uses a floating launch platform to insert payloads into orbits that would be difficult to attain from existing land-based launch sites.
Ferries link the Catalina Island city of Avalon to the mainland.
Communities
Cities
There are 88 incorporated cities in Los Angeles County. According to the 2010 U.S. Census, the most populous are:[49]
|
|
Unincorporated areas
Census designated places
- Acton
- Agua Dulce
- Alondra Park
- Altadena
- Avocado Heights
- Castaic
- Charter Oak
- Citrus
- Del Aire
- Desert View Highlands
- East Los Angeles
- East Pasadena
- East Rancho Dominguez
- East San Gabriel
- East Whittier
- Elizabeth Lake
- Florence-Graham
- Green Valley
- Hacienda Heights
- Hasley Canyon
- La Crescenta-Montrose
- Ladera Heights
- Lake Hughes
- Lake Los Angeles
- Lennox
- Leona Valley
- Littlerock
- Marina del Rey
- Mayflower Village
- North El Monte
- Quartz Hill
- Rose Hills
- Rowland Heights
- San Pasqual
- South Monrovia Island
- South San Gabriel
- South San Jose Hills
- South Whittier
- Stevenson Ranch
- Sun Village
- Topanga
- Val Verde
- Valinda
- View Park-Windsor Hills
- Vincent
- Walnut Park
- West Athens
- West Carson
- West Rancho Dominguez
- West Puente Valley
- West Whittier-Los Nietos
- Westmont
- Willowbrook
Other communities
Population ranking
The population ranking of the following table is based on the 2010 census of Los Angeles County.[51]
† county seat
| Rank | City/Town/etc. | Municipal type | Population (2010 Census)
|
|---|---|---|---|
| 1 | † Los Angeles | City | 3,792,621 |
| 2 | Long Beach | City | 462,257 |
| 3 | Glendale | City | 191,719 |
| 4 | Santa Clarita | City | 176,320 |
| 5 | Lancaster | City | 156,633 |
| 6 | Palmdale | City | 152,750 |
| 7 | Pomona | City | 149,058 |
| 8 | Torrance | City | 145,438 |
| 9 | Pasadena | City | 137,122 |
| 10 | East Los Angeles | CDP | 126,496 |
| 11 | El Monte | City | 113,475 |
| 12 | Downey | City | 111,772 |
| 13 | Inglewood | City | 109,673 |
| 14 | West Covina | City | 106,098 |
| 15 | Norwalk | City | 105,549 |
| 16 | Burbank | City | 103,340 |
| 17 | Compton | City | 96,455 |
| 18 | South Gate | City | 94,396 |
| 19 | Carson | City | 91,714 |
| 20 | Santa Monica | City | 89,736 |
| 21 | Whittier | City | 85,331 |
| 22 | Hawthorne | City | 84,293 |
| 23 | Alhambra | City | 83,089 |
| 24 | Lakewood | City | 80,048 |
| 25 | Bellflower | City | 76,616 |
| 26 | Baldwin Park | City | 75,390 |
| 27 | Lynwood | City | 69,772 |
| 28 | Redondo Beach | City | 66,748 |
| 29 | Florence-Graham | CDP | 63,387 |
| 30 | Pico Rivera | City | 62,942 |
| 31 | Montebello | City | 62,500 |
| 32 | Monterey Park | City | 60,269 |
| 33 | Gardena | City | 58,829 |
| 34 | Huntington Park | City | 58,114 |
| 35 | South Whittier | CDP | 57,156 |
| 36 | Arcadia | City | 56,364 |
| 37 | Diamond Bar | City | 55,544 |
| 38 | Paramount | City | 54,098 |
| 39 | Hacienda Heights | CDP | 54,038 |
| 40 | Rosemead | City | 53,764 |
| 41 | Glendora | City | 50,073 |
| 42 | Cerritos | City | 49,041 |
| 43 | Rowland Heights | CDP | 48,993 |
| 44 | La Mirada | City | 48,527 |
| 45 | Covina | City | 47,796 |
| 46 | Azusa | City | 46,361 |
| 47 | Altadena | CDP | 42,777 |
| 48 | Bell Gardens | City | 42,072 |
| 49 | Rancho Palos Verdes | City | 41,643 |
| 50 | La Puente | City | 39,816 |
| 51 | San Gabriel | City | 39,718 |
| 52 | Culver City | City | 38,883 |
| 53 | Monrovia | City | 36,590 |
| 54 | Willowbrook | CDP | 35,983 |
| 55 | Temple City | City | 35,558 |
| 56 | Bell | City | 35,477 |
| 57 | Manhattan Beach | City | 35,135 |
| 58 | Claremont | City | 34,926 |
| 59 | West Hollywood | City | 34,399 |
| 60 | Beverly Hills | City | 34,109 |
| 61 | San Dimas | City | 33,371 |
| 62 | Lawndale | City | 32,769 |
| 63 | Westmont | CDP | 31,853 |
| 64 | La Verne | City | 31,063 |
| 65 | Walnut | City | 29,172 |
| 66 | Maywood | City | 27,395 |
| 67 | South Pasadena | City | 25,619 |
| 68 | West Whittier-Los Nietos | CDP | 25,540 |
| 69 | Cudahy | City | 23,805 |
| 70 | San Fernando | City | 23,645 |
| 71 | Calabasas | City | 23,058 |
| 72 | Valinda | CDP | 22,822 |
| 73 | Lennox | CDP | 22,753 |
| 74 | West Puente Valley | CDP | 22,636 |
| 75 | West Carson | CDP | 21,699 |
| 76 | Duarte | City | 21,321 |
| 77 | South San Jose Hills | CDP | 20,551 |
| 78 | Agoura Hills | City | 20,330 |
| 79 | Lomita | City | 20,256 |
| 80 | La Cañada Flintridge | City | 20,246 |
| 81 | South El Monte | City | 20,116 |
| 82 | La Crescenta-Montrose | CDP | 19,653 |
| 83 | Hermosa Beach | City | 19,506 |
| 84 | Castaic | CDP | 19,015 |
| 85 | Stevenson Ranch | CDP | 17,557 |
| 86 | El Segundo | CDP | 16,654 |
| 87 | Artesia | City | 16,522 |
| 88 | Santa Fe Springs | City | 16,223 |
| 89 | Walnut Park | CDP | 15,966 |
| 90 | Vincent | CDP | 15,922 |
| 91 | Avocado Heights | CDP | 15,411 |
| 92 | East Rancho Dominguez | CDP | 15,135 |
| 93 | East San Gabriel | CDP | 14,874 |
| 94 | Hawaiian Gardens | City | 14,254 |
| 95 | Palos Verdes Estates | City | 13,438 |
| 96 | San Marino | City | 13,147 |
| 97 | Commerce | City | 12,823 |
| 98 | Malibu | City | 12,645 |
| 99 | Lake Los Angeles | CDP | 12,328 |
| 100 | Sun Village | CDP | 11,565 |
| 101 | View Park-Windsor Hills | CDP | 11,075 |
| 102 | Signal Hill | City | 11,016 |
| 103 | Sierra Madre | City | 10,917 |
| 104 | Quartz Hill | CDP | 10,912 |
| 105 | Citrus | CDP | 10,866 |
| 106 | Del Aire | CDP | 10,001 |
| 107 | East Whittier (formerly East La Mirada until 2012) | CDP | 9,757 |
| 108 | Charter Oak | CDP | 9,310 |
| 109 | Marina del Rey | CDP | 8,866 |
| 110 | West Athens | CDP | 8,729 |
| 111 | Alondra Park | CDP | 8,592 |
| 112 | Topanga | CDP | 8,289 |
| 113 | Westlake Village | City | 8,270 |
| 114 | South San Gabriel | CDP | 8,070 |
| 115 | Rolling Hills Estates | City | 8,067 |
| 116 | Acton | CDP | 7,596 |
| 117 | South Monrovia Island | CDP | 6,777 |
| 118 | Ladera Heights | CDP | 6,498 |
| 119 | East Pasadena | CDP | 6,144 |
| 120 | West Rancho Dominguez | CDP | 5,669 |
| 121 | Mayflower Village | CDP | 5,515 |
| 122 | La Habra Heights | City | 5,325 |
| 123 | Avalon | City | 3,728 |
| 124 | North El Monte | CDP | 3,723 |
| 125 | Agua Dulce | CDP | 3,342 |
| 126 | Rose Hills | CDP | 2,803 |
| 127 | Val Verde | CDP | 2,468 |
| 128 | Desert View Highlands | CDP | 2,360 |
| 129 | San Pasqual | CDP | 2,041 |
| 130 | Rolling Hills | City | 1,860 |
| 131 | Hidden Hills | City | 1,856 |
| 132 | Elizabeth Lake | CDP | 1,756 |
| 133 | Leona Valley | CDP | 1,607 |
| 134 | Irwindale | City | 1,422 |
| 135 | Littlerock | CDP | 1,377 |
| 136 | Hasley Canyon | CDP | 1,137 |
| 137 | Bradbury | City | 1,048 |
| 138 | Santa Susana (mostly in Ventura County) | CDP | 1,037 |
| 139 | Green Valley | CDP | 1,027 |
| 140 | Lake Hughes | CDP | 649 |
| 141 | Industry | City | 219 |
| 142 | Vernon | City | 112 |
See also
- List of museums in Los Angeles
- List of museums in Los Angeles County, California
- List of school districts in Los Angeles County, California
- List of schools in the Roman Catholic Archdiocese of Los Angeles
- National Register of Historic Places listings in Los Angeles County, California
Notes
References
- ↑ "Chronology". California State Association of Counties. Retrieved February 6, 2015.
- ↑ "Board of Supervisors". County of Los Angeles. Retrieved December 1, 2014.
- ↑ Mount San Antonio in the San Gabriel Mountains, on border with San Bernardino County.
- ↑ Sea level at the Pacific Ocean.
- 1 2 "American Fact Finder - Results". United States Census Bureau. Retrieved April 7, 2015.
- ↑ "Los Angeles County". lacounty.gov.
- ↑ "Newsroom: Population: Census Bureau Releases State and County Data Depicting Nation's Population Ahead of 2010 Census". Census.gov. Retrieved August 23, 2012.
- ↑ Coy, Owen C.; Ph.D. (1923). California County Boundaries. Berkeley: California Historical Commission. p. 140. ASIN B000GRBCXG.
- ↑ "2010 Census Gazetteer Files". United States Census Bureau. August 22, 2012. Retrieved September 26, 2015.
- ↑ "Los Angeles County, California". State & County QuickFacts. U.S. Census Bureau. Retrieved December 18, 2011.
- ↑ "2010 Census P.L. 94-171 Summary File Data". United States Census Bureau.
- ↑ Trinidad, Elson (27 September 2013). "L.A. County is the Capital of Asian America". KCET. Retrieved 27 September 2013.
- ↑ "County Totals Dataset: Population, Population Change and Estimated Components of Population Change: April 1, 2010 to July 1, 2015". Retrieved July 2, 2016.
- ↑ "U.S. Decennial Census". United States Census Bureau. Retrieved September 26, 2015.
- ↑ "Historical Census Browser". University of Virginia Library. Retrieved September 26, 2015.
- ↑ Forstall, Richard L., ed. (March 27, 1995). "Population of Counties by Decennial Census: 1900 to 1990". United States Census Bureau. Retrieved September 26, 2015.
- ↑ "Census 2000 PHC-T-4. Ranking Tables for Counties: 1990 and 2000" (PDF). United States Census Bureau. April 2, 2001. Retrieved September 26, 2015.
- ↑ "State & County QuickFacts". United States Census Bureau. Retrieved April 4, 2016.
- 1 2 3 4 5 6 7 8 9 10 U.S. Census Bureau. American Community Survey, 2011 American Community Survey 5-Year Estimates, Table B02001. American FactFinder. Retrieved October 26, 2013.
- ↑ U.S. Census Bureau. American Community Survey, 2011 American Community Survey 5-Year Estimates, Table B03003. American FactFinder. Retrieved October 26, 2013.
- ↑ U.S. Census Bureau. American Community Survey, 2011 American Community Survey 5-Year Estimates, Table B19301. American FactFinder. Retrieved October 21, 2013.
- ↑ U.S. Census Bureau. American Community Survey, 2011 American Community Survey 5-Year Estimates, Table B19013. American FactFinder. Retrieved October 21, 2013.
- ↑ U.S. Census Bureau. American Community Survey, 2011 American Community Survey 5-Year Estimates, Table B19113. American FactFinder. Retrieved October 21, 2013.
- ↑ This included over 65,000 Arabs and 75,000 Iranian, who many people would not count as White. See "2000 Census fact sheet table". Census.gov. Archived from the original on December 5, 2008.. For a clear discussion of Arabs being counted as white, see Overview of Race and Hispanic Origin, 2000 Census.
- ↑ "Language Map Data Center". Mla.org. July 17, 2007. Retrieved August 23, 2012.
- ↑ Johnson, Hans; Hill, Laura (July 2011). "Illegal Immigration" (PDF). Publications. Public Policy Institute of California. Retrieved January 15, 2013.
- ↑ "American FactFinder". United States Census Bureau. Retrieved May 14, 2011.
- ↑ Frank, Robert (May 5, 2008). "California Boasts Most Millionaires". The Wall Street Journal. Retrieved September 29, 2011.
- ↑ Nagourney, Adam (December 12, 2010). "Los Angeles Confronts Homelessness Reputation". New York Times. Retrieved December 14, 2010.
- ↑ Selected Non-Christian Religious Traditions in Los Angeles County: 2000 Prolades.com
- ↑ California Government Code § 23004
- ↑ William T Fujioka, "Department Section," County of Los Angeles, Annual Report 2007-2008, 4.
- ↑ http://uselectionatlas.org/RESULTS/
- 1 2 3 4 5 6 7 8 9 10 11 California Secretary of State. February 10, 2013 - Report of Registration. Retrieved October 31, 2013. Archived July 27, 2013, at the Wayback Machine.
- ↑ "Counties by County and by District". California Citizens Redistricting Commission. Retrieved September 24, 2014.
- ↑ "Communities of Interest — County". California Citizens Redistricting Commission. Retrieved September 28, 2014.
- ↑ "Communities of Interest — County". California Citizens Redistricting Commission. Retrieved September 28, 2014.
- ↑ "Statement of Vote: 2008 General Election" Archived October 18, 2012, at the Wayback Machine.
- ↑ A look at your Superior Court, Public Information Office, Los Angeles Superior Court
- ↑ "LA Court". lasuperiorcourt.org. Archived from the original on February 19, 2009.
- 1 2 3 4 5 6 7 8 9 10 Office of the Attorney General, Department of Justice, State of California. Table 11: Crimes – 2009. Retrieved November 14, 2013. Archived December 2, 2013, at the Wayback Machine.
- 1 2 3 United States Department of Justice, Federal Bureau of Investigation. Crime in the United States, 2012, Table 8 (California). Retrieved November 14, 2013.
- ↑ "City data – Los Angeles County, CA". analyzed data from numerous sources. Retrieved April 18, 2009.
- ↑ Kator, Zabi. "Is Security in Los Angeles getting better or worse". guardNOW Security Services. guardNOW Security Services. Retrieved August 28, 2013.
- 1 2 3 4 Kator, Zabi. "Los Angeles Security & Crime Statisics". guardNOW Security Services. guardNOW Security Services. Retrieved August 28, 2013.
- ↑ Lawren (2014-10-06). "LA Tech Report examines the regional high tech ecosystem". Los Angeles County Economic Development Corporation. Retrieved 2016-11-09.
- ↑ Lawren (2014-07-15). "Manufacturing employment & competitiveness in CA - New LAEDC report". Los Angeles County Economic Development Corporation. Retrieved 2016-11-09.
- ↑ Encyclopedia.com, "Dole gets ready to turn first shovel of headquarters dirt: plans are set to go to Westlake Village City Council". (Dole Food Co. Inc. Los Angeles Business Journal. January 31, 1994. Retrieved on September 27, 2009. Archived January 18, 2012, at the Wayback Machine.
- ↑ "Los Angeles County QuickFacts from the US Census Bureau". Quickfacts.census.gov. Retrieved August 23, 2012.
- ↑ Jon Gertner, "Playing Sim City for Real," New York Times Magazine, March 18, 2007
- ↑ http://www.census.gov/2010census/
External links
| Wikimedia Commons has media related to Los Angeles County, California. |
| Wikisource has the text of an 1879 American Cyclopædia article about Los Angeles County, California. |
- Official website
- LA County Sheriff's list of Unincorporated Areas in Los Angeles County
- Los Angeles Area Chamber of Commerce
 |
Kern County | Kern County | San Bernardino County | |
| Ventura County | |
San Bernardino County | ||
| ||||
| | ||||
| Pacific Ocean | Pacific Ocean | Orange County |
Population - 12,874,797 | ||
| Counties | 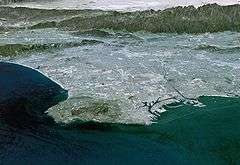 | |
| Major city 3.8 million | ||
| Cities over 250K | ||
| Cities and towns 100k-250k | ||
| Bodies of water | ||
| Regions |
| |