Santa Clara County, California
| Santa Clara County, California | ||||||||
|---|---|---|---|---|---|---|---|---|
| County | ||||||||
| County of Santa Clara | ||||||||
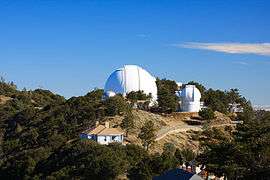
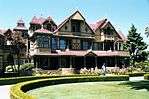
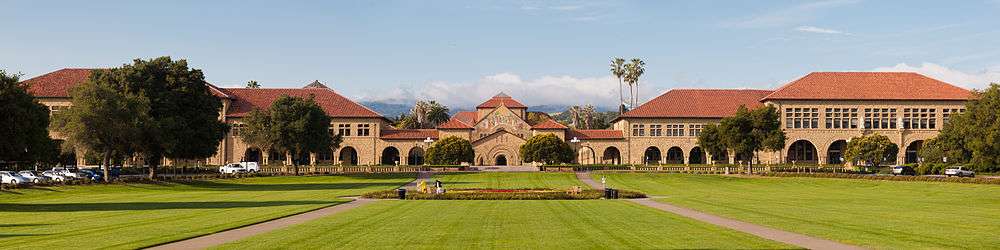
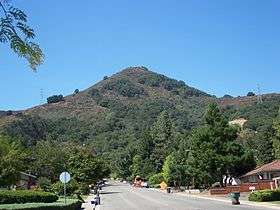
Images, from top down, left to right: A view looking west across Silicon Valley, Lick Observatory, Winchester Mystery House, a view of Stanford University from across the Oval, El Toro Hill in Morgan Hill, an aerial view of Hangar One at Moffett Federal Airfield in 2012 | ||||||||
| ||||||||
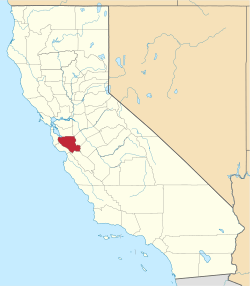 Location in the state of California | ||||||||
| Coordinates: 37°22′N 121°58′W / 37.36°N 121.97°WCoordinates: 37°22′N 121°58′W / 37.36°N 121.97°W | ||||||||
| Country |
| |||||||
| State |
| |||||||
| Region | San Francisco Bay Area | |||||||
| Incorporated | February 18, 1850[1] | |||||||
| Named for | Mission Santa Clara de Asís, St. Clare of Assisi | |||||||
| County seat | San Jose | |||||||
| Largest city | San Jose | |||||||
| Area | ||||||||
| • Total | 1,304 sq mi (3,380 km2) | |||||||
| • Land | 1,290 sq mi (3,300 km2) | |||||||
| • Water | 14 sq mi (40 km2) | |||||||
| Highest elevation[2] | 4,216 ft (1,285 m) | |||||||
| Population (April 1, 2010)[3] | ||||||||
| • Total | 1,781,642 | |||||||
| • Estimate (2015)[3] | 1,918,044 | |||||||
| • Density | 1,400/sq mi (530/km2) | |||||||
| Time zone | Pacific (UTC-8) | |||||||
| • Summer (DST) | Pacific Daylight Time (UTC-7) | |||||||
| Area codes | 408/669, 650 | |||||||
| FIPS code | 06-085 | |||||||
| GNIS feature ID | 277307 | |||||||
| Website |
www | |||||||

.jpg)
Santa Clara County, California, officially the County of Santa Clara, is a county in the U.S. state of California. As of the 2010 census, the population was 1,781,642.[3] The county seat is San Jose,[4] the tenth-most populous city in the United States.
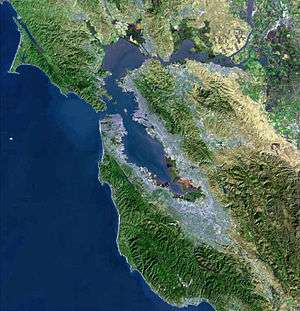
Santa Clara County is part of the San Jose-Sunnyvale-Santa Clara, CA Metropolitan Statistical Area as well as the San Jose-San Francisco-Oakland, CA Combined Statistical Area. Located at the southern end of the San Francisco Bay, the highly urbanized Santa Clara Valley within Santa Clara County is also known as Silicon Valley. Santa Clara is the most populous county in the San Francisco Bay Area region, and one of the most affluent counties in the United States.
Etymology

Santa Clara County is named after Mission Santa Clara, which was established in 1777, and is also named for Saint Clare of Assisi.
History
Santa Clara County was one of the original counties of California, formed in 1850 at the time of statehood. The original inhabitants included the Ohlone, residing on Coyote Creek and Calaveras Creek. Part of the county's territory was given to Alameda County in 1853.
In 1882, Santa Clara County tried to levy taxes upon property of the Southern Pacific Railroad within county boundaries. The result was the U.S. Supreme Court case of Santa Clara County v. Southern Pacific Railroad, 118 U.S. 394 (1886), in which the Court extended Due Process rights to artificial legal entities.
In the early 20th Century, the area was promoted as the "Valley of the Heart's Delight" due to its natural beauty, including a significant number of orchards.[5]
The first major technology company to be based in the area was Hewlett-Packard, founded in a garage in Palo Alto in 1939. IBM selected San Jose as its West Coast headquarters in 1943. Varian Associates, Fairchild Semiconductor, and other early innovators were located in the county by the late 1940s and 1950s. The U.S. Navy had a large presence in the area and began giving large contracts to Silicon Valley electronics companies. The term "Silicon Valley" was coined in 1971. The trend accelerated in the 1980s and 1990s, and agriculture has since then been nearly eliminated from the northern part of the county. Today, Santa Clara County is the headquarters for approximately 6500 high technology companies, including many of the largest tech companies in the world, among them hardware manufacturers AMD, Cisco Systems and Intel, computer and consumer electronics companies Apple Inc. and Hewlett-Packard, and internet companies eBay, Facebook, Google and Yahoo!. Most of what is considered to be Silicon Valley is located within the county, although some adjoining tech regions in San Mateo, Alameda, and Santa Cruz counties are also considered a part of Silicon Valley.
Geography
According to the U.S. Census Bureau, the county has a total area of 1,304 square miles (3,380 km2), of which 1,290 square miles (3,300 km2) is land and 14 square miles (36 km2) (1.1%) is water.[6]
The San Andreas Fault runs along the Santa Cruz Mountains in the south and west of the county.
National protected area
Ecology
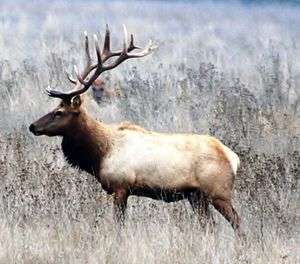
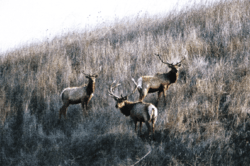
In 1978, California Department of Fish and Game warden Henry Coletto urged the department to choose the Mount Hamilton area as one of California's relocation sites under a new statewide effort to restore tule elk (Cervus canadensis ssp. nannodes). While other ranchers refused, tech pioneers Bill Hewlett and David Packard allowed Coletto and state biologists to translocate 32 tule elk from the Owens Valley in the eastern Sierra onto the 28,000-acre (11,000 ha) San Felipe Ranch, which the families jointly own, in the hills east of Morgan Hill.[7] From the three original 1978-1981 translocations to the Mount Hamilton region of the Diablo Range, there are multiple herds in different locations including the Isabel Valley, San Antonio Valley, Livermore area, San Felipe Ranch, Metcalf Canyon, Coyote Ridge, Anderson Lake, and surrounding areas. As of 2012, an estimated 400 tule elk roam 1,875 square kilometres (724 sq mi) in northeastern Santa Clara County and southeastern Alameda County.[8]
The Nature Conservancy "Mount Hamilton Project" has acquired or put under conservation easement 100,000 acres (40,000 ha) of land towards its 500,000 acres (200,000 ha) goal for habitat conservation within a 1,200,000 acres (490,000 ha) area encompassing much of eastern Santa Clara County as well as portions of southern Alameda County, western Merced and Stanislaus Counties, and northern San Benito County. Acquisitions to date include the 1,756-acre (711 ha) Rancho Cañada de Pala, straddling the Alameda Creek and Coyote Creek watersheds for California tiger salamander habitat; a conservation easement on the 3,259-acre Blue Oak Ranch Reserve, which abuts the north side of Joseph D. Grant County Park; a conservation easement on the 28,359-acre San Felipe Ranch, connecting Joseph D. Grant County Park with Henry W. Coe State Park; the 2,899-acre South Valley Ranch which protects a tule elk herd in the San Antonio Valley, and other properties.[9][10]
As of 1980, Santa Clara County has the highest number of Superfund Sites of any county in the United States, accounting for 25 polluted locations requiring a long-term response to clean up hazardous material contaminations.[11][12] The vast majority of these Superfund sites were caused by firms associated with the high tech sector located in Silicon Valley.[13]
Demographics
2011-2014

As of 2013, Santa Clara County has the highest median household income of any county in California at $84,741.[14]
| Population, race, and income | |||||
|---|---|---|---|---|---|
| Total population[15] | 1,762,754 | ||||
| White[15] | 896,937 | 50.9% | |||
| Black or African American[15] | 45,219 | 2.6% | |||
| American Indian or Alaska Native[15] | 9,906 | 0.6% | |||
| Asian[15] | 560,362 | 31.8% | |||
| Native Hawaiian or other Pacific Islander[15] | 6,445 | 0.4% | |||
| Some other race[15] | 171,082 | 9.7% | |||
| Two or more races[15] | 72,803 | 4.1% | |||
| Hispanic or Latino (of any race)[16] | 468,262 | 26.6% | |||
| Per capita income[17] | $40,698 | ||||
| Median household income[18] | $89,064 | ||||
| Median family income[19] | $103,255 | ||||
Places by population, race, and income
| Places by population and race | ||||||||
|---|---|---|---|---|---|---|---|---|
| Place | Type[20] | Population[15] | White[15] | Other[15] [note 1] |
Asian[15] | Black or African American[15] |
Native American[15] [note 2] |
Hispanic or Latino (of any race)[16] |
| Alum Rock | CDP | 11,814 | 60.5% | 25.7% | 11.3% | 2.0% | 0.5% | 73.0% |
| Burbank | CDP | 5,827 | 67.3% | 19.2% | 11.6% | 1.5% | 0.3% | 48.5% |
| Cambrian Park | CDP | 3,581 | 78.6% | 9.0% | 3.9% | 0.3% | 8.2% | 16.8% |
| Campbell | City | 39,108 | 68.7% | 12.0% | 16.9% | 1.4% | 0.9% | 16.8% |
| Cupertino | City | 57,459 | 34.6% | 3.9% | 60.7% | 0.4% | 0.4% | 4.3% |
| East Foothills | CDP | 6,983 | 67.3% | 17.4% | 13.4% | 1.9% | 0.1% | 31.4% |
| Fruitdale | CDP | 1,087 | 82.9% | 1.0% | 9.6% | 3.2% | 3.3% | 7.2% |
| Gilroy | City | 47,808 | 70.4% | 19.3% | 6.4% | 2.0% | 1.9% | 56.0% |
| Lexington Hills | CDP | 2,298 | 88.7% | 3.4% | 6.4% | 0.4% | 1.1% | 2.3% |
| Los Altos | City | 28,752 | 71.4% | 6.2% | 21.6% | 0.6% | 0.3% | 5.9% |
| Los Altos Hills | Town | 7,912 | 66.2% | 1.9% | 31.7% | 0.1% | 0.0% | 1.9% |
| Los Gatos | Town | 29,165 | 84.0% | 4.3% | 9.2% | 1.6% | 0.8% | 5.6% |
| Loyola | CDP | 3,747 | 74.0% | 3.9% | 20.9% | 0.0% | 1.2% | 2.3% |
| Milpitas | City | 66,038 | 21.8% | 14.6% | 59.0% | 3.5% | 1.1% | 17.1% |
| Monte Sereno | City | 3,338 | 80.0% | 3.5% | 14.3% | 2.2% | 0.0% | 6.1% |
| Morgan Hill | City | 37,278 | 69.2% | 15.9% | 11.5% | 2.4% | 1.0% | 34.9% |
| Mountain View | City | 73,394 | 58.8% | 12.8% | 25.1% | 2.6% | 0.8% | 21.0% |
| Palo Alto | City | 63,475 | 65.5% | 5.5% | 25.4% | 3.3% | 0.3% | 7.6% |
| San Jose | City | 939,688 | 47.6% | 16.2% | 32.1% | 3.0% | 1.0% | 33.0% |
| San Martin | CDP | 6,799 | 66.8% | 21.0% | 10.5% | 0.8% | 0.9% | 39.3% |
| Santa Clara | City | 114,482 | 46.0% | 12.0% | 38.2% | 2.5% | 1.3% | 19.4% |
| Saratoga | City | 29,781 | 51.8% | 3.6% | 44.0% | 0.5% | 0.1% | 3.0% |
| Stanford | CDP | 13,416 | 59.9% | 8.3% | 26.2% | 4.6% | 1.0% | 12.2% |
| Sunnyvale | City | 138,436 | 44.6% | 12.3% | 40.6% | 1.8% | 0.8% | 17.8% |
| Places by population and income | |||||
|---|---|---|---|---|---|
| Place | Type[20] | Population[21] | Per capita income[17] | Median household income[18] | Median family income[19] |
| Alum Rock | CDP | 11,814 | $19,409 | $62,884 | $63,098 |
| Burbank | CDP | 5,827 | $30,919 | $51,623 | $50,720 |
| Cambrian Park | CDP | 3,581 | $44,782 | $102,825 | $110,054 |
| Campbell | City | 39,108 | $44,354 | $82,687 | $97,703 |
| Cupertino | City | 57,459 | $51,965 | $124,825 | $146,601 |
| East Foothills | CDP | 6,983 | $41,571 | $105,050 | $111,250 |
| Fruitdale | CDP | 1,087 | $57,675 | $76,058 | $100,508 |
| Gilroy | City | 47,808 | $28,719 | $75,483 | $86,658 |
| Lexington Hills | CDP | 2,298 | $74,185 | $126,696 | $157,632 |
| Los Altos | City | 28,752 | $77,267 | $151,856 | $180,238 |
| Los Altos Hills | Town | 7,912 | $109,694 | $218,077 | $230,000 |
| Los Gatos | Town | 29,165 | $69,134 | $122,875 | $156,197 |
| Loyola | CDP | 3,747 | $87,773 | $190,724 | $189,583 |
| Milpitas | City | 66,038 | $32,465 | $94,589 | $100,768 |
| Monte Sereno | City | 3,338 | $94,727 | $181,719 | $245,417 |
| Morgan Hill | City | 37,278 | $39,433 | $94,301 | $106,659 |
| Mountain View | City | 73,394 | $51,635 | $91,446 | $110,657 |
| Palo Alto | City | 63,475 | $72,199 | $122,532 | $161,373 |
| San Jose | City | 939,688 | $33,770 | $80,764 | $89,500 |
| San Martin | CDP | 6,799 | $37,094 | $77,188 | $87,731 |
| Santa Clara | City | 114,482 | $39,523 | $89,004 | $105,100 |
| Saratoga | City | 29,781 | $71,223 | $155,182 | $183,776 |
| Stanford | CDP | 13,416 | $31,942 | $60,189 | $161,818 |
| Sunnyvale | City | 138,436 | $44,617 | $93,292 | $106,922 |
2010
| Historical population | |||
|---|---|---|---|
| Census | Pop. | %± | |
| 1860 | 11,912 | — | |
| 1870 | 26,246 | 120.3% | |
| 1880 | 35,039 | 33.5% | |
| 1890 | 48,005 | 37.0% | |
| 1900 | 60,216 | 25.4% | |
| 1910 | 83,539 | 38.7% | |
| 1920 | 100,676 | 20.5% | |
| 1930 | 145,118 | 44.1% | |
| 1940 | 174,949 | 20.6% | |
| 1950 | 290,547 | 66.1% | |
| 1960 | 642,315 | 121.1% | |
| 1970 | 1,064,714 | 65.8% | |
| 1980 | 1,295,071 | 21.6% | |
| 1990 | 1,497,577 | 15.6% | |
| 2000 | 1,682,585 | 12.4% | |
| 2010 | 1,781,642 | 5.9% | |
| Est. 2015 | 1,918,044 | [22] | 7.7% |
| U.S. Decennial Census[23] 1790–1960[24] 1900–1990[25] 1990–2000[26] 2010–2015[3] | |||
The 2010 United States Census reported that Santa Clara County had a population of 1,781,642. The ethnic makeup of Santa Clara County was 836,616 (47.0%) White, 46,428 (2.6%) African American, 12,960 (0.7%) Native American, 570,524 (32.0%) Asian (8.6% Chinese, 7.1% Vietnamese, 6.6% Indian, 4.9% Filipino, 1.6% Korean, 1.4% Japanese, 0.3% Cambodian, 0.3% Pakistani, 0.1% Thai, 0.1% Laotian, 0.1% Burmese, 0.1% Indonesian, 0.1% Bangladeshi), 7,060 (0.4%) Pacific Islander (0.1% Samoan, 0.1% Guamanian, 0.1% Tongan, 0.1% Native Hawaiian), 220,806 (12.4%) from other races, and 87,248 (4.9%) from two or more races. Hispanic or Latino of any race were 479,210 persons (26.9%): 22.5% Mexican, 0.4% Puerto Rican, 0.1% Cuban, 3.8% Other Hispanic.[27]
|
| Population reported at 2010 United States Census | |||||||||
|---|---|---|---|---|---|---|---|---|---|
Population | American | American | | Islander | races | more races | or Latino (of any race) | ||
| Santa Clara County | 1,781,642 | 836,616 | 46,428 | 12,960 | 570,524 | 7,060 | 220,806 | 87,248 | 479,210 |
cities and towns | Population | American | American | | Islander | races | more races | or Latino (of any race) | |
| Campbell | 39,349 | 26,315 | 1,158 | 275 | 6,320 | 161 | 2,713 | 2,407 | 7,247 |
| Cupertino | 58,302 | 18,270 | 344 | 117 | 36,895 | 54 | 670 | 1,952 | 2,113 |
| Gilroy | 48,821 | 28,674 | 942 | 831 | 3,448 | 111 | 12,322 | 2,493 | 28,214 |
| Los Altos | 28,976 | 20,459 | 148 | 48 | 6,815 | 59 | 195 | 1,252 | 1,132 |
| Los Altos Hills | 7,922 | 5,417 | 37 | 4 | 2,109 | 8 | 50 | 297 | 213 |
| Los Gatos | 29,413 | 24,060 | 269 | 86 | 3,203 | 52 | 462 | 1,281 | 2,120 |
| Milpitas | 66,790 | 13,725 | 1,969 | 309 | 41,536 | 346 | 5,811 | 3,094 | 11,240 |
| Monte Sereno | 3,341 | 2,698 | 14 | 12 | 464 | 0 | 28 | 125 | 162 |
| Morgan Hill | 37,882 | 24,713 | 746 | 335 | 3,852 | 125 | 5,779 | 2,332 | 12,863 |
| Mountain View | 74,066 | 41,468 | 1,629 | 344 | 19,232 | 391 | 7,241 | 3,761 | 16,071 |
| Palo Alto | 64,403 | 41,359 | 1,197 | 121 | 17,461 | 142 | 1,426 | 2,697 | 3,974 |
| San Jose | 945,942 | 404,437 | 30,242 | 8,297 | 303,138 | 4,017 | 148,749 | 47,062 | 313,636 |
| Santa Clara | 116,468 | 52,359 | 3,154 | 579 | 43,889 | 651 | 9,624 | 6,212 | 22,589 |
| Saratoga | 29,926 | 16,125 | 94 | 41 | 12,376 | 23 | 202 | 1,065 | 1,034 |
| Sunnyvale | 140,081 | 60,193 | 2,735 | 662 | 57,320 | 638 | 12,177 | 6,356 | 26,517 |
places | Population | American | American | | Islander | races | more races | or Latino (of any race) | |
| Alum Rock | 15,536 | 6,581 | 207 | 298 | 2,039 | 70 | 5,466 | 875 | 10,977 |
| Burbank | 4,926 | 2,994 | 135 | 64 | 379 | 16 | 1,049 | 289 | 2,509 |
| Cambrian Park | 3,282 | 2,598 | 26 | 29 | 221 | 19 | 190 | 199 | 591 |
| East Foothills | 8,269 | 4,853 | 205 | 78 | 1,445 | 41 | 1,219 | 428 | 3,118 |
| Fruitdale | 935 | 633 | 31 | 11 | 110 | 4 | 88 | 58 | 244 |
| Lexington Hills | 2,421 | 2,148 | 10 | 5 | 90 | 0 | 59 | 109 | 193 |
| Loyola | 3,261 | 2,291 | 19 | 1 | 760 | 2 | 37 | 151 | 114 |
| San Martin | 7,027 | 4,329 | 27 | 71 | 470 | 18 | 1,752 | 360 | 3,249 |
| Stanford | 13,809 | 7,932 | 651 | 86 | 3,777 | 28 | 263 | 1,072 | 1,439 |
communities | Population | American | American | | Islander | races | more races | or Latino (of any race) | |
| All others not CDPs (combined) | 30,494 | 21,985 | 439 | 256 | 3,175 | 84 | 3,234 | 1,321 | 7,651 |
2000
As of the census[29] of 2000, there are 1,682,585 people, 565,863 households, and 395,538 families residing in the county. The population density is 503/km² (1,304/mi²). There are 579,329 housing units at an average density of 173/km² (449/mi²). The ethnic makeup of the county is 53.8% White, 2.8% Black or African American, 0.7% Native American, 25.6% Asian, 0.3% Pacific Islander, 12.1% from other races, and 4.7% from two or more races. 24.0% of the population are Hispanic or Latino of any race.
There were 565,863 households out of which 34.9% had children under the age of 18 living with them, 54.9% were married couples living together, 10.0% had a female householder with no husband present, and 30.1% were non-families. 21.4% of all households were made up of individuals and 5.9% had someone living alone who was 65 years of age or older. The average household size was 2.92 and the average family size was 3.41.
In the county the population was spread out with 24.7% under the age of 18, 9.3% from 18 to 24, 35.4% from 25 to 44, 21.0% from 45 to 64, and 9.5% who were 65 years of age or older. The median age was 34 years. For every 100 females there were 102.80 males. For every 100 females age 18 and over, there were 101.90 males.
The median income for a household in the county was $74,335, and the median income for a family was $81,717. Males had a median income of $56,240 versus $40,574 for females. The per capita income for the county was $32,795. About 4.9% of families and 7.5% of the population were below the poverty line, including 8.4% of those under age 18 and 6.4% of those age 65 or over.
Government
Santa Clara County has five elected supervisors, elected within their districts.
The county is one among three counties in California (with Napa and Madera) to establish a separate department, the Santa Clara County Department of Corrections, to deal with corrections pursuant to California Government Code §23013.
The county also pays the $340,000 salary and benefits of the California state Department of Social Services director, which is reimbursed by the state, skirting the $165,000 state law cap for the position.[30]
In the United States House of Representatives, Santa Clara County is split between 4 congressional districts:[31]
- California's 17th congressional district, represented by Democrat Mike Honda,
- California's 18th congressional district, represented by Democrat Anna Eshoo,
- California's 19th congressional district, represented by Democrat Zoe Lofgren, and
- California's 20th congressional district, represented by Democrat Sam Farr.[32]
In the California State Senate, the county is split between 4 legislative districts:[33]
- the 10th Senate District, represented by Democrat Bob Wieckowski,
- the 13th Senate District, represented by Democrat Jerry Hill,
- the 15th Senate District, represented by Democrat Jim Beall, and
- the 17th Senate District, represented by Democrat Bill Monning.
In the California State Assembly, the county is split between 6 legislative districts:[34]
- the 24th Assembly District, represented by Democrat Marc Berman,
- the 25th Assembly District, represented by Democrat Kansen Chu,
- the 27th Assembly District, represented by Democrat Ash Kalra,
- the 28th Assembly District, represented by Democrat Evan Low,
- the 29th Assembly District, represented by Democrat Mark Stone, and
- the 30th Assembly District, represented by Democrat Anna Caballero.
Politics
| Year | GOP | DEM | Others |
|---|---|---|---|
| 2012 | 27.1% 174,843 | 70.0% 450,818 | 2.9% 18,616 |
| 2008 | 28.6% 190,039 | 69.4% 462,241 | 2.0% 13,309 |
| 2004 | 34.6% 209,094 | 63.9% 386,100 | 1.4% 8,622 |
| 2000 | 34.4% 188,750 | 60.7% 332,490 | 4.9% 26,889 |
| 1996 | 32.2% 168,291 | 56.9% 297,639 | 11.0% 57,361 |
| 1992 | 28.4% 170,870 | 49.2% 296,265 | 22.4% 134,920 |
| 1988 | 47.0% 254,442 | 51.3% 277,810 | 1.7% 9,276 |
| 1984 | 54.8% 288,638 | 43.7% 229,865 | 1.5% 8,136 |
| 1980 | 48.0% 229,048 | 35.0% 166,995 | 17.0% 80,960 |
| 1976 | 49.5% 219,188 | 46.9% 208,023 | 3.6% 15,927 |
| 1972 | 51.9% 237,334 | 45.6% 208,506 | 2.5% 11,453 |
| 1968 | 45.6% 163,446 | 48.4% 173,511 | 6.0% 21,410 |
| 1964 | 36.6% 117,420 | 63.1% 202,249 | 0.3% 858 |
| 1960 | 52.7% 131,735 | 47.1% 117,667 | 0.3% 690 |
| 1956 | 59.1% 105,657 | 40.6% 72,528 | 0.4% 633 |
| 1952 | 59.7% 91,940 | 39.7% 61,035 | 0.6% 932 |
| 1948 | 53.3% 52,982 | 42.1% 41,905 | 4.6% 4,615 |
| 1944 | 47.0% 39,409 | 52.4% 43,869 | 0.6% 499 |
| 1940 | 49.2% 40,100 | 49.6% 40,449 | 1.2% 947 |
| 1936 | 40.4% 26,498 | 58.5% 38,346 | 1.1% 732 |
| 1932 | 47.5% 27,353 | 49.1% 28,272 | 3.3% 1,906 |
| 1928 | 63.8% 31,710 | 35.4% 17,589 | 0.8% 395 |
| 1924 | 58.0% 20,056 | 7.4% 2,560 | 34.6% 11,952 |
| 1920 | 68.1% 19,565 | 22.6% 6,485 | 9.1% 2,682 |
| Year | GOP | DEM |
|---|---|---|
| 2014 | 27.1% 107,113 | 72.9% 288,732 |
| 2010 | 34.9% 178,695 | 61.3% 314,022 |
| 2006 | 52.2% 225,132 | 42.9% 185,037 |
| 2003 | 39.2% 160,807 | 39.9% 163,768 |
| 2002 | 32.4% 116,862 | 55.3% 199,399 |
| 1998 | 31.7% 133,015 | 64.3% 270,105 |
| 1994 | 47.5% 212,075 | 47.5% 211,904 |
| 1990 | 42.6% 178,310 | 52.2% 218,843 |
| 1986 | 59.9% 227,285 | 37.6% 142,907 |
| 1982 | 44.0% 180,232 | 52.9% 216,781 |
| 1978 | 29.8% 110,444 | 61.4% 227,493 |
| 1974 | 46.7% 153,761 | 50.6% 166,760 |
| 1970 | 51.5% 172,562 | 46.1% 154,570 |
| 1966 | 55.4% 164,970 | 44.6% 132,793 |
| 1962 | 47.6% 112,700 | 51.2% 121,149 |
Since 1992, Santa Clara County has been a strongly Democratic county in presidential and congressional elections. The last Republican to win a majority in the county was Ronald Reagan in 1984. It was a bellwether county for much of the twentieth century. However, like the rest of the Bay Area, it swung heavily to the Democrats in the 1990s nationally. While Republicans remained competitive at the state and local level for the rest of the 1990s, there are currently no elected Republicans representing significant parts of the county above the county level.
As of November 2012, all of the cities, towns, and the unincorporated areas of Santa Clara County have more registered Democrats than Republicans.[35] In the 2008 US Presidential Election, Democratic nominee Barack Obama carried every city and town in the county, as well as the unincorporated areas.[36]
Following the passage of Proposition 8, Santa Clara County joined San Francisco and Los Angeles in a lawsuit, becoming, along with San Francisco and Los Angeles, the first governmental entities in the world to sue for same-sex marriage.[37]
Voter registration
| Population and registered voters | ||
|---|---|---|
| Total population[15] | 1,762,754 | |
| Registered voters[38][note 3] | 817,310 | 46.4% |
| Democratic[38] | 372,979 | 45.6% |
| Republican[38] | 177,268 | 21.7% |
| Democratic–Republican spread[38] | +195,711 | +23.9% |
| Independent[38] | 17,009 | 2.1% |
| Green[38] | 4,326 | 0.5% |
| Libertarian[38] | 4,843 | 0.6% |
| Peace and Freedom[38] | 1,950 | 0.2% |
| Americans Elect[38] | 36 | 0.0% |
| Other[38] | 1,542 | 0.2% |
| No party preference[38] | 237,357 | 29.0% |
Cities by population and voter registration
| Cities by population and voter registration | |||||||
|---|---|---|---|---|---|---|---|
| City | Population[15] | Registered voters[38] [note 3] |
Democratic[38] | Republican[38] | D–R spread[38] | Other[38] | No party preference[38] |
| Campbell | 39,108 | 53.4% | 45.3% | 23.8% | +21.5% | 7.3% | 26.2% |
| Cupertino | 57,459 | 48.2% | 37.0% | 20.0% | +17.0% | 4.0% | 40.4% |
| Gilroy | 47,808 | 42.7% | 48.5% | 25.2% | +23.3% | 6.8% | 22.1% |
| Los Altos | 28,752 | 67.4% | 41.5% | 29.4% | +12.1% | 4.3% | 26.2% |
| Los Altos Hills | 7,912 | 73.6% | 34.9% | 33.6% | +1.3% | 4.3% | 28.7% |
| Los Gatos | 29,165 | 65.0% | 41.0% | 31.5% | +9.5% | 6.2% | 23.7% |
| Milpitas | 66,038 | 40.4% | 42.5% | 19.2% | +23.3% | 5.3% | 35.0% |
| Monte Sereno | 3,338 | 73.7% | 37.1% | 36.9% | +0.2% | 6.1% | 22.3% |
| Morgan Hill | 37,278 | 52.6% | 40.9% | 32.0% | +8.9% | 6.9% | 23.0% |
| Mountain View | 73,394 | 46.0% | 49.1% | 16.4% | +32.7% | 5.3% | 30.8% |
| Palo Alto | 63,475 | 59.7% | 52.6% | 15.5% | +37.1% | 3.8% | 29.2% |
| San Jose | 939,688 | 44.6% | 46.8% | 20.6% | +26.2% | 6.0% | 28.8% |
| Santa Clara | 114,482 | 41.9% | 46.5% | 19.9% | +26.6% | 6.1% | 29.7% |
| Saratoga | 29,781 | 66.8% | 34.2% | 31.5% | +2.7% | 3.9% | 31.8% |
| Sunnyvale | 138,436 | 41.1% | 45.0% | 19.9% | +25.1% | 5.0% | 31.8% |
Crime
The following table includes the number of incidents reported and the rate per 1,000 persons for each type of offense.
| Population and crime rates | ||
|---|---|---|
| Population[15] | 1,762,754 | |
| Violent crime[39] | 5,013 | 2.84 |
| Homicide[39] | 46 | 0.03 |
| Forcible rape[39] | 387 | 0.22 |
| Robbery[39] | 1,499 | 0.85 |
| Aggravated assault[39] | 3,081 | 1.75 |
| Property crime[39] | 23,790 | 13.50 |
| Burglary[39] | 7,094 | 4.02 |
| Larceny-theft[39][note 4] | 28,303 | 16.06 |
| Motor vehicle theft[39] | 7,356 | 4.17 |
| Arson[39] | 403 | 0.23 |
Cities by population and crime rates
| Cities by population and crime rates | ||||||||
|---|---|---|---|---|---|---|---|---|
| City | Population[40] | Violent crimes[40] | Violent crime rate per 1,000 persons |
Property crimes[40] | Property crime rate per 1,000 persons | |||
| Campbell | 41,339 | 90 | 2.23 | 1,649 | 40.88 | |||
| Cupertino | 59,769 | 58 | 0.97 | 797 | 13.33 | |||
| Gilroy | 50,042 | 159 | 3.18 | 1,788 | 35.73 | |||
| Los Altos | 29,704 | 6 | 0.20 | 299 | 10.07 | |||
| Los Altos Hills | 8,121 | 5 | 0.62 | 45 | 5.54 | |||
| Los Gatos | 30,161 | 38 | 1.26 | 629 | 20.85 | |||
| Milpitas | 68,433 | 81 | 1.18 | 2,023 | 29.56 | |||
| Monte Sereno | 3,426 | 3 | 0.88 | 35 | 10.22 | |||
| Morgan Hill | 38,834 | 50 | 1.29 | 695 | 17.90 | |||
| Mountain View | 75,933 | 155 | 2.04 | 1,419 | 18.69 | |||
| Palo Alto | 66,019 | 53 | 0.80 | 1,409 | 21.34 | |||
| San Jose | 976,459 | 3,547 | 3.63 | 28,463 | 29.15 | |||
| Santa Clara | 119,360 | 221 | 1.85 | 3,306 | 27.70 | |||
| Saratoga | 30,683 | 9 | 0.29 | 231 | 7.53 | |||
| Sunnyvale | 143,606 | 170 | 1.18 | 2,555 | 17.79 | |||
Economy
The county's economy is heavily service based. Technology, both hardware and software, dominates the service sector by value, but like any other county, Santa Clara has its share of retail and office support workers.
The San Jose/Sunnyvale/Santa Clara metropolitan region, comprising Santa Clara County and San Benito County, was ranked as the highest performing metropolitan area in the US in 2012, ahead of Austin, Texas and Raleigh, North Carolina, according to the Milken Institute.[41] The GDP of the metro area reached $176.7 billion in 2011, or $94,587 per capita,[42] roughly on par with Qatar in both total GDP and per capita (nominal).[43] GDP grew a strong 7.7% in 2011, and in contrast with most of California, GDP and per capita GDP (nominal) is well above 2007 (financial crisis) levels. Despite relative wealth vis a vis other regions nationally, a large underclass exists whose income is roughly equivalent to that elsewhere in the country, despite extreme land prices. The surge in metro GDP is highly correlated with home prices, which for average single-family homes passed $1 million ($1,017,528) in August 2013.[44]
Libraries
Santa Clara County Library, is a public library system serving the communities and cities of Campbell, Cupertino, Gilroy, Los Altos, Los Altos Hills, Milpitas, Monte Sereno, Morgan Hill, Saratoga, and all unincorporated areas of the county.[45] All other cities run their own library system.
Transportation
Air

The county's main airport is Norman Y. Mineta San José International Airport (SJC). It is a U.S. Customs and Border Protection port of entry[46] and as of 2015 has four international routes (one to Japan, two to Mexico, and one to China) but the airport's busiest routes are all to cities in the western United States. San Francisco International Airport (SFO) is also often used for commercial services by residents of Santa Clara County.
Moffett Federal Airfield (NUQ), a former U.S. Naval Air Station, is used by the Air National Guard, NASA, Lockheed Martin, Google, and by the San Jose Police and Santa Clara County Sheriff's Department as an air operations base.[47] There are also smaller general aviation airports in Palo Alto (PAO), San Jose (Reid-Hillview) (RHV), and San Martin(E16)
Rail

Santa Clara Station is served by Caltrain which provides service to Gilroy, San Jose, Silicon Valley, San Francisco Airport and San Francisco, the ACE system which provides services to Stockton, and Amtrak which provides service to Sacramento and Oakland. In the Future, BART will provide service to San Jose and Santa Clara.
The Santa Clara Valley Transportation Authority operates the VTA light rail system.
Road

Buses
Santa Clara County has consolidated its transportation services into the Santa Clara Valley Transportation Authority, which operates a bus system.
Bicycle network
The Santa Clara Valley Transportation Authority is establishing a bicycle network throughout the county. Santa Clara County Bicycle network is part of the San Francisco Bay Area Regional Bikeway Network.
- Bikeways Map (Effective April 2011)
- Regional Bicycle Plan for the San Francisco Bay Area 2009 Update
Freeways and expressways
The county has an extensive freeway system and a separate expressway system. Expressways in California are distinct from freeways; although access to adjoining properties is eliminated, at-grade intersections are allowed. However, unlike expressways virtually everywhere else in California, the Santa Clara County expressways were built, signed, and maintained as county roads; they are not maintained by Caltrans, although they are patrolled by the California Highway Patrol.
There is also a large street network dominated by four- and six-lane arterials. Some of the newer boulevards (primarily in the West Valley) are divided with landscaped medians.
Major highways
County routes
|
|
Other roads
Sea
The county has no commercial seaports, although small boats can access San Francisco Bay from several points. Like many other Bay Area counties, it is dependent upon the Port of Oakland for transport of ocean cargo.
Parks
Santa Clara County has an extensive park system, much of it founded in the major park expansion of the late 1970s. Parks within the county include:
Open space preserves include:
Santa Clara County also contains Ulistac Natural Area, a volunteer maintained natural open space. Foreign and invasive species are removed when possible as native plants are introduced. Migratory birds and butterfly's often use this area.
Sister counties
To promote friendship and understanding and to build bridges with countries of origin for various ethnic populations in the county, the County of Santa Clara has created a Sister County Commission to coordinate the program. As of 2009, there are three sister counties:[48]
Communities
Cities
Towns
Census-designated places
- Alum Rock
- Burbank
- Cambrian Park
- East Foothills
- Fruitdale
- Lexington Hills
- Llagas-Uvas
- Loyola also known as Loyola Corners
- San Martin
- Stanford
Unincorporated communities
- Bell Station, also known as Bell's Station and Hollenbeck's Station
- Casa Loma, also known as Loma Chiquita
- Chemeketa Park
- Coyote, also known as Burnett c. 1860–1882
- East San Jose
- Madrone, now part of Morgan Hill
- Redwood Estates
- Rucker
- San Antonio, also known as Deforest c. 1892–1924
- Sveadal
Former townships
- Almaden Township: Present-day Almaden Valley, Cambrian Park and portions of Campbell and Los Gatos.
- Alviso Township: Present-day Alviso.
- Burnett Township: Present-day Coyote, Santa Teresa and Morgan Hill.
- Fremont Township: Present-day Palo Alto, Sunnyvale, Mountain View, Los Altos, Los Altos Hills and part of Cupertino.
- Gilroy Township: Present-day Gilroy and San Martin.
- Milpitas Township: Present-day Milpitas.
- Redwood Township: Present-day Los Gatos, Monte Sereno, Saratoga, Redwood Estates and portions of Cupertino and Campbell.
- San Jose Township: Most of present-day San Jose.
- Santa Clara Township: Present-day Santa Clara and portions of San Jose, Cupertino and Campbell.
Population ranking
The population ranking of the following table is based on the 2010 census of Santa Clara County.[49]
† county seat
| Rank | City/Town/etc. | Municipal type | Population (2010 Census)
|
|---|---|---|---|
| 1 | † San Jose | City | 945,942 |
| 2 | Sunnyvale | City | 140,081 |
| 3 | Santa Clara | City | 116,468 |
| 4 | Mountain View | City | 74,066 |
| 5 | Milpitas | City | 66,790 |
| 6 | Palo Alto | City | 64,403 |
| 7 | Cupertino | City | 58,302 |
| 8 | Gilroy | City | 48,821 |
| 9 | Campbell | City | 39,349 |
| 10 | Morgan Hill | City | 37,882 |
| 11 | Saratoga | City | 29,926 |
| 12 | Los Gatos | Town | 29,413 |
| 13 | Los Altos | City | 28,976 |
| 14 | Alum Rock | CDP | 15,536 |
| 15 | Stanford | CDP | 13,809 |
| 16 | East Foothills | CDP | 8,269 |
| 17 | Los Altos Hills | Town | 7,922 |
| 18 | San Martin | CDP | 7,027 |
| 19 | Burbank | CDP | 4,926 |
| 20 | Monte Sereno | City | 3,341 |
| 21 | Cambrian Park | CDP | 3,282 |
| 22 | Loyola | CDP | 3,261 |
| 23 | Lexington Hills | CDP | 2,421 |
| 24 | Fruitdale | CDP | 935 |
See also
- Committee for Green Foothills
- List of attractions in Silicon Valley
- List of school districts in Santa Clara County, California
- National Register of Historic Places listings in Santa Clara County, California
- Old Almaden Winery
- Santa Clara County expressway system
- Santa Clara Valley
Notes
- ↑ Other = Some other race + Two or more races
- ↑ Native American = Native Hawaiian or other Pacific Islander + American Indian or Alaska Native
- 1 2 Percentage of registered voters with respect to total population. Percentages of party members with respect to registered voters follow.
- ↑ Only larceny-theft cases involving property over $400 in value are reported as property crimes.
References
- ↑ "Chronology". California State Association of Counties. Retrieved February 6, 2015.
- ↑ "Mount Hamilton". Peakbagger.com. Retrieved May 13, 2015.
- 1 2 3 4 "State & County QuickFacts". United States Census Bureau. Retrieved Mar 25, 2016.
- ↑ "Find a County". National Association of Counties. Retrieved June 7, 2011.
- ↑ Automobiles: Good Roads. Sunset. 32. 1914. p. 918.
- ↑ "2010 Census Gazetteer Files". United States Census Bureau. August 22, 2012. Retrieved October 4, 2015.
- ↑ "Restoration of tule elk - California success story". Billings Gazette. December 6, 2006. Retrieved January 27, 2013.
- ↑ Julie Phillips; Ryan Phillips; Neela Srinivasan; Deborah Aso; Wendy Lao & Pat Cornely (2012). Safe Passage for the Coyote Valley - A Wildlife Linkage for the Highway 101 Corridor (PDF) (Report). De Anza College. Retrieved January 27, 2013.
- ↑ "California: Mount Hamilton". The Nature Conservancy. Retrieved January 27, 2013.
- ↑ Draft Environmental Impact Report and Environmental Impact Statement for the Santa Clara Valley Habitat Plan (PDF) (Report). County of Santa Clara, City of San José, City of Morgan Hill, City of Gilroy, Santa Clara Valley Water District, Santa Clara Valley Transportation Authority. 2010-12. Retrieved January 27, 2013. Check date values in:
|date=(help) - ↑ P.L. 96-510, 42 U.S.C. §§ 9601–9675, December 11, 1980.
- ↑ "US Superfund Sites". Environmental Protection Agency. Retrieved August 7, 2013.
- ↑ "EPA Region 9 Superfund Site Overview". Environmental Protection Agency. Retrieved August 13, 2013.
- ↑ "Median household income". County Health Rankings. Retrieved 2016-03-15.
- 1 2 3 4 5 6 7 8 9 10 11 12 13 14 15 16 17 U.S. Census Bureau. American Community Survey, 2011 American Community Survey 5-Year Estimates, Table B02001. American FactFinder. Retrieved October 26, 2013.
- 1 2 U.S. Census Bureau. American Community Survey, 2011 American Community Survey 5-Year Estimates, Table B03003. American FactFinder. Retrieved October 26, 2013.
- 1 2 U.S. Census Bureau. American Community Survey, 2011 American Community Survey 5-Year Estimates, Table B19301. American FactFinder. Retrieved October 21, 2013.
- 1 2 U.S. Census Bureau. American Community Survey, 2011 American Community Survey 5-Year Estimates, Table B19013. American FactFinder. Retrieved October 21, 2013.
- 1 2 U.S. Census Bureau. American Community Survey, 2011 American Community Survey 5-Year Estimates, Table B19113. American FactFinder. Retrieved October 21, 2013.
- 1 2 U.S. Census Bureau. American Community Survey, 2011 American Community Survey 5-Year Estimates. American FactFinder. Retrieved October 21, 2013.
- ↑ U.S. Census Bureau. American Community Survey, 2011 American Community Survey 5-Year Estimates, Table B01003. American FactFinder. Retrieved October 21, 2013.
- ↑ "County Totals Dataset: Population, Population Change and Estimated Components of Population Change: April 1, 2010 to July 1, 2015". Retrieved July 2, 2016.
- ↑ "U.S. Decennial Census". United States Census Bureau. Retrieved October 4, 2015.
- ↑ "Historical Census Browser". University of Virginia Library. Retrieved October 4, 2015.
- ↑ Forstall, Richard L., ed. (March 27, 1995). "Population of Counties by Decennial Census: 1900 to 1990". United States Census Bureau. Retrieved October 4, 2015.
- ↑ "Census 2000 PHC-T-4. Ranking Tables for Counties: 1990 and 2000" (PDF). United States Census Bureau. April 2, 2001. Retrieved October 4, 2015.
- ↑ "2010 Census P.L. 94-171 Summary File Data". United States Census Bureau.
- ↑ http://www.bayareacensus.ca.gov "Demographic Profile Bay Area Census" Check
|url=value (help). - ↑ "American FactFinder". United States Census Bureau. Retrieved May 14, 2011.
- ↑ Goldmacher, Shane (May 14, 2011). "California's social services chief wins lucrative pay deal". Los Angeles Times.
- ↑ "Counties by County and by District". California Citizens Redistricting Commission. Retrieved September 24, 2014.
- ↑ "California's 20th Congressional District - Representatives & District Map". Civic Impulse, LLC. Retrieved March 12, 2013.
- ↑ "Communities of Interest - Counties". California Citizens Redistricting Commission. Retrieved September 24, 2014.
- ↑ "Communities of Interest - Counties". California Citizens Redistricting Commission. Retrieved September 24, 2014.
- ↑ http://www.sos.ca.gov/elections/ror/ror-pages/15day-general-12/politicalsub1.pdf
- ↑ Archived June 12, 2009, at the Wayback Machine.
- ↑ "Herrera Joined by Los Angeles, Santa Clara Counterparts in Suing to Invalidate Prop 8" (PDF). Office of the City Attorney of San Francisco. November 5, 2008. Retrieved December 20, 2008.
- 1 2 3 4 5 6 7 8 9 10 11 12 13 14 15 16 17 California Secretary of State. February 10, 2013 - Report of Registration. Retrieved October 31, 2013.
- 1 2 3 4 5 6 7 8 9 10 Office of the Attorney General, Department of Justice, State of California. Table 11: Crimes – 2009. Retrieved November 14, 2013.
- 1 2 3 United States Department of Justice, Federal Bureau of Investigation. Crime in the United States, 2012, Table 8 (California). Retrieved November 14, 2013.
- ↑ "Santa Clara County economy ranked best performing", San Jose Mercury News, January 17, 2013
- ↑ http://bea.gov/newsreleases/regional/gdp_metro/2013/pdf/gdp_metro0213.pdf
- ↑ http://unstats.un.org/unsd/snaama/dnltransfer.asp?fID=2
- ↑ http://www.heraldonline.com/2013/09/09/5191927/home-prices-in-santa-clara-county.html
- ↑ "Contact Us." Santa Clara County Library. Retrieved on March 27, 2010.
- ↑ Port Of Entry - San Jose International Airport. Cbp.gov (September 28, 2005). Retrieved on 2013-07-21.
- ↑ Verne Kopytoff (September 13, 2007). "Google founders pay NASA $1.3 million to land at Moffett Airfield". San Francisco Chronicle. Retrieved September 23, 2007.
- ↑ "Sister County Commissions (PRG)". The County of Santa Clara. Retrieved January 7, 2010.
- ↑ http://www.census.gov/2010census/
External links
- Official website
- Santa Clara Valley Water District - Drinking Water
- List of special districts in Santa Clara County (LAFCo)
- Santa Clara County Library
- Santa Clara County: California's Historic Silicon Valley, a National Park Service Discover Our Shared Heritage Travel Itinerary
 |
San Mateo County | Alameda County | | |
| |
Stanislaus County | |||
| ||||
| | ||||
| Santa Cruz County | San Benito County and Santa Cruz County | Merced County |
Municipalities and communities of Santa Clara County, California, United States | ||
|---|---|---|
| Cities and towns | | |
| CDPs | ||
| Unincorporated communities | ||
| CCDs | ||
| Ghost towns | ||
| Bodies of water |
|  |
|---|---|---|
| Counties | ||
| Major cities | ||
| Cities and towns 100k–250k | ||
| Cities and towns 50k–99k | ||
| Cities and towns 25k-50k | ||
| Cities and towns 10k–25k |
| |
| Sub-regions | ||