Solano County, California
| Solano County, California | |||||||
|---|---|---|---|---|---|---|---|
| County | |||||||
| County of Solano | |||||||
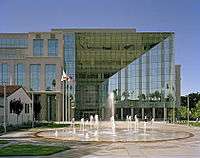
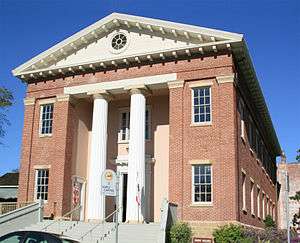
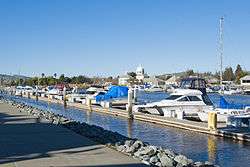
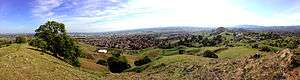
Images, from top down, left to right: The Solano County Government Center in Downtown Fairfield, Benicia Capitol State Historic Park, Suisun City Marina, Military C-5 Aircraft takes off from Travis Air Force Base, Vacaville Hills | |||||||
| |||||||
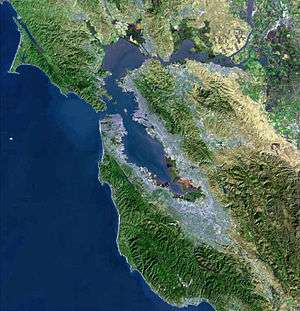
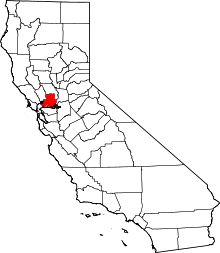 Location in the state of California | |||||||
 California's location in the United States | |||||||
| Country |
| ||||||
| State |
| ||||||
| Region | San Francisco Bay Area | ||||||
| Incorporated | February 18, 1850[1] | ||||||
| County seat | Fairfield | ||||||
| Largest city |
Vallejo (population) Fairfield (area) | ||||||
| Area | |||||||
| • Total | 906 sq mi (2,350 km2) | ||||||
| • Land | 822 sq mi (2,130 km2) | ||||||
| • Water | 84 sq mi (220 km2) | ||||||
| Highest elevation[2] | 2,822 ft (860 m) | ||||||
| Population (April 1, 2010)[3] | |||||||
| • Total | 413,344 | ||||||
| • Estimate (2015)[3] | 436,092 | ||||||
| • Density | 460/sq mi (180/km2) | ||||||
| Time zone | Pacific Time Zone (UTC-8) | ||||||
| • Summer (DST) | Pacific Daylight Time (UTC-7) | ||||||
| Area code | 707 | ||||||
| FIPS code | 06-095 | ||||||
| GNIS feature ID | 277312 | ||||||
| Website |
www | ||||||

Solano County is a county located in the U.S. state of California. As of the 2010 census, the population was 413,344.[3] The county seat is Fairfield.[4]
Solano County comprises the Vallejo-Fairfield, CA Metropolitan Statistical Area, which is also included in the San Jose-San Francisco-Oakland, CA Combined Statistical Area.[5] Solano County is the northeastern county in the nine-county San Francisco Bay Area region.
A portion of the South Campus at the University of California, Davis is in Solano County.
History
Solano County was one of the original counties of California, created in 1850 at the time of statehood.
At the request of General Mariano Guadalupe Vallejo, the county derives its name directly from an Indian Chief, Chief Solano of the Suisun people, a Native American tribe of the region and Vallejo's close ally. Chief Solano at one time led the tribes between the Petaluma River and the Sacramento River. The chief was also called Sem-Yeto, which signifies "brave or fierce hand." The Chief was given the Spanish name Francisco Solano during baptism at the Catholic Mission, and is named after the Spanish Franciscan missionary, Father Francisco Solano. "Solano" is a common surname in the north of Spain, especially in Navarra, Zaragoza and La Rioja.
Travis Air Force Base is located just east of Fairfield.
Region
Solano County is the easternmost county of the North Bay.[5] As such, it is sometimes reported by news agencies as being in the East Bay.[6][7][8] Additionally, a portion of the county extends into the Sacramento Valley, geographically.
Geography
According to the U.S. Census Bureau, the county has a total area of 906 square miles (2,350 km2), of which 822 square miles (2,130 km2) is land and 84 square miles (220 km2) (9.3%) is water.[9]
Solano County has several inactive cinnabar mines including the Hastings Mine and St. John's Mine,[10] both of which are subject to ongoing environmental monitoring; these mines were worked in the first half of the twentieth century.
Fauna
Solano County has a number of rare and endangered species including the beetle Elaphrus viridis, the wildflower Lasthenia conjugens, commonly known as Contra Costa goldfields and the annual plant Legenere limosa or False Venus' looking glass.
Adjacent counties
- Contra Costa County, California - south
- Sonoma County, California - west
- Napa County, California - west
- Yolo County, California - north
- Sacramento County, California - east
National protected area
Transportation
Major highways
Public transportation
Solano County is served by several transit agencies:
- SolTrans, formed as a merger between these two existing transit agencies:
- Vallejo Transit, which used to also operate the Baylink Ferry to San Francisco
- Benicia Breeze
- San Francisco Bay Ferry, with a terminal in Vallejo
- Fairfield and Suisun Transit
- Vacaville City Coach
- Rio Vista Delta Breeze
Each agency interconnects with each other, enabling transit trips throughout the county. Service also connects with BART stations in Contra Costa County. Transit links are provided to Napa, Yolo and Sacramento counties as well.
Greyhound and Amtrak provide long-distance intercity service.
Airports
General aviation airports in Solano County which are open to the public are the Nut Tree Airport and Rio Vista Municipal Airport.
Crime
The following table includes the number of incidents reported and the rate per 1,000 persons for each type of offense.
| Population and crime rates | ||
|---|---|---|
| Population[11] | 411,620 | |
| Violent crime[12] | 2,064 | 5.01 |
| Homicide[12] | 20 | 0.05 |
| Forcible rape[12] | 112 | 0.27 |
| Robbery[12] | 810 | 1.97 |
| Aggravated assault[12] | 1,122 | 2.73 |
| Property crime[12] | 8,460 | 20.55 |
| Burglary[12] | 4,168 | 10.13 |
| Larceny-theft[12][note 1] | 7,018 | 17.05 |
| Motor vehicle theft[12] | 2,084 | 5.06 |
| Arson[12] | 116 | 0.28 |
Cities by population and crime rates
| Cities by population and crime rates | ||||||||
|---|---|---|---|---|---|---|---|---|
| City | Population[13] | Violent crimes[13] | Violent crime rate per 1,000 persons |
Property crimes[13] | Property crime rate per 1,000 persons | |||
| Benicia | 27,459 | 37 | 1.35 | 390 | 14.20 | |||
| Dixon | 18,708 | 53 | 2.83 | 315 | 16.84 | |||
| Fairfield | 107,110 | 454 | 4.24 | 3,317 | 30.97 | |||
| Rio Vista | 7,485 | 39 | 5.21 | 145 | 19.37 | |||
| Suisun City | 28,593 | 57 | 1.99 | 558 | 19.52 | |||
| Vacaville | 93,951 | 246 | 2.62 | 2,031 | 21.62 | |||
| Vallejo | 117,912 | 878 | 7.45 | 5,844 | 49.56 | |||
Demographics
2011
| Population, race, and income | |||||
|---|---|---|---|---|---|
| Total population[11] | 411,620 | ||||
| White[11] | 214,436 | 52.1% | |||
| Black or African American[11] | 60,130 | 14.6% | |||
| American Indian or Alaska Native[11] | 2,427 | 0.6% | |||
| Asian[11] | 59,143 | 14.4% | |||
| Native Hawaiian or other Pacific Islander[11] | 3,390 | 0.8% | |||
| Some other race[11] | 43,064 | 10.5% | |||
| Two or more races[11] | 29,030 | 7.1% | |||
| Hispanic or Latino (of any race)[14] | 97,268 | 23.6% | |||
| Per capita income[15] | $29,367 | ||||
| Median household income[16] | $69,914 | ||||
| Median family income[17] | $79,316 | ||||
Places by population, race, and income
| Places by population and race | ||||||||
|---|---|---|---|---|---|---|---|---|
| Place | Type[18] | Population[11] | White[11] | Other[11] [note 2] |
Asian[11] | Black or African American[11] |
Native American[11] [note 3] |
Hispanic or Latino (of any race)[14] |
| Allendale | CDP | 1,968 | 86.1% | 10.7% | 3.2% | 0.0% | 0.0% | 14.7% |
| Benicia | City | 26,981 | 75.6% | 10.4% | 9.3% | 3.1% | 1.7% | 12.2% |
| Dixon | City | 18,141 | 74.9% | 17.0% | 3.8% | 3.0% | 1.3% | 39.4% |
| Elmira | CDP | 251 | 97.2% | 2.8% | 0.0% | 0.0% | 0.0% | 2.8% |
| Fairfield | City | 104,404 | 47.1% | 19.4% | 15.5% | 16.6% | 1.5% | 25.7% |
| Green Valley | CDP | 1,719 | 85.7% | 8.7% | 2.4% | 3.1% | 0.0% | 8.0% |
| Hartley | CDP | 2,229 | 85.3% | 4.4% | 1.7% | 7.3% | 1.3% | 12.7% |
| Rio Vista | City | 7,088 | 76.5% | 10.0% | 4.0% | 7.9% | 1.5% | 14.9% |
| Suisun City | City | 27,900 | 34.4% | 24.9% | 19.9% | 19.7% | 1.1% | 25.6% |
| Vacaville | City | 92,217 | 64.8% | 17.0% | 5.9% | 11.1% | 1.2% | 21.7% |
| Vallejo | City | 116,021 | 36.2% | 17.2% | 23.9% | 21.0% | 1.6% | 23.3% |
| Places by population and income | |||||
|---|---|---|---|---|---|
| Place | Type[18] | Population[19] | Per capita income[15] | Median household income[16] | Median family income[17] |
| Allendale | CDP | 1,968 | $41,928 | $112,837 | $119,063 |
| Benicia | City | 26,981 | $41,854 | $90,338 | $102,571 |
| Dixon | City | 18,141 | $27,624 | $72,626 | $76,038 |
| Elmira | CDP | 251 | $22,069 | $73,438 | $85,650 |
| Fairfield | City | 104,404 | $26,785 | $68,037 | $75,717 |
| Green Valley (Solano County) | CDP | 1,719 | $67,828 | $125,669 | $145,781 |
| Hartley | CDP | 2,229 | $41,041 | $87,841 | $106,786 |
| Rio Vista | City | 7,088 | $34,332 | $58,701 | $68,156 |
| Suisun City | City | 27,900 | $26,148 | $71,411 | $76,286 |
| Vacaville | City | 92,217 | $29,687 | $73,302 | $85,790 |
| Vallejo | City | 116,021 | $27,375 | $62,325 | $72,717 |
2010
| Historical population | |||
|---|---|---|---|
| Census | Pop. | %± | |
| 1850 | 580 | — | |
| 1860 | 7,169 | 1,136.0% | |
| 1870 | 16,871 | 135.3% | |
| 1880 | 18,475 | 9.5% | |
| 1890 | 20,946 | 13.4% | |
| 1900 | 24,143 | 15.3% | |
| 1910 | 27,559 | 14.1% | |
| 1920 | 40,602 | 47.3% | |
| 1930 | 40,834 | 0.6% | |
| 1940 | 49,118 | 20.3% | |
| 1950 | 104,833 | 113.4% | |
| 1960 | 134,597 | 28.4% | |
| 1970 | 169,941 | 26.3% | |
| 1980 | 235,203 | 38.4% | |
| 1990 | 340,421 | 44.7% | |
| 2000 | 394,542 | 15.9% | |
| 2010 | 413,344 | 4.8% | |
| Est. 2015 | 436,092 | [20] | 5.5% |
| U.S. Decennial Census[21] 1790-1960[22] 1900-1990[23] 1990-2000[24] 2010-2015[3] | |||
The 2010 United States Census reported that Solano County had a population of 413,344. The racial makeup of Solano County was 210,751 (51.0%) White, 60,750 (14.7%) African American, 3,212 (0.8%) Native American, 60,473 (14.6%) Asian, 3,564 (0.9%) Pacific Islander, 43,236 (10.5%) from other races, and 31,358 (7.6%) from two or more races. Hispanic or Latino of any race were 99,356 persons (24.0%).[25] At 52,641 Filipinos in the County making up 12% of the population, Solano County has the largest percentage Filipino population of any County in all of the United States.
| Population reported at 2010 United States Census | |||||||||
|---|---|---|---|---|---|---|---|---|---|
Population | American | American | | Islander | races | more races | or Latino (of any race) | ||
| Solano County | 413,344 | 210,751 | 60,750 | 3,212 | 60,473 | 3,564 | 43,236 | 31,358 | 99,356 |
cities and towns | Population | American | American | | Islander | races | more races | or Latino (of any race) | |
| Benicia | 26,997 | 19,568 | 1,510 | 135 | 2,989 | 102 | 895 | 1,798 | 3,248 |
| Dixon | 18,351 | 13,023 | 562 | 184 | 671 | 58 | 2,838 | 1,015 | 7,426 |
| Fairfield | 105,321 | 48,407 | 16,586 | 869 | 15,700 | 1,149 | 13,301 | 9,309 | 28,789 |
| Rio Vista | 7,360 | 6,003 | 372 | 53 | 359 | 15 | 288 | 270 | 914 |
| Suisun City | 28,111 | 10,805 | 5,713 | 196 | 5,348 | 340 | 2,898 | 2,811 | 6,753 |
| Vacaville | 92,428 | 61,301 | 9,510 | 846 | 5,606 | 532 | 8,136 | 6,497 | 21,121 |
| Vallejo | 115,942 | 38,064 | 25,572 | 757 | 28,895 | 1,239 | 12,759 | 8,656 | 26,165 |
places | Population | American | American | | Islander | races | more races | or Latino (of any race) | |
| Allendale | 1,506 | 1,239 | 49 | 22 | 42 | 2 | 79 | 73 | 235 |
| Elmira | 188 | 150 | 1 | 10 | 2 | 0 | 17 | 8 | 47 |
| Green Valley | 1,625 | 1,412 | 41 | 6 | 82 | 9 | 20 | 55 | 121 |
| Hartley | 2,510 | 1,956 | 70 | 24 | 70 | 16 | 248 | 126 | 510 |
communities | Population | American | American | | Islander | races | more races | or Latino (of any race) | |
| All others not CDPs (combined) | 13,005 | 8,823 | 764 | 110 | 709 | 102 | 1,757 | 740 | 4,027 |
2000
As of the census[26] of 2000, there were 394,542 people, 130,403 households, and 97,411 families residing in the county. The population density was 476 people per square mile (184/km²). There were 134,513 housing units at an average density of 162 per square mile (63/km²). The racial makeup of the county was 56.4% White, 14.9% Black or African American, 0.8% Native American, 12.8% Asian, 0.8% Pacific Islander, 8.0% from other races, and 6.4% from two or more races. 17.64% of the population were Hispanic or Latino of any race. 8.5% were of German, 6.4% Irish and 6.0% English ancestry according to Census 2000. 75.7% spoke English, 12.1% Spanish and 6.6% Tagalog as their first language.
There were 130,403 households out of which 39.9% had children under the age of 18 living with them, 55.7% were married couples living together, 13.8% had a female householder with no husband present, and 25.3% were non-families. 19.6% of all households were made up of individuals and 6.5% had someone living alone who was 65 years of age or older. The average household size was 2.90 and the average family size was 3.33.
In the county the population was spread out with 28.3% under the age of 18, 9.2% from 18 to 24, 31.3% from 25 to 44, 21.7% from 45 to 64, and 9.5% who were 65 years of age or older. The median age was 34 years. For every 100 females there were 101.5 males. For every 100 females age 18 and over, there were 100.2 males.
The median income for a household in the county was $54,099, and the median income for a family was $60,597. Males had a median income of $41,787 versus $31,916 for females. The per capita income for the county was $21,731. About 6.1% of families and 8.3% of the population were below the poverty line, including 10.3% of those under age 18 and 6.3% of those age 65 or over.
Government and politics
Government
The Government of Solano County is defined and authorized under the California Constitution and law as a general law county. The County government provides countywide services such as elections and voter registration, law enforcement, jails, vital records, property records, tax collection, public health, and social services. In addition the County serves as the local government for all unincorporated areas.
The County government is composed of the elected five-member Board of Supervisors, several other elected offices including the Sheriff-Coroner, District Attorney, Assessor/Recorder, Auditor-Controller, and Treasurer/Tax Collector/County Clerk, and numerous county departments and entities under the supervision of the County Administrator. As of January 2013 the members of the Solano County Board of Supervisors were:
- Erin Hannigan, District 1
- Linda Seifert, District 2, Chairman
- Jim Spering, District 3
- John Vasquez, District 4
- Skip Thomson, District 5, Vice-Chairman
Politics
Voter registration statistics
| Population and registered voters | ||
|---|---|---|
| Total population[11] | 411,620 | |
| Registered voters[27][note 4] | 210,453 | 51.1% |
| Democratic[27] | 102,177 | 48.6% |
| Republican[27] | 52,633 | 25.0% |
| Democratic–Republican spread[27] | +49,544 | +23.6% |
| Independent[27] | 5,940 | 2.8% |
| Green[27] | 878 | 0.4% |
| Libertarian[27] | 1,123 | 0.5% |
| Peace and Freedom[27] | 539 | 0.3% |
| Americans Elect[27] | 12 | 0.0% |
| Other[27] | 905 | 0.4% |
| No party preference[27] | 46,246 | 22.0% |
Cities by population and voter registration
| Cities by population and voter registration | |||||||
|---|---|---|---|---|---|---|---|
| City | Population[11] | Registered voters[27] [note 4] |
Democratic[27] | Republican[27] | D–R spread[27] | Other[27] | No party preference[27] |
| Benicia | 26,981 | 68.1% | 47.2% | 25.3% | +21.9% | 8.4% | 22.1% |
| Dixon | 18,141 | 50.7% | 38.8% | 35.4% | +3.4% | 7.3% | 21.4% |
| Fairfield | 104,404 | 48.1% | 48.7% | 24.4% | +24.3% | 6.8% | 22.7% |
| Rio Vista | 7,088 | 72.6% | 42.7% | 33.9% | +8.8% | 9.0% | 18.2% |
| Suisun City | 27,900 | 49.1% | 52.4% | 20.2% | +32.2% | 7.0% | 23.2% |
| Vacaville | 92,217 | 50.1% | 39.6% | 33.2% | +6.4% | 8.5% | 22.1% |
| Vallejo | 116,021 | 48.8% | 59.9% | 14.5% | +45.4% | 6.1% | 21.8% |
Overview
| Year | GOP | DEM | Others |
|---|---|---|---|
| 2016 | 30.9% 51,685 | 60.9% 101,976 | 8.2% 13,746 |
| 2012 | 34.1% 52,092 | 63.3% 96,783 | 2.6% 3,965 |
| 2008 | 34.7% 56,035 | 63.2% 102,095 | 2.1% 3,458 |
| 2004 | 41.9% 62,301 | 57.2% 85,096 | 1.0% 1,440 |
| 2000 | 39.2% 51,604 | 57.0% 75,116 | 3.8% 5,015 |
| 1996 | 34.7% 40,742 | 55.1% 64,644 | 10.1% 11,893 |
| 1992 | 29.4% 38,883 | 48.7% 64,320 | 21.9% 28,908 |
| 1988 | 47.4% 50,314 | 51.2% 54,344 | 1.4% 1,430 |
| 1984 | 54.5% 51,678 | 44.3% 41,982 | 1.2% 1,138 |
| 1980 | 50.7% 40,919 | 38.4% 30,952 | 10.9% 8,805 |
| 1976 | 42.4% 26,136 | 54.6% 33,682 | 3.0% 1,826 |
| 1972 | 54.0% 31,314 | 42.7% 24,766 | 3.3% 1,885 |
| 1968 | 34.7% 17,683 | 53.5% 27,271 | 11.8% 5,998 |
| 1964 | 30.4% 15,263 | 69.5% 34,930 | 0.1% 47 |
| 1960 | 40.9% 18,751 | 58.8% 26,977 | 0.3% 141 |
| 1956 | 41.7% 17,865 | 58.1% 24,903 | 0.2% 95 |
| 1952 | 42.4% 19,369 | 57.2% 26,130 | 0.5% 216 |
| 1948 | 33.7% 12,345 | 63.5% 23,257 | 2.8% 1,022 |
| 1944 | 29.8% 10,361 | 69.9% 24,335 | 0.3% 105 |
| 1940 | 28.5% 6,081 | 70.6% 15,054 | 0.9% 193 |
| 1936 | 20.9% 3,603 | 78.1% 13,459 | 1.1% 182 |
| 1932 | 30.3% 4,382 | 67.2% 9,712 | 2.5% 367 |
| 1928 | 52.3% 7,061 | 46.5% 6,278 | 1.2% 158 |
| 1924 | 48.0% 4,782 | 9.6% 957 | 42.4% 4,223 |
| 1920 | 64.8% 7,102 | 26.9% 2,954 | 8.3% 909 |
Solano is a strongly Democratic county in presidential and congressional elections, though it usually gives somewhat higher vote percentages to Republicans compared to the eight other Bay Area counties. The last Republican to win a majority in the county was Ronald Reagan in 1984.
Solano County is split between California's 3rd and 5th congressional districts, represented by John Garamendi (D–Walnut Grove) and Mike Thompson (D–St. Helena), respectively.[29]
In the California State Assembly, Solano County is split between the 4th Assembly District, represented by Democrat Cecilia Aguiar-Curry, and the 11th Assembly District, represented by Democrat Jim Frazier. In the California State Senate, it is in the 3rd Senate District, represented by Democrat Bill Dodd.[30]
On Nov. 4, 2008, Solano County voted 55.9% for Proposition 8, which amended the California Constitution to ban same-sex marriages. It was the only Bay Area county to approve the initiative. In the 2008 presidential election that day, Barack Obama carried the county by a 28.5% margin over John McCain, a larger margin than statewide (24%).[31]
According to the California Secretary of State, as of October 22, 2012, Solano County has 209,484 registered voters, out of 274,284 eligible (76.4%). Of those, 101,815 (48.6%) are registered Democrats, 52,777 (25.2%) are registered Republicans, and 45,581 (21.8%) have declined to state a political party.[32] Democrats hold voter-registration advantages in all incorporated cities and towns in Solano County. However, Republicans lead in registration in the unincorporated communities of the county (40%-35%), making Solano the only county in the Bay Area where Republicans out-number Democrats in unincorporated communities. The Democrats' largest registration advantage in Solano is in the city of Vallejo, wherein there are only 8,242 Republicans (14.6%) out of 56,313 total voters compared to 33,753 Democrats (59.9%) and 12,157 voters who have declined to state a political party (21.6%).
Communities
Cities
Unincorporated communities
Population ranking
The population ranking of the following table is based on the 2010 census of Solano County.[33]
† county seat
| Rank | City/Town/etc. | Municipal type | Population (2010 Census)
|
|---|---|---|---|
| 1 | Vallejo | City | 115,942 |
| 2 | † Fairfield | City | 105,321 |
| 3 | Vacaville | City | 92,428 |
| 4 | Suisun City | City | 28,111 |
| 5 | Benicia | City | 26,997 |
| 6 | Dixon | City | 18,351 |
| 7 | Rio Vista | City | 7,360 |
| 8 | Hartley | CDP | 2,510 |
| 9 | Green Valley | CDP | 1,625 |
| 10 | Allendale | CDP | 1,506 |
| 11 | Elmira | CDP | 188 |
Trivia
- In 1985 Humphrey the humpback whale strayed off his migration route and ended up in Shag Slough north of Rio Vista. Rescuers from The Marine Mammal Center and other volunteers dismantled a county bridge before being able to turn him around in the narrow slough.
See also
- List of counties in California
- List of school districts in Solano County, California
- National Register of Historic Places listings in Solano County, California
- Solano County Library
Notes
- ↑ Only larceny-theft cases involving property over $400 in value are reported as property crimes.
- ↑ Other = Some other race + Two or more races
- ↑ Native American = Native Hawaiian or other Pacific Islander + American Indian or Alaska Native
- 1 2 Percentage of registered voters with respect to total population. Percentages of party members with respect to registered voters follow.
References
- ↑ "Chronology". California State Association of Counties. Retrieved February 6, 2015.
- ↑ "Mount Vaca". Peakbagger.com. Retrieved April 8, 2015.
- 1 2 3 4 "State & County QuickFacts". United States Census Bureau. Retrieved April 6, 2016.
- ↑ "Find a County". National Association of Counties. Retrieved 2011-06-07.
- 1 2 Landis, John D.; Reilly, Michael (2003). "How We Will Grow: Baseline Projections of California's Urban Footprint Through the Year 2011". In Guhathakurta, Subhrajit. Integrated Land Use and Environmental Models: A Survey of Current Applications and Research. Springer. p. 84. ISBN 9783540005766. Retrieved 14 March 2012.
- ↑ Alston, John (18 April 2008). "Solano County's unemployment rate soars to 6.4 percent". abc7news.com. Retrieved 14 March 2012.
- ↑ Walters, Dan (29 March 1986). "East Bay is a Socioeconomic Dichotomy". Lodi News-Sentinel. p. 12. Retrieved 14 March 2012.
- ↑ "Bay Area median home price falls below $500,000". San Francisco Business Times. 17 July 2008. Retrieved 14 March 2012.
- ↑ "US Gazetteer files: 2010, 2000, and 1990". United States Census Bureau. 2011-02-12. Retrieved 2011-04-23.
- ↑ Hogan, C. Michael; Papineau, Marc (September 1989). "Environmental Assessment of the Columbus Parkway Widening between Ascot Parkway and the Northgate Development, Vallejo". Earth Metrics Inc. Report 7853. California State Clearinghouse.
- 1 2 3 4 5 6 7 8 9 10 11 12 13 14 15 16 17 U.S. Census Bureau. American Community Survey, 2011 American Community Survey 5-Year Estimates, Table B02001. American FactFinder. Retrieved 2013-10-26.
- 1 2 3 4 5 6 7 8 9 10 Office of the Attorney General, Department of Justice, State of California. Table 11: Crimes – 2009. Retrieved 2013-11-14.
- 1 2 3 United States Department of Justice, Federal Bureau of Investigation. Crime in the United States, 2012, Table 8 (California). Retrieved 2013-11-14.
- 1 2 U.S. Census Bureau. American Community Survey, 2011 American Community Survey 5-Year Estimates, Table B03003. American FactFinder. Retrieved 2013-10-26.
- 1 2 U.S. Census Bureau. American Community Survey, 2011 American Community Survey 5-Year Estimates, Table B19301. American FactFinder. Retrieved 2013-10-21.
- 1 2 U.S. Census Bureau. American Community Survey, 2011 American Community Survey 5-Year Estimates, Table B19013. American FactFinder. Retrieved 2013-10-21.
- 1 2 U.S. Census Bureau. American Community Survey, 2011 American Community Survey 5-Year Estimates, Table B19113. American FactFinder. Retrieved 2013-10-21.
- 1 2 U.S. Census Bureau. American Community Survey, 2011 American Community Survey 5-Year Estimates. American FactFinder. Retrieved 2013-10-21.
- ↑ U.S. Census Bureau. American Community Survey, 2011 American Community Survey 5-Year Estimates, Table B01003. American FactFinder. Retrieved 2013-10-21.
- ↑ "County Totals Dataset: Population, Population Change and Estimated Components of Population Change: April 1, 2010 to July 1, 2015". Retrieved July 2, 2016.
- ↑ "U.S. Decennial Census". United States Census Bureau. Retrieved May 31, 2014.
- ↑ "Historical Census Browser". University of Virginia Library. Retrieved May 31, 2014.
- ↑ "Population of Counties by Decennial Census: 1900 to 1990". United States Census Bureau. Retrieved May 31, 2014.
- ↑ "Census 2000 PHC-T-4. Ranking Tables for Counties: 1990 and 2000" (PDF). United States Census Bureau. Retrieved May 31, 2014.
- ↑ "2010 Census P.L. 94-171 Summary File Data". United States Census Bureau.
- ↑ "American FactFinder". United States Census Bureau. Retrieved 2011-05-14.
- 1 2 3 4 5 6 7 8 9 10 11 12 13 14 15 16 17 California Secretary of State. February 10, 2013 - Report of Registration. Retrieved 2013-10-31.
- ↑ http://uselectionatlas.org/RESULTS/
- ↑ "California's 3rd Congressional District - Representatives & District Map". Civic Impulse, LLC. Retrieved March 1, 2013.
- ↑ "Statewide Database". UC Regents. Retrieved December 4, 2014.
- ↑ Leip, David. "Dave Leip's Atlas of U.S. Presidential Elections". www.uselectionatlas.org. Retrieved 2 October 2016.
- ↑ CA Secretary of State – Report of Registration – October 22, 2012
- ↑ "2010 Census". www.census.gov. Retrieved 2 October 2016.
External links
| Wikimedia Commons has media related to Solano County, California. |
- Official website
- Munro-Fraser, J. P. (1879). History of Solano County. San Francisco, California: Wood, Alley & Co. - An early history of Solano County
- Hiking trails in Solano County
 |
Yolo County | | ||
| Sonoma County and Napa County | |
Sacramento County | ||
| ||||
| | ||||
| Contra Costa County |
Municipalities and communities of Solano County, California, United States | ||
|---|---|---|
| Cities | | |
| CDPs | ||
| Unincorporated communities | ||
| Ghost towns |
| |
| Bodies of water |
|  |
|---|---|---|
| Counties | ||
| Major cities | ||
| Cities and towns 100k–250k | ||
| Cities and towns 50k–99k | ||
| Cities and towns 25k-50k | ||
| Cities and towns 10k–25k |
| |
| Sub-regions | ||
Coordinates: 38°16′N 121°56′W / 38.27°N 121.94°W