San Francisco Bay Area
| Bay Area | ||||
|---|---|---|---|---|
| Nine-county region | ||||
| ||||
 San Francisco Bay Area within California | ||||
| Country | United States | |||
| State | California | |||
| Major cities | ||||
| Area | ||||
| • Metro | 6,712 sq mi (17,384 km2) | |||
| Highest elevation at Mount Hamilton | 4,360 ft (1,330 m) | |||
| Lowest elevation at Alviso | -10 ft (−3 m) | |||
| Population (July 1, 2015) | ||||
| • Nine-county region | 7.65 million[1] | |||
| • Density | 933/sq mi (360/km2) | |||
| • CSA | 8.71 million[2] | |||
| • CSA density | 860/sq mi (330/km2) | |||
| Time zone | Pacific (UTC−8) | |||
| • Summer (DST) | PDT (UTC−7) | |||

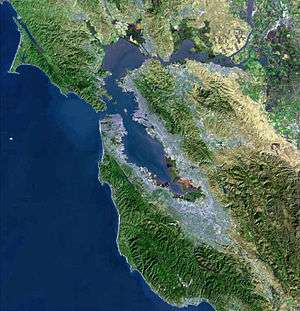
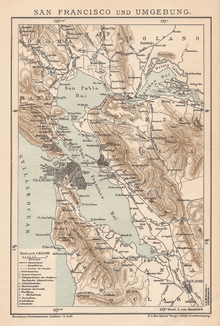
The San Francisco Bay Area (referred to locally as the Bay Area) is a populous region surrounding the San Francisco and San Pablo estuaries in Northern California. The region encompasses the major cities and metropolitan areas of San Jose, San Francisco, and Oakland, along with smaller urban and rural areas.[3] The Bay Area's nine counties are Alameda, Contra Costa, Marin, Napa, San Francisco, San Mateo, Santa Clara, Solano, and Sonoma.[3][4] Home to approximately 7.65 million people,[1] the nine-county Bay Area contains many cities, towns, airports, and associated regional, state, and national parks, connected by a network of roads, highways, railroads, bridges, tunnels and commuter rail. The combined statistical area of the region is the second-largest in California (after the Greater Los Angeles area), the fifth-largest in the United States, and the 43rd-largest urban area in the world.
The United States Office of Management and Budget (OMB) does not use the nine-county definition of the Bay Area. The OMB has designated a more extensive 12-county Combined Statistical Area (CSA) titled the San Jose-San Francisco-Oakland, CA Combined Statistical Area[5] which also includes the three counties of San Joaquin, Santa Cruz, and San Benito that do not border the San Francisco or San Pablo Bays, but are economically tied to the nine counties that do. The southernmost portion of Sacramento County has direct access to Suisun Bay, which lies immediately to the east of San Pablo Bay, but is not counted as one of the counties of the Bay Area.
The Bay Area has the second-most Fortune 500 Companies in the United States, and is known for its natural beauty, liberal politics, entrepreneurship, and diversity.[6][7] The area ranks second in highest density of college graduates,[8][9] and performs above the state median household income in the 2010 census;[10] it includes the five highest California counties by per capita income and two of the top 25 wealthiest counties in the United States. Based on a 2013 population report from the California Department of Finance, the Bay Area is the only region in California where the rate of people migrating in from other areas in the United States is greater than the rate of those leaving the region, led by Alameda and Contra Costa counties.[11]
Sub-regions
.svg.png)
East Bay
The eastern side of the bay, consisting of Alameda and Contra Costa counties, is known locally as the East Bay. The East Bay can be loosely divided into two regions, the inner East Bay, which adjoins the Bay shoreline, and the outer East Bay, consisting of inland valleys separated from the inner East Bay by hills and mountains.
- The inner East Bay includes the western portions of Alameda and Contra Costa Counties, including the cities of Oakland, Hayward, Fremont, Berkeley, and Richmond, as well as many smaller suburbs such as Alameda, Castro Valley, Newark, Union City, Emeryville, Albany, San Leandro, San Pablo, Crockett, El Sobrante, Pinole, San Lorenzo, Hercules, Rodeo, Piedmont, and El Cerrito. The inner East Bay is more densely populated, with generally older buildings, and a more ethnically diverse population. This region contains the Bay Area's largest seaport, the Port of Oakland, the headquarters of Pixar Animation Studios, and hosts the professional sports franchises the Golden State Warriors, Oakland Raiders, and Oakland Athletics.
- The outer East Bay consists of the eastern portions of Alameda and Contra Costa counties and is divided into 4 distinct areas: Lamorinda, Central Contra Costa County, East Contra Costa County, and the Tri-Valley. The word Lamorinda was coined by combining the names of the cities it includes: Lafayette, Moraga, and Orinda. Walnut Creek is situated east of Lamorinda and north of the San Ramon Valley and, together with Concord, Martinez, and Pleasant Hill comprises Central Contra Costa County. The cities of Antioch, Pittsburg, Brentwood, Oakley and the unincorporated areas surrounding them comprise East Contra Costa County. The Tri-Valley consists of the Amador, the Livermore, and the San Ramon Valleys. Dublin and Pleasanton comprise the Amador Valley, Livermore lies in the Livermore Valley, and the San Ramon Valley consists of Alamo, Danville, Diablo and its namesake, San Ramon. The outer East Bay is connected to the inner East Bay (East/West) by BART, Interstate 580 to the south, and State Routes State Route 4 to the north, and State Route 24 via the Caldecott Tunnel in the center. The outer East Bay's infrastructure was mostly built up after World War II. This area remains largely white demographically, although the Hispanic and Filipino populations have grown significantly over the past 2–3 decades.
North Bay
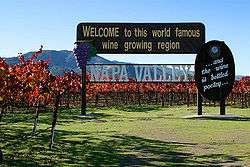
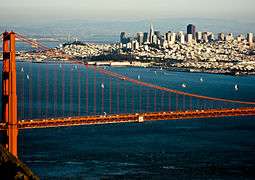
The region north of the Golden Gate Bridge is known locally as the North Bay. This area encompasses Marin County, Sonoma County, Napa County and extends eastward into Solano County. The city of Fairfield, being part of Solano County, is often considered the easternmost city of the North Bay.
With few exceptions, this region is quite affluent: Marin County is ranked as the wealthiest in the state. The North Bay is relatively rural compared to the remainder of the Bay Area, with many areas of undeveloped open space, farmland and vineyards. Santa Rosa in Sonoma County is the North Bay's largest city, with a population of 167,815 and a Metropolitan Statistical Area population of 466,891, making it the fifth-largest city in the Bay Area.
The North Bay is the only section of the Bay Area that is not currently served by a commuter rail service, however the Sonoma-Marin Area Rail Transit is scheduled to open in 2016. The lack of transportation services is mainly because of the lack of population mass in the North Bay, and the fact that it is separated completely from the rest of the Bay Area by water, the only access points being the Golden Gate Bridge leading to San Francisco, the Richmond-San Rafael and Carquinez Bridges leading to Richmond, and the Benicia-Martinez Bridge leading to Martinez.
Peninsula
The area from San Francisco to the Silicon Valley, geographically part of the San Francisco Peninsula, is known locally as The Peninsula. This area consists of San Francisco and suburban communities in San Mateo County, and the northwestern part of Santa Clara County, as well as various towns along the Pacific coast, such as Pacifica and Half Moon Bay. This area is extremely diverse. Many of the cities and towns had originally been centers of rural life until the post-World War II era when large numbers of middle and upper class Bay Area residents moved in and developed the small villages. Since the 1980s the area has seen a large growth rate of middle and upper-class families who have settled in cities like Palo Alto, Los Altos, Portola Valley, Woodside, and Atherton as part of the technology boom of Silicon Valley. Many of these families are of foreign background and have significantly contributed to the diversity of the area. Peninsula cities include: Atherton, Belmont, Brisbane, Burlingame, Colma, Cupertino, Daly City, East Palo Alto, Foster City, Half Moon Bay, Hillsborough, Los Altos, Los Altos Hills, Menlo Park, Millbrae, Mountain View, Palo Alto, Pacifica, Portola Valley, Redwood City, Redwood Shores, San Bruno, San Carlos, San Francisco, San Mateo, South San Francisco and Woodside.
Whereas the term peninsula technically refers to the entire geographical San Franciscan Peninsula, in local terms, The Peninsula does not include the city of San Francisco itself.[12][13][14][15]

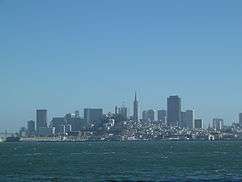
San Francisco is surrounded by water on three sides; the north, east, and west. The city squeezes approximately 805,000 people in under 46.9 square miles (121 km2), making it the second-most densely populated major city in North America after New York City.[16] On any given day, there can be as many as 1 million people in the city because of the commuting population and tourism. San Francisco also has the largest commuter population of the Bay Area cities. The limitations of land area, however, make continued population growth challenging, and also has resulted in increased real estate prices. Though San Francisco is located at the tip of the peninsula, when the peninsula is discussed, it usually refers to the communities and geographic locations south of the city proper.[15]
South Bay

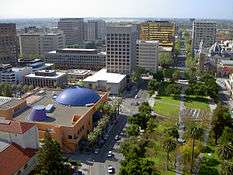
The communities at the southern region of the Bay Area are primarily located in what is known as Silicon Valley, or the Santa Clara Valley. These include the city of San Jose, and surrounding municipalities, including the high-tech hubs of Santa Clara, Milpitas, Cupertino, Mountain View, Sunnyvale as well as many other cities like Saratoga, Campbell, Los Gatos and the exurbs of Morgan Hill and Gilroy. Some Peninsula and East Bay towns are sometimes recognized as being in the Silicon Valley. Generally, the term South Bay refers to Santa Clara County, but the northwest portion of the county (Palo Alto, Mountain View, Los Altos and Los Altos Hills) may be considered part of the peninsula as well.
Silicon Valley was primarily an agricultural center from the time of California's founding until World War II. During and after the war, working and middle-class families migrated to the area to settle and work in the burgeoning aerospace and electronics industries. This area then experienced rapid growth as agriculture was gradually replaced by high-technology. During this period, the Santa Clara Valley gradually became an urbanized metropolitan region. Today, the growth continues, fueled primarily by technology jobs, the weather, and immigrant labor. Urbanization is gradually replacing suburbanization as the population density of the valley increases. This trend has resulted in a huge increase in property values, forcing many middle-class families out of the area or into lower income neighborhoods in older sections of the region. The Santa Clara Valley also came to be known as Silicon Valley, as the area became the premier technology center of the United States. Some notable tech companies headquartered in the South Bay are AMD, Adobe, Intel, Netflix, Cisco Systems, Hewlett-Packard, Apple, Google, eBay, Facebook and Yahoo!. Largely a result of the high technology sector, the San Jose-Sunnyvale-Santa Clara, CA Metropolitan Statistical Area has the most millionaires and the most billionaires in the United States per capita.[17]
The population of the entire valley is part of the San Jose-Sunnyvale-Santa Clara metropolitan area, which has about 2 million residents. San Jose, the largest city in the Silicon Valley area, is the tenth most populous city in the United States and the most populous city in the Bay Area. San Jose is the oldest city in California and was its first capital. The city prides itself on being an environmentally conscious city. It recycles a greater percentage of its waste than any other large American city. Over the past several decades, the San Jose Area has experienced rapid growth. To limit the effects of urban sprawl, planned communities were laid out to control growth. Urban growth boundaries have been established to protect remaining open space (primarily in the surrounding hills and southern border) from development. Most new growth has been urban infill in the form of high density housing to increase density rate. The growth rate has slowed, but the area continues to have steady growth.
San Jose is home to many sports teams both amateur and professional, such as the San Jose Sharks of the NHL, and the San Jose Earthquakes of MLS. The San Francisco 49ers moved to a new stadium in Santa Clara in 2014.
The Silicon Valley has a large transportation infrastructure that includes many freeways, VTA bus service and light rail, Amtrak, and commuter rail such as Caltrain. The San Jose International Airport serves air traffic in the San Jose Area and is conveniently located just north of downtown in the center of Silicon Valley. The height of buildings in Downtown is limited (due to FAA regulations and city ordinance) because it is situated directly under the flight path. The South Bay is poised to have a more efficient transportation network with the extension of the BART system to San Jose, which would allow elevated/subway travel into San Francisco. San Jose will also be a major stop on the proposed California High-Speed Rail system.[18][19]
Outer Bay
Whether Santa Cruz, San Benito and San Joaquin counties are considered part of the San Francisco Bay Area depends on the observer. For example, the regional governments in the San Francisco Bay Area, including the Association of Bay Area Governments, the Metropolitan Transportation Commission, the Bay Area Air Quality Management District (BAAQMD), and the San Francisco Bay Regional Water Quality Control Board (RWQCB) include only the nine counties above in their boundaries or membership. (The BAAQMD includes all of the nine counties except the northern portions of Sonoma and Solano; the RWQCB includes all of San Francisco and the portions of the other eight counties that drain to San Francisco Bay or to the Pacific Ocean.)[20] However, the Office of Management and Budget defines the San Jose-San Francisco-Oakland Consolidated Statistical Area as a twelve-county region, including the nine counties above plus Santa Cruz, San Benito and San Joaquin counties. Although, the San Francisco television market excludes half of Solano, Santa Cruz, San Benito, and San Joaquin counties; but includes Mendocino and Lake counties. Meanwhile, the California State Parks Department defines the Bay Area as including ten counties,[21] including Santa Cruz but excluding San Benito and San Joaquin. On the other hand, Santa Cruz and San Benito along with Monterey County are part of a different regional government organization called the Association of Monterey Bay Area Governments. Local media in the San Francisco Bay Area and travel guides often consider these two counties as part of the South Bay subregion, as they are greatly connected geographically, economically, and historically.[22][23][24][25][26] Santa Cruz County, along with San Benito County are usually regarded as being part of the California Central Coast and San Joaquin County is usually regarded as part of the California Central Valley, but has seen recent growth as several of its cities and communities have become exurbs of the Bay Area.
History
Economy
In 2015, the San Jose-San Francisco-Oakland CSA had a GDP of $758.5 billion, which would rank 17th among countries.
Silicon Valley is located within the southern reaches of the Bay Area. The leading high technology region in the world, Silicon Valley covers San Jose and several cities of South Bay. The Valley is home to many of the industry leaders in technology such as Google, Yahoo!, Facebook, eBay, PayPal, Cisco, Apple, Oracle, Marvell, Intel, Uber and Hewlett-Packard. Major corporations in San Francisco, San Jose, Oakland, and the surrounding cities help make the region second in the nation in concentration of Fortune 500 companies, after New York.[27] The region's northern counties encompass California's famous Wine Country, home to hundreds of vineyards and wineries. The Bay Area is a leader in sustainable agriculture, organic farming, and sustainable energy and a leading producer of high quality food, wine, and innovation in the culinary arts. California Cuisine was developed primarily in the Bay Area, as was the organic farming movement. The area is renowned for its natural beauty. It is also known as being one of the most expensive regions to live in the country.[6][28]
Oakland, on the east side of the bay, has the fifth-largest container shipping port in the United States. The city is also a major rail terminus.[29]
Changes in house prices for the Bay Area are publicly tracked on a regular basis using the Case–Shiller index; the statistic is published by Standard & Poor's and is also a component of S&P's 10-city composite index of the value of the U.S. residential real estate market.
The Bay Area led the United States in sustainable energy and "clean tech" development in 2012, with San Francisco and San Jose having significantly higher ratings than any other US cities, according to Clean Edge.[30]
A 2016 poll of 1,000 people, by the Bay Area Council, showed that 34 percent are considering leaving the area, due primarily to the high costs of living and housing, and traffic.[31]
Metropolitan area
The United States Office of Management and Budget has designated seven Metropolitan Statistical Areas (MSAs) and one Combined Statistical Area (CSA) for the Bay Area and nearby counties.[5] These comprise:
- The San Francisco–Oakland–Hayward, CA Metropolitan Statistical Area comprising Alameda, Contra Costa, San Francisco, San Mateo, and Marin counties
- The San Jose-Sunnyvale-Santa Clara, CA Metropolitan Statistical Area comprising Santa Clara and San Benito counties
- The Stockton-Lodi, CA Metropolitan Statistical Area comprising San Joaquin County
- The Santa Rosa, CA Metropolitan Statistical Area comprising Sonoma County
- The Vallejo-Fairfield, CA Metropolitan Statistical Area comprising Solano County
- The Santa Cruz-Watsonville, CA Metropolitan Statistical Area comprising Santa Cruz County
- The Napa, CA Metropolitan Statistical Area comprising Napa County
- The San Jose-San Francisco-Oakland, CA Combined Statistical Area comprising all seven MSAs above and their 12 counties
The United States Census Bureau estimates the population for these areas as of July 1, 2015 as follows:[2][32]
| Statistical area | 2015 Estimate | 2010 Census | Change |
|---|---|---|---|
| San Francisco-Oakland-Hayward, CA Metropolitan Statistical Area | 4,656,132 | 4,335,391 | +7.40% |
| San Jose-Sunnyvale-Santa Clara, CA Metropolitan Statistical Area | 1,976,836 | 1,836,911 | +7.62% |
| Stockton-Lodi, CA Metropolitan Statistical Area | 726,106 | 685,306 | +5.95% |
| Santa Rosa, CA Metropolitan Statistical Area | 502,146 | 483,878 | +3.78% |
| Vallejo-Fairfield, CA Metropolitan Statistical Area | 436,092 | 413,344 | +5.50% |
| Santa Cruz-Watsonville, CA Metropolitan Statistical Area | 274,146 | 262,382 | +4.48% |
| Napa, CA Metropolitan Statistical Area | 142,456 | 136,484 | +4.38% |
| San Jose-San Francisco-Oakland, CA Combined Statistical Area | 8,713,914 | 8,153,696 | +6.87% |
The San Jose-San Francisco-Oakland, CA Combined Statistical Area ranks as the fifth most populous metropolitan area of the United States.[32]
The U.S. Census Bureau estimates the population of the less extensive nine-county Bay Area as of July 1, 2015 as follows:[1]
| County | 2015 Estimate | 2010 Census | Change |
|---|---|---|---|
| Santa Clara County | 1,918,044 | 1,781,642 | +7.66% |
| Alameda County | 1,638,215 | 1,510,271 | +8.47% |
| Contra Costa County | 1,126,745 | 1,049,025 | +7.41% |
| San Francisco | 864,816 | 805,235 | +7.40% |
| San Mateo County | 765,135 | 718,451 | +6.50% |
| Sonoma County | 502,146 | 483,878 | +3.78% |
| Solano County | 436,092 | 413,344 | +5.50% |
| Marin County | 261,221 | 252,409 | +3.49% |
| Napa County | 142,456 | 136,484 | +4.38% |
| Total | 7,654,870 | 7,150,739 | +7.05% |
Demographics
| Historical population | |||
|---|---|---|---|
| Census | Pop. | %± | |
| 1860 | 114,074 | — | |
| 1870 | 265,808 | 133.0% | |
| 1880 | 422,128 | 58.8% | |
| 1890 | 547,618 | 29.7% | |
| 1900 | 658,111 | 20.2% | |
| 1910 | 925,708 | 40.7% | |
| 1920 | 1,182,911 | 27.8% | |
| 1930 | 1,578,009 | 33.4% | |
| 1940 | 1,734,308 | 9.9% | |
| 1950 | 2,681,322 | 54.6% | |
| 1960 | 3,638,939 | 35.7% | |
| 1970 | 4,628,199 | 27.2% | |
| 1980 | 5,179,784 | 11.9% | |
| 1990 | 6,023,577 | 16.3% | |
| 2000 | 6,783,760 | 12.6% | |
| 2010 | 7,150,739 | 5.4% | |
| Est. 2015 | 7,654,870 | [1] | 7.1% |
| Note: 9 County Population Totals | |||
According to the 2010 United States Census, the population was 7.15 million in the nine-county Bay Area, with 49.6% male and 50.4% female.[33] In 2010 the racial makeup of the nine-county Bay Area was 52.5% White including white Hispanic, 6.7% non-Hispanic African American, 0.7% Native American, 23.3% Asian (7.9% Chinese, 5.1% Filipino, 3.3% Indian, 2.5% Vietnamese, 1.0% Korean, 0.9% Japanese, 0.2% Pakistani, 0.2% Cambodian, 0.2% Laotian, 0.1% Thai, 0.1% Burmese), 0.6% Pacific Islander (0.1% Tongan, 0.1% Samoan, 0.1% Fijian, >0.1% Guamanian, >0.1% Native Hawaiian), 10.8% from other races, and 5.4% from two or more races. The population was 23.5% Hispanic or Latino of any race (17.9% Mexican, 1.3% Salvadoran, 0.6% Guatemalan, 0.6% Puerto Rican, 0.5% Nicaraguan, 0.3% Peruvian, 0.2% Cuban).[34]
The Bay Area cities of Vallejo, Suisun City, Oakland, San Leandro, Fairfield, and Richmond are among the most ethnically diverse cities in the United States.[35]
The Chinese population of the Bay Area is concentrated in San Francisco, where 30% of the Bay Area's Chinese American population resides, as well as in Oakland and in the San Jose area, which is also home to a significant Indian American community.[33] The Bay Area is home to over 382,950 Filipino Americans, one of the largest communities of Filipino people outside of the Philippines with the largest proportion of Filipino Americans concentrating themselves within Daly City.[33][36] There are more than one hundred thousand people of Vietnamese ancestry residing within San Jose city limits, the largest population of any city in the world outside of Vietnam.[37] There is a sizable community of Korean Americans in Santa Clara County, and there is a large strip of Korean restaurants and businesses located in Santa Clara. East Bay cities such as Richmond and Oakland, and the North Bay city of Santa Rosa, have plentiful populations of Laotian and Cambodians in certain neighborhoods.[33]
Pacific Islanders such as Samoans and Tongans have the largest presence in East Palo Alto, San Mateo, San Bruno, Redwood City and the Bayview-Hunters Point and Visitacion Valley neighborhoods of San Francisco.[33]
The Latino population is spread throughout the Bay Area, but has the largest populations in San Jose, in The Peninsula cities of Redwood City, East Palo Alto, South San Francisco, San Bruno, San Francisco, San Mateo, Daly City, and Menlo Park, North Bay cities of Dixon, San Rafael, Fairfield, and Vallejo, East Bay cities of Oakland, Richmond, Concord and Antioch, and in Sonoma County. San Francisco's Mission District is home to a thriving Mexican American community, as well as many residents of Salvadoran and Guatemalan descent.[33]
The African American population of the Bay Area has always been significant in Marin City, Oakland, and Richmond, but other East and North Bay cities such as Antioch, Vallejo and Fairfield have received an influx of black residents. While mainly concentrated in the East Bay and on the peninsula in San Francisco, there are well-established black neighborhoods located in the North Bay and in the Silicon Valley. The South Park neighborhood of Santa Rosa was home to once a primarily black community until the 1980s, when many Latino immigrants settled in the area.[38] The Marin City community in Marin County has a significant black population. In Silicon Valley, East Palo Alto has the highest population of African Americans.
San Francisco's North Beach district is considered the Little Italy of the city, and was once home to a significant Italian American community. San Francisco and Marin County both have substantial Jewish communities.[39]
In 2007 the population density was 1,057 people per square mile. There were 2,499,702 housing units with an average family size of 3.3. Of the 2,499,702 households, approximately one-third were renter occupied housing units, while two-thirds were owner occupied housing units. 12.7% had a female householder with no husband present, 11.6% of households had someone 65 years of age or older, and 27.4% of households were non-families.[33]
The Bay Area is one of the wealthiest regions in the United States, due, primarily, to the economic power engines of San Jose, San Francisco, and Oakland. Pleasanton has the second-highest household income in the country after New Canaan, CT. However, discretionary income is very comparable with the rest of the country, primarily because the higher cost of living offsets the increased income.[40]
Forty-seven Bay Area residents made the Forbes magazine's 400 richest Americans list, published in 2007. Thirteen lived in San Francisco proper, placing it seventh among cities in the world. Among the forty-seven were several well-known names such as Steve Jobs, George Lucas, and Charles Schwab. The wealthiest resident was Larry Ellison of Oracle, worth $25 billion.[41]
A study by Capgemini indicates that in 2009, 4.5% of all households within the San Francisco-Oakland and San Jose metropolitan areas held $1 million in investable assets, placing the region No. 1 in the United States (Metro New York City placed second at 4.3%).[42]
As of 2007, there were approximately 80 public companies with annual revenues of over $1 billion a year, and 5–10 more private companies. Nearly 2/3 of these are in the Silicon Valley section of the Bay Area. According to the May 2010 Fortune Magazine analysis of the US "Fortune 500" companies, the combined San Jose-San Francisco-Oakland metropolitan region ranks second (after metro New York City and before Chicago) with 30 companies (May 2011, Fortune Magazine).[43]
Politics
The Bay Area is widely regarded as one of the most liberal areas in the country. According to the Cook Partisan Voting Index (CPVI), congressional districts the Bay Area tends to favor Democratic candidates by roughly 40 to 50 percentage points, considerably above the mean for California and the nation overall. All congressional districts in the region voted for Democrat Barack Obama over Republican John McCain in the 2008 Presidential Election. Over the last four and a half decades the 9-county Bay Area voted for Republican candidates only twice, once in 1972 for Richard Nixon and again in 1980 for Ronald Reagan, both Californians. The last county to vote for a Republican Presidential candidate was Napa county in 1988 for George H. W. Bush.
| County | |||||||
|---|---|---|---|---|---|---|---|
| Population (2010)[44] | 2012 election results[45] | Median household income (2011)[46] | Per capita income (2011)[46] | Voter Registration (2013)[47] | |||
| Democratic | Independent | Republican | |||||
| Alameda | 1,510,271 | 78.9%–18.2% Obama | $67,558 | $33,888 | 461,007 | 158,958 | 114,802 |
| Contra Costa | 1,049,025 | 66.2%–31.2% Obama | $74,353 | $36,274 | 263,258 | 113,358 | 131,608 |
| Marin | 252,409 | 74.3%–23.0% Obama | $77,168 | $49,439 | 83,853 | 35,251 | 28,116 |
| Napa | 136,484 | 63.0%–34.3% Obama | $61,460 | $32,170 | 33,182 | 15,248 | 19,142 |
| San Francisco | 805,235 | 83.5%–13.0% Obama | $69,894 | $44,905 | 276,855 | 154,691 | 42,922 |
| San Mateo | 718,451 | 72.1%–25.5% Obama | $81,657 | $44,331 | 185,134 | 92,158 | 69,925 |
| Santa Clara | 1,781,642 | 70.1%–27.2% Obama | $84,895 | $39,365 | 372,979 | 237,357 | 177,268 |
| Solano | 413,344 | 63.5%–34.2% Obama | $63,795 | $27,785 | 102,177 | 46,246 | 52,633 |
| Sonoma | 483,878 | 71.1%–25.3% Obama | $61,020 | $30,868 | 134,896 | 55,666 | 56,428 |
| Median | — | 72.9%–24.1% Obama | $73,562 | $37,851 | — | — | — |
| Total | 7,150,739 | — | — | — | 1,913,341 | 908,933 | 692,844 |
| Year | Democrat | Republican |
|---|---|---|
| 2012 | 72.9% 2,105,625 | 24.1% 696,656 |
| 2008 | 73.8% 2,172,411 | 24.4% 717,989 |
| 2004 | 69.2% 1,926,726 | 29.3% 815,225 |
| 2000 | 64.1% 1,607,695 | 30.0% 751,832 |
| 1996 | 60.5% 1,417,511 | 28.3% 662,263 |
| 1992 | 56.2% 1,476,971 | 25.0% 658,202 |
| 1988 | 57.8% 1,338,533 | 40.8% 945,802 |
| 1984 | 50.8% 1,157,855 | 47.9% 1,090,115 |
| 1980 | 40.7% 827,309 | 44.4% 904,100 |
| 1976 | 49.9% 950,055 | 45.8% 872,920 |
| 1972 | 48.2% 990,560 | 49.1 1,007,615 |
| 1968 | 50.8% 890,650 | 41.3% 725,304 |
| 1964 | 65.7% 1,116,215 | 34.1% 579,528 |
| 1960 | 52.0% 820,860 | 47.6% 751,719 |
| District | Location | Representative | Cook PVI[48] | 2012 election results[45] | Median household income (2011)[49] |
|---|---|---|---|---|---|
| 2nd | Marin County and the North Coast | Jared Huffman | D+20 | 69.0%–27.0% Obama | $56,576 |
| 3rd | Fairfield, Vacaville, and the Sacramento Valley | John Garamendi | D+3 | 54.3%–43.1% Obama | $53,602 |
| 5th | Santa Rosa, Napa County, Vallejo, and Martinez | Mike Thompson | D+19 | 69.7%–27.4% Obama | $58,942 |
| 9th | Antioch and most of San Joaquin County | Jerry McNerney | D+6 | 57.8%–40.1% Obama | $52,209 |
| 11th | Most of Contra Costa County | Mark DeSaulnier | D+17 | 67.5%–29.9% Obama | $69,586 |
| 12th | Most of San Francisco | Nancy Pelosi | D+34 | 84.0%–12.5% Obama | $69,046 |
| 13th | Berkeley, Oakland, and San Leandro | Barbara Lee | D+37 | 87.5%–9.0% Obama | $56,906 |
| 14th | Most of San Mateo County | Jackie Speier | D+23 | 74.2%–23.6% Obama | $79,287 |
| 15th | Hayward, Union City, and the Tri-Valley | Eric Swalwell | D+16 | 68.0%–29.8% Obama | $82,179 |
| 17th | Fremont and northern Silicon Valley | Mike Honda | D+20 | 71.9%–25.5% Obama | $92,030 |
| 18th | Menlo Park and western Silicon Valley | Anna Eshoo | D+18 | 68.2%–28.9% Obama | $97,001 |
| 19th | San Jose and Morgan Hill | Zoe Lofgren | D+19 | 71.2%–26.5% Obama | $71,479 |
| Median | — | — | D+13 | 67.8%–26.9% Obama | $63,904 |
During the Base Realignment and Closures (BRACs) of the 1990s, almost all the military installations in the region were closed.[50][51] The only remaining major active duty military installations are Travis Air Force Base[52] and Coast Guard Island.
Climate

| City | Jan | Feb | Mar | Apr | May | Jun | Jul | Aug | Sep | Oct | Nov | Dec |
|---|---|---|---|---|---|---|---|---|---|---|---|---|
| Gilroy | 60/39 (16/4) |
64/42 (18/6) |
68/44 (20/7) |
73/46 (23/8) |
78/50 (26/10) |
84/53 (29/12) |
88/55 (31/13) |
88/55 (31/13) |
85/54 (29/12) |
79/49 (26/9) |
68/43 (20/6) |
60/38 (16/3) |
| Oakland | 58/45 (14/7) |
62/48 (17/9) |
64/49 (18/9) |
66/51 (19/11) |
69/53 (21/12) |
71/56 (22/13) |
72/57 (22/14) |
73/58 (23/14) |
74/58 (23/14) |
72/55 (22/13) |
64/50 (18/10) |
58/45 (14/7) |
| Richmond | 58/44 (14/7) |
61/46 (16/8) |
64/48 (18/9) |
67/49 (19/9) |
69/52 (21/11) |
72/55 (22/13) |
72/56 (22/13) |
72/56 (22/13) |
74/56 (23/13) |
72/54 (22/12) |
65/49 (18/9) |
58/44 (14/7) |
| San Francisco | 58/46 (14/8) |
61/48 (16/9) |
63/49 (17/9) |
64/50 (18/10) |
66/52 (19/11) |
68/53 (20/12) |
68/55 (20/13) |
69/56 (21/13) |
71/56 (22/13) |
70/54 (21/12) |
64/51 (18/11) |
58/47 (14/8) |
| San Rafael | 55/42 (13/6) |
60/44 (16/7) |
64/45 (18/7) |
67/47 (19/8) |
71/50 (22/10) |
77/53 (25/12) |
80/55 (27/13) |
80/55 (27/13) |
79/54 (26/12) |
73/51 (23/11) |
64/46 (18/8) |
55/41 (13/5) |
| Santa Rosa | 58/39 (14/4) |
62/42 (17/6) |
65/43 (18/6) |
69/45 (21/7) |
73/49 (23/9) |
79/52 (26/11) |
81/53 (27/12) |
82/53 (28/12) |
82/52 (28/11) |
76/49 (24/9) |
65/43 (18/6) |
58/39 (14/4) |
Ecology
Despite its urban and industrial character, San Francisco and San Pablo Bays and the Sacramento-San Joaquin Delta remain perhaps California's most important ecological habitats. California's Dungeness crab, Pacific halibut, and Pacific salmon fisheries rely on the bay as a nursery. The few remaining salt marshes now represent most of California's remaining salt marsh, supporting a number of endangered species and providing key ecosystem services such as filtering pollutants and sediments from the rivers. Most famously, the bay is a key link in the Pacific Flyway. Millions of waterfowl annually use the bay shallows as a refuge. Two endangered species of birds are found here: the California least tern and the California clapper rail. Exposed bay muds provide important feeding areas for shorebirds, but underlying layers of bay mud pose geological hazards for structures near many parts of the bay perimeter. San Francisco Bay provided the nation's first wildlife refuge, Oakland's artificial Lake Merritt (constructed in the 1860s) and America's first urban National Wildlife Refuge, the Don Edwards San Francisco Bay National Wildlife Refuge (SFBNWR) (1972). The Bay is also invaded by non-native species.
The seasonal range of water temperature in the Bay is from about 8 °C (46 °F) to about 23 °C (73 °F).
Industrial, mining, and other uses of mercury have resulted in a widespread distribution of that poisonous metal in the bay, with uptake in the bay's phytoplankton and contamination of its sportfish.[53] In November 2007, a ship named Cosco Busan collided with the San Francisco–Oakland Bay Bridge and spilled over 58,000 gallons of bunker fuel, creating the largest oil spill in the region since 1996.[54]
Salmonids in the Bay Area
Steelhead (Oncorhynchus mykiss) populations in California have dramatically declined due to human and natural causes. The Central California Coast distinct population segment (DPS) was listed as threatened under the Federal Endangered Species Act on August 18, 1997; threatened status was reaffirmed on January 5, 2006. This DPS includes all naturally spawned anadromous steelhead populations below natural and manmade impassable barriers in California streams from the Russian River to Aptos Creek, and the drainages of San Francisco, San Pablo, and Suisun Bays.[55][56] The U.S. National Marine Fisheries Service has a detailed description of threats.
The Central California Coast coho salmon (Oncorhynchus kisutch) Evolutionary Significant Unit (ESU) population is the most endangered of the many troubled salmon populations on the West Coast.[57] It was listed as threatened on October 31, 1996 and later changed to endangered status on June 28, 2005.[58] The ESU includes all naturally spawned populations of coho salmon (Oncorhynchus kisutch) from Punta Gorda in northern California south to and including the San Lorenzo River in central California, as well as populations in tributaries to San Francisco Bay. The National Park Service has made major recent investments in restoring the tidal wetlands at the mouths of Lagunitas Creek and Redwood Creek including levee removal and placement of large woody debris in the creeks, which provide shelter to salmonids during heavy stream flows and flooding. Lagunitas Creek's coho population is especially important, as 80% of the ESU depends on this stream draining the north slope of Mount Tamalpais.[59] This year's coho count dropped to 64 from an average of 600 in previous years.[57]
Much of the SFBNWR consists of salt evaporation ponds acquired from the Leslie Salt Company and its successor, Cargill Corporation through a series of land sales and donations. Many of these salt ponds remain in operation and produce salt used throughout the Western United States in food, agriculture, industry and medicine. The refuge pond support dense populations of brine shrimp, and therefore serving as feeding areas for waterfowl. In 2003, the US Fish & Wildlife Service and California Department of Fish & Game entered one of the largest private land purchases in American history, with the state and federal governments paying $100 million for 15,100 acres (65 km2) of salt ponds (which government appraisers valued at $243 million prior to the acquisition) in the south bay and 1,400 acres near the Napa River. SFBNWR and state biologists hope to restore some of the recently purchased ponds as tidal wetlands.
Aquatic mammals in the Bay Area
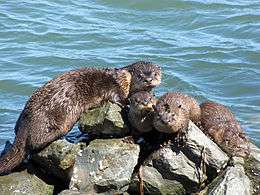

Aquatic mammals recently re-colonizing the Bay Area include the California golden beaver (Castor canadensis) which is now established on Alhambra Creek in Martinez, Napa River and Sonoma Creek; and North American river otter (Lontra canadensis) which was first reported in Redwood Creek at Muir Beach in 1996,[60] and recently in Corte Madera Creek, and in the south Bay on Coyote Creek,[61] as well as in 2010 in San Francisco Bay itself at the Richmond Marina. Sea otter (Enhydra lutris) were hunted to extinction in San Francisco Bay by about 1817. Historical records reveal that the Russian-American Company snuck Aleuts into San Francisco Bay multiple times, despite the Spanish capturing or shooting them while hunting sea otters in the estuaries of San Jose, San Mateo, San Bruno and around Angel Island.[62] The founder of Fort Ross, Ivan Kuskov, finding otter scarce on his second voyage to Bodega Bay in 1812, sent Russian ships and hired an American ship to hunt otter in the Bay, catching 1,160 sea otter in three months.[63]
Humphrey the Whale, a humpback whale (Megaptera novaeangliae), entered San Francisco Bay twice on errant migrations, and was successfully rescued and redirected each time in the late 1980s and early 1990s. This occurred again with Dawn and Delta a mother and calf in 2007.
Bottlenose dolphins and harbor porpoises have recently returned to the bay, having been absent for some 50 years. Historically, this was the northern extent of their warm-water species range. However, human development adversely impacted this habitat and pushed the species south to Monterey Bay. It is thought that laws limiting water pollution have improved the ecosystem health, allowing the return of cetacean marine life.[64]
Birds of the Bay Area
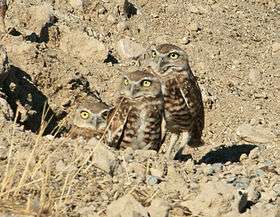
Western burrowing owls (Athene cunicularia) were listed as a species of special concern (a pre-listing category under the Endangered Species Act) by the California Department of Fish and Game in 1979. California's population declined 60% from the 1980s to the early '90s, and continues to decline at roughly 8% per year.[65] In 1994, the U.S. Fish and Wildlife Service nominated the western burrowing owl as a Federal Category 2 candidate for listing as endangered or threatened, but loss of habitat continues due to development of the flat, grassy lands used by the owl. A 1992–93 survey reported no breeding burrowing owls in Napa, Marin, and San Francisco counties, and only a few in San Mateo and Sonoma. The Santa Clara County population is declining and restricted to a few breeding locations, leaving only Alameda, Contra Costa, and Solano counties as the remnant breeding range.[66] Despite organized protests at Kiper Homes' Blue Ridge property in Antioch, California by Friends of East Bay Owls, one-way doors were installed in the birds' burrows so that the owl families could not return to their nests in early 2010.[67] In addition, in 2008, Mountain View, California evicted a pair of burrowing owls so that it could sell a parcel of land to Google to build a hotel at Shoreline Boulevard and Charleston Road.[68] Eviction of the owls is controversial because the birds regularly reuse burrows for years, and there is no requirement that suitable new habitat be found for the owls.
In March, 2012 a bald eagle (Haliaeetus leucocephalus) nest was reported on the northwest arm of Lower Crystal Springs Reservoir and upper San Mateo Creek. This is the first bald eagle breeding pair on the San Francisco Peninsula since 1915, when they nested in La Honda, almost one hundred years ago. The birds were once common in the Bay Area. While visiting Santa Clara County in 1855, physician naturalist James G. Cooper described "a nest of this bird large enough to fill a wagon, built in a large sycamore tree, standing alone in the prairie. Habitat destruction and thinning of eggs from (now banned) DDT poisoning reduced the California state population to 35 nesting pairs at their lowest point. In the 1980s re-introductions began with the Santa Cruz Predatory Bird Research Group and the San Francisco Zoo began importing birds and eggs from Vancouver Island and northeastern California in the late 1980s.[69]
Joseph Grinnell wrote in 1927 that osprey (Pandion haliaetus) were only rare visitors to the San Francisco Bay Area, although he noted records of one or two used nests in the broken tops of redwood trees along the Russian River.[70] In 1989, the southern breeding range of the osprey in the Bay Area was Kent Lake, although osprey were noted to be extending their range further south in the Central Valley and the Sierra Nevada.[71] However, in 2014 a Bay Area-wide survey found osprey had extended their breeding range southward with nesting sites as far south as Hunters Point in San Francisco on the west side and Hayward on the east side. Most nests were built on man-made structures close to areas of human disturbance, likely due to lack of mature trees near the Bay. Transfer of these birds to artificial nesting boxes away from human disturbance significantly increased nesting success.[72] The above 2014 survey omitted nesting sites in Santa Clara County in the Los Gatos Creek watershed photographed as early as 2004, indicating that the nesting range now includes the entire length of San Francisco Bay.[73]
The wild turkey population has increased greatly since their introduction during the ’60s and ’70s from other areas by game officials.[74] By 2015 they had become an everyday sight in the East Bay Area.[75]
Geology and landforms

Multiple terranes
The area is well known worldwide for the complexity of its landforms, the region being composed of at least six terranes (continental, seabed, or island arc fragments with distinct characteristics) pushed together over many millions of years by the forces of plate tectonics. Nine out of eleven distinct assemblages have been identified in a single county (Alameda).[76][77] Diverse assemblages adjoin in complex arrangements due to offsets along the many faults (both active and stable) in the area. As a consequence, many types of rock and soil are found in the region. Formations include the sedimentary rocks of sandstone, limestone, and shale in uplifted seabeds, metamorphic serpentine rock, coal deposits, and igneous forms such as basalt flows, rhyolite outcroppings, granite associated with the Salinian Block west of the San Andreas Fault, and ash deposits of extinct yet relatively recently active (10 million years) volcanos. Pleistocene-era fossils of mammals are abundantly present in some locations.
Vertical relief
The region has considerable vertical relief in its landscapes that are not in the alluvial plains leading to the bay or in inland valleys. In combination with the extensive water regions this has forced the fragmented development of urban and suburban regions and has led to extensive building on poor soils in the limited flatland areas and considerable expense in connecting the various subregions with roads, tunnels, and bridges.
Several mountains are associated with some of the many ridge and hill structures created by compressive forces between the Pacific Plate and the North American plate. These provide spectacular views (in appropriate weather) of large portions of the Bay Area and include Marin County's Mount Tamalpais at 2,571 feet (784 m). Contra Costa County's Mount Diablo at 3,849 feet (1,173 m), Alameda County's Mission Peak at 2,517 to 2,604 feet (767 to 776 m), and Santa Clara County's Mount Hamilton at 4,213 ft (1,284 m), the latter with significant astronomical studies performed at its crowning Lick Observatory. Though Tamalpais and Mission Peak are quite lower than the others, Tamalpais has no other peaks and few hills nearby. Mission Peak is coast facing and is an interior mountain and therefore has excellent views of both sides.
The three major ridge structures (part of the Pacific Coast Range) which are all roughly parallel to the major faultlines:
- The Santa Cruz Mountains along the San Francisco Peninsula and the Marin Hills in Marin County (San Andreas Fault)
- The Berkeley Hills, San Leandro Hills and their southern ridgeline extension through Mission Peak (Hayward Fault)
- The Diablo Range, which includes Mount Diablo and Mount Hamilton (Calaveras Fault)
Major waterways
- San Joaquin River
- Sacramento River
- Napa River
- Suisun Marsh
- Sonoma Creek
- Guadalupe River
- Coyote Creek
- Petaluma River
- San Pablo Creek
- Wildcat Creek
- Oakland Estuary
- Russian River
- San Lorenzo River
- San Lorenzo Creek
- Gulf of the Farallones
- Alameda Creek
Earthquake faults
The region is also traversed by six major slip-strike fault systems with hundreds of related faults, many of which are "sister faults" of the infamous San Andreas Fault, all of which are stressed by the relative motion between the Pacific Plate and the North American Plate or by compressive stresses between these plates. The fault systems include the Hayward Fault Zone, Concord-Green Valley Fault, Calaveras Fault, Clayton-Marsh Creek-Greenville Fault, and the San Gregorio Fault. Significant blind thrust faults (faults with near vertical motion and no surface ruptures) are associated with portions of the Santa Cruz Mountains and the northern reaches of the Diablo Range and Mount Diablo.
Natural hazards
Earthquakes
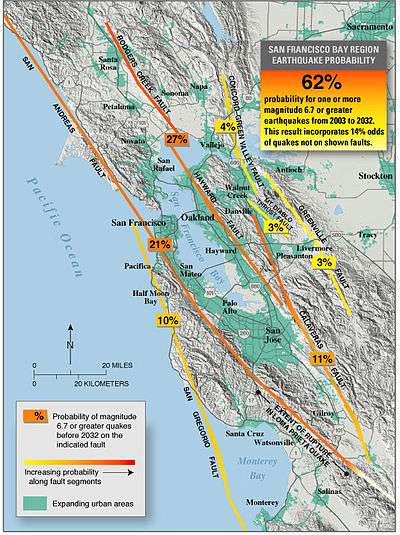
The region is particularly exposed to hazards associated with large earthquakes.[78][79] Two of the largest earthquakes in the area were the 1906 San Francisco earthquake and the 1989 Loma Prieta earthquake. The hazard from earthquakes is high in the Bay Area owing to a combination of factors:
- Numerous major active faults in the region.
- A combined thirty-year probability of a major earthquake in excess of seventy percent.
- Poorly responding native soil conditions in many places near the bay and in inland valleys, soils which amplify shaking as shown in the map to the right.
- Large areas of filled marshlands and bay mud that are significantly urbanized, with most subject to liquefaction, becoming unable to support structures.
- A large inventory of older buildings, many of which are expected to perform poorly in a major earthquake.
- Extensive building in areas subject to landslide, mudslide, and in some locations directly over active fault surface rubble zones.
- Most lowrise construction is not fireproof and water systems are likely to be extensively damaged and so large areas are subject to destruction by fire after a large earthquake.
- The coastal location makes the region vulnerable to Pacific Ocean tsunamis.[80]
Some of these hazards are being addressed by seismic retrofitting, education in household seismic safety, and even complete replacement of major structures such as the eastern span of the San Francisco–Oakland Bay Bridge.
For an article concerning a typical fault in the region and its associated hazards see Hayward Fault Zone. For projected ground movement after selecting a locality and a generating fault see this ABAG web page
Flooding
Some flooding occurs on local drainages under sustained wet conditions when the ground becomes saturated, more frequently in the North Bay area, which tends to receive substantially more rainfall than the South Bay. In one case, the Napa River drainage, floodplain developments are being purchased and removed and natural wetlands restored in the innovative Napa River Flood Project as the previous channelization of insufficient capacity around such developments was causing flooding problems upstream. Many of the local creeks have been channelized, although modern practice, and some restoration work includes returning the creeks to a natural state with dry stormwater bypasses constructed to handle flooding. While quite expensive, the restoration of a natural environment is of high priority in the intensively urbanized areas of the region.
Windstorms and wildfires
Typically between late November and early March, a very strong Pacific storm can bring both substantial rainfall (saturating and weakening soil) and strong wind gusts that can cause trees to fall on power lines. Owing to the wide area involved (sometimes hundreds of miles of coast), electrical service can be interrupted for up to several days in some more remote localities, but service is usually restored quickly in urban areas. These storms occasionally bring lightning & thunder. More rarely they even spawn tornadoes. For example, during the abnormal hurricane-like storm in early 2010, a funnel cloud sparked an extremely rare Tornado Warning in Morgan Hill.
In the spring and fall, strong offshore winds periodically develop. These winds are an especially dangerous fire hazard in the fall when vegetation is at its driest, as exemplified historically by the 1923 Berkeley Fire and the 1991 Oakland Firestorm.
Mudslides and landslides
Some geologically unstable areas have been extensively urbanized, and can become mobile due to changes in drainage patterns and grading created for development. These are usually confined to small areas, but there have been larger problems in the Santa Cruz Mountains.
Transportation
The Bay Area is served by several transportation systems, including three international airports (SFO, OAK, SJC), six major overlapping bus transit agencies (AC Transit, Muni, SamTrans, VTA, Golden Gate Transit, County Connection), and additional systems serving smaller areas. There are four rapid transit and regional rail systems including BART and Caltrain and two light rail systems (San Francisco Muni Metro and VTA Light-rail). There are also several regional rail lines provided by Amtrak, notably the Capitol Corridor. In addition to rail lines, there are multiple public and private ferry services (notably Golden Gate Ferry and Blue and Gold Fleet), which are being expanded by the San Francisco Bay Water Transit Authority. The regional ferry hub is San Francisco Ferry Building. AC Transit and some other agencies provide an extensive network of express "transbay" commuter buses from the suburbs to the San Francisco Transbay Terminal.
The freeway and highway system is very extensive; however, many freeways are congested particularly during rush hour, especially the two immediately adjacent trans-bay bridges (Golden Gate and Bay Bridge). Also, some city streets in San Francisco are the terminus where gaps occur in the system, partly the result of the Freeway Revolt (SF Board of Supervisors decisions made in 1959, 1964 and 1966), which prevented a freeway-only thorough fair through San Francisco between the San Francisco–Oakland Bay Bridge western terminus of (Interstate 80) with the southern terminus of the Golden Gate Bridge, and U.S. 101. Also, damages to the system in the 1989 Loma Prieta earthquake to several of the freeway structures that sparked the revolt were removed instead of being reinforced or rebuilt.
Higher education
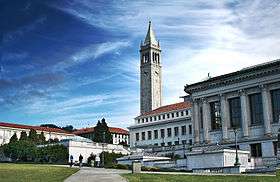
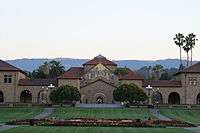
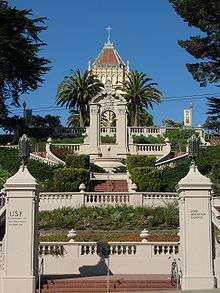
The region is home to many colleges and seminaries, most notably the University of California, Berkeley, the University of California, San Francisco and Stanford University. In addition, the Bay Area is home to two of the twenty-eight Jesuit universities in the U.S.: Santa Clara University (founded in 1851), and University of San Francisco (1855); these are also two of the three oldest California colleges. San Jose State University is the founding campus of the California State University (CSU) system, and is the oldest public institution of higher education on the West Coast of the United States.[81] Saint Mary's College of California was founded in 1863 by the Roman Catholic Archdiocese of San Francisco. In 2008, there were approximately 588,000 students enrolled in college or graduate school.[82] The San Francisco Bay Area population is near the top in the Nation for overall education level with approximately 41 percent of residents aged 25 years and over having a bachelor's degree or higher. The San Francisco and San Jose Primary Metropolitan Statistical Areas rank third and fourth in college graduates, ahead of Boston and behind only Boulder–Longmont, CO PMSA and Stamford–Norwalk, CT PMSA. The Oakland PMSA ranks eleventh.[83]


Culture
The Bay Area is host to numerous cultural events, including annual festivals and fairs. Many prominent writers make their homes there, and have developed a local literary culture, with a supportive network of booksellers, focused on the Northern California Independent Booksellers Association.
Art
Sports

- NCAA Division I College Sports
- California Golden Bears
- Saint Mary's College Gaels
- San Francisco Dons
- San Jose State Spartans
- Santa Clara Broncos
- Stanford Cardinal
Motorsports
- Also, Infineon Raceway (Sonoma, California) is a motorsport track which currently hosts NASCAR Sprint Cup Series and IndyCar Series races.
Music
Classic rock
San Francisco proper was headquarters for the hippie counterculture of the 1960s and the music scene that became associated with it. One of the area's most notable acts was The Grateful Dead, formed in 1965, who played regularly at the legendary venue The Fillmore Auditorium. Other local artists in that movement included Jefferson Airplane and Janis Joplin; all three would be closely associated with the 1967 Summer of Love. Jimi Hendrix, although born in Seattle and later a resident of London, England, had strong connections to the movement and the metropolitan Bay area, as he lived in Berkeley for a brief time as a child and played many local venues in that decade. Creedence Clearwater Revival (of El Cerrito) would gain traction as an associated band of the anti-Vietnam war movement. Rock and Roll Hall of Fame legend Neil Young has lived in the Bay Area in La Honda, CA for more than 40 years. Carlos Santana from San Francisco became famous in the late 1960s and early 1970s with his Santana band which pioneered a blend of rock, salsa, and jazz fusion. Journey formed in 1973 in San Francisco, by former members of Santana. The Doobie Brothers, from San Jose, had a successful career with several albums earning RIAA gold certification. The early 1970s sounds of the Tower of Power from Oakland, Sly and the Family Stone and Pablo Cruise all came from the Bay Area.
Heavy metal
During the 1980s and early 1990s, the Bay Area was home to one of the largest and most influential thrash metal scenes in the world, containing acts like Metallica (although Metallica had initially formed in Los Angeles, it was not until their relocation to El Cerrito in 1983 that Cliff Burton and Kirk Hammett joined as bassist and lead guitarist), Exodus, Laaz Rockit, Death Angel, Vio-lence, Forbidden, and Testament.
Many death metal bands had also formed in the area, including Autopsy, Possessed (considered one of the first in the genre), and in the '90s, Impaled, Exhumed and Vile.
Also, an avant-garde metal scene has emerged in the Bay Area with bands such as Giant Squid, Grayceon, and Ludicra.[84]
Sludge band Neurosis and groove metal/post-thrash bands Machine Head and Skinlab formed in Oakland. In the alternative metal and nu metal scenes worldwide, Faith No More (from San Francisco) and Primus (from El Sobrante, and featuring former Possessed guitarist Larry LaLonde) have been considered progenitors to both subgenres.[85][86]
Heavy metal/hard rock icon Joe Satriani also hails from the Bay Area (Berkeley).
Alternative rock
Many bands of the 1990s post-grunge era started and still reside in the Bay Area, including Third Eye Blind (of San Francisco), Counting Crows (of Berkeley) and Smash Mouth (of San Jose), all of whom have received extensive radio play across the world and released multi-platinum records during their career.
Punk
The Bay Area saw a large punk movement from the 1970s to the present. Bands such as the Dead Kennedys, The Avengers, Flipper, D.R.I., M.D.C. and Operation Ivy were popular in the '70s and '80s, with later bands such as Rancid, Green Day and AFI all coming out of Berkeley. The Dwarves are residents of San Francisco, and are considered to be pioneers of the punk and hardcore movement.
Rap and hip hop
The Bay Area is the home of the hyphy movement, which started in the early to mid-'90s. The genre which was pioneered by rappers Andre "Mac Dre" Hicks, Too Short, Keak Da Sneak, Mistah Fab, E-40, DJ King Assassin and Yukmouth, is now becoming more popular throughout the world. Hyphy themes such as ghost riding, thizzin' and going dumb are now common in other parts of the country. The Bay Area was also home to rap legend Tupac Shakur who lived in Marin City, about 5 miles (8.0 km) north of San Francisco. The rap group Digital Underground originally hailed from Oakland. MC Hammer, and the Hieroglyphics hip hop crew, which is composed of local artists including the Souls of Mischief and Del tha Funkee Homosapien. Cindy Herron of En'Vogue attended Balboa High School in the late 1970s.
Media
The Bay Area is one of the largest media markets in the United States.
According to Nielsen Media Research, the Bay Area ranks (as of the 2005–2006 television season) as the nation's sixth-largest "Designated Market Area (DMA)", with 2,355,740 "TV Homes", representing 2.137% of the United States Total.
The major newspapers are the San Francisco Chronicle and the San Jose Mercury News. Local television channels include KTVU 2 (FOX), KRON-TV 4 (myNetworkTV), KPIX 5 (CBS), KGO-TV 7 (ABC), KQED-TV 9 (PBS), KNTV 11 (NBC), KBCW 44/45 (CW), KQEH 54 (PBS), and KKPX 65 (Ion). Radio stations serving the area include: KQED-FM, KMVQ, KOSF, and KGO-AM.
Regional counties, cities, and suburbs
Counties
- Alameda County (737 sq. mi., excluding water)
- Contra Costa County (720 sq. mi., excluding water)
- Marin County (520 sq. mi., excluding water)
- Napa County (754 sq. mi., excluding water)
- San Francisco County (47 sq. mi., excluding water)
- San Mateo County (449 sq. mi., excluding water)
- Santa Clara County (1,291 sq. mi., excluding water)
- Solano County (829 sq. mi., excluding water)
- Sonoma County (1,576 sq. mi., excluding water)
Cities and towns
See also
- Coastal California
- Ecology of the San Francisco Estuary
- Islands of San Francisco Bay
- List of companies based in the San Francisco Bay Area
- List of metropolitan areas of the United States
- Lists of San Francisco Bay Area topics
- Timeline of the San Francisco Bay Area
References
- 1 2 3 4 "Annual Estimates of the Resident Population for Counties: April 1, 2010 to July 1, 2015". 2015 Population Estimates. United States Census Bureau, Population Division. March 2016. Retrieved April 1, 2016.
- 1 2 "Combined Statistical Area Totals Dataset: Population and Estimated Components of Change: April 1, 2010 to July 1, 2015" (CSV). 2015 Population Estimates. United States Census Bureau, Population Division. March 2016. Retrieved April 1, 2016.
- 1 2 "San Francisco Bay Area Vision Project". Bayareavision.org. Retrieved November 4, 2011.
- ↑ "The Association of Bay Area Governments". Abag.ca.gov. April 14, 2011. Retrieved November 4, 2011.
- 1 2 "OMB Bulletin No. 13-01: Revised Delineations of Metropolitan Statistical Areas, Micropolitan Statistical Areas, and Combined Statistical Areas, and Guidance on Uses of the Delineations of These Areas" (PDF). United States Office of Management and Budget. February 28, 2013. Retrieved April 17, 2013.
- 1 2 "US Census Bureau, household and per capita income during the 2000 Census in metro areas". Retrieved June 1, 2007.
- ↑ "SF Chronicle, most democratic voting bloc in the state, 2003". The San Francisco Chronicle. October 8, 2003. Retrieved June 12, 2007.
- ↑ http://www.nytimes.com/interactive/2012/05/31/us/education-in-metro-areas.html?_r=0
- ↑ "San Francisco Tops List Of Cities With Most College Degrees (CHART)". The Huffington Post.
- ↑ Fagan, Kevin (September 22, 2011). "Bay Area income beats state, U.S., census shows". SFGate. Retrieved 10 March 2014.
- ↑ Sulek, Julia Prodis. "California report: Bay Area population gains are strongest in state". San Jose Mercury News. Retrieved 10 March 2014.
- ↑ Crawford, Sabrina (2006-01-31). Newcomer's Handbook for Moving to And Living in the San Francisco Bay Area: Including San Jose, Oakland, Berkeley, And Palo Alto. First Books. pp. 130–. ISBN 978-0-912301-63-1. Retrieved 9 February 2013.
- ↑ Inc., Active Interest Media, (June 1987). Old-House Journal. Active Interest Media, Inc. pp. 18–. Retrieved 9 February 2013.
- ↑ Cass, Maxine (2009-07-01). Northern California Off the Beaten Path: A Guide to Unique Places. Globe Pequot. pp. 55–. ISBN 978-0-7627-5597-4. Retrieved 9 February 2013.
- 1 2 Young, T. (2004). "Building San Francisco's parks", 1850-1930, Baltimore: Johns Hopkins University Press
- ↑ "Office of the Mayor : Mayor Lee Announces U.S. Census Bureau Results for San Francisco Population". Sfmayor.org. Retrieved November 4, 2011.
- ↑ Eaves, Elisabeth (December 3, 2007). "America's Greediest Cities". Forbes.
- ↑ "Santa Clara Valley Transportation Authority". Vta.org. Retrieved November 4, 2011.
- ↑ California High-Speed Trains: Visual Tour on YouTube
- ↑ Regional Water Quality Control Board, San Francisco Bay Region (2) Boundaries. Retrieved 2007-02-20. Archived December 31, 2006, at the Wayback Machine.
- ↑ "Find a park – San Francisco Bay Area Region". California State Parks. Retrieved June 20, 2006.
- ↑ http://www.visitcalifornia.com/media/pages/getting_around/maps/SAN-FRANCISCO.pdf
- ↑ "Homeless Population Rises In Santa Cruz Co., Decreases In Santa Clara Co. « CBS San Francisco". Sanfrancisco.cbslocal.com. July 27, 2011. Retrieved November 4, 2011.
- ↑ Preuitt, Lori (August 9, 2010). "Earthquake Shakes Aromas". NBC Bay Area. Retrieved November 4, 2011.
- ↑ "South Bay, San Jose and Silicon Valley Local News | abc7news.com". Abclocal.go.com. November 5, 2009. Retrieved November 4, 2011.
- ↑ "Where In The Bay Can I See Fireworks?". Radioalice.radio.com. June 30, 2011. Retrieved November 4, 2011.
- ↑ "Fortune 500 2010: Annual ranking of America's largest corporations from Fortune Magazine". CNN. Retrieved August 11, 2010.
- ↑ "SF Chronicle, most democratic voting bloc in the state, 2003". The San Francisco Chronicle. October 8, 2003. Retrieved June 12, 2007.
- ↑ "North American Container Traffic, 2009 Port Ranking" (PDF). Retrieved August 11, 2010.
- ↑ Silvio Marcacci (2013-06-05). "California and Cleantech". The Energy Collective. Retrieved 2013-07-08.
- ↑
- 1 2 "Metropolitan and Micropolitan Statistical Area Totals Dataset: Population and Estimated Components of Change: April 1, 2010 to July 1, 2015" (CSV). 2015 Population Estimates. United States Census Bureau, Population Division. March 2016. Retrieved April 1, 2016.
- 1 2 3 4 5 6 7 "Bay Area Census – Bay Area Data". Bayareacensus.ca.gov. Retrieved November 4, 2011.
- ↑ "Census 2010: Table 3A – Total Population by Race (Hispanic exclusive) and Hispanic or Latino: 2010" (Excel). California Department of Finance. Retrieved June 11, 2010.
- ↑ Willet, Megan (July 8, 2013). "The Most Diverse Cities in United States". Business Insider. Retrieved September 11, 2014.
- ↑ "Training and Education /PET". Filipino-American Law Enforcement Officers Association. Retrieved April 28, 2012.
- ↑ Estrella, Cicero A. (February 2004). "S.F.'s 'Little Saigon' / Stretch of Larkin Street named for Vietnamese Americans". San Francisco Chronicle. Retrieved March 6, 2010.
- ↑ "South Park, Santa Rosa's vibrant, ever-changing corner". The Press Democrat. Retrieved July 8, 2011.
- ↑ "Judaism (estimated) Metro Areas (2000)". The Association of Religion Data Archives. Retrieved December 1, 2009.
- ↑ "Pleasanton tops county in median household income". Inside Bay Area. Archived from the original on June 6, 2011. Retrieved October 15, 2006.
- ↑ DeBare, Ilana (March 6, 2008). "47 Bay Area billionaires on Forbes list". The San Francisco Chronicle.
- ↑ "Capgemini Announces 2010 U.S. Metro Wealth Index". Business Wire. August 3, 2010. Retrieved November 4, 2011.
- ↑ "Fortune". Fortune. Retrieved May 24, 2011.
- ↑ "2010 Census Summary File 1". 2010 United States Census. United States Census Bureau. Retrieved September 1, 2013.
- 1 2 "2012 California Presidential Election Results by County" (PDF). Retrieved September 1, 2013.
- 1 2 "2011 American Community Survey 1-Year Estimates". 2011 American Community Survey. United States Census Bureau. Retrieved September 1, 2013.
- ↑ "Report of Registration" (PDF). California Secretary of State. February 10, 2013. Retrieved January 20, 2014.
- ↑ "Partisan Voting Index Districts of the 113th Congress" (PDF). Cook Political Report. Retrieved September 1, 2013.
- ↑ "My Congressional District". United States Census Bureau. Retrieved September 1, 2013.
- ↑ Kevin Starr (February 27, 2005). "Keep California the 'Gibraltar of the Pacific'". San Diego Union Tribune. Retrieved May 16, 2011.
- ↑ Jane Gross (March 14, 1993). "Spared 2 Base Closings, Californians Lobby On". New York Times. Retrieved May 16, 2011.
- ↑ "Base-closing plan spares Beale, Travis". Sacramento Business Journal. May 13, 2005. Retrieved May 16, 2011.
- ↑ Conaway CH; Black FJ; Grieb TM; Roy S; Flegal AR (2008). "Mercury in the San Francisco Estuary". Rev Environ Contam Toxicol. Reviews of Environmental Contamination and Toxicology. 194: 29–54. doi:10.1007/978-0-387-74816-0_2. ISBN 978-0-387-74815-3. PMID 18069645.
- ↑ Eric Bailey (November 9, 2007). "Oil oozes in S.F. Bay after ship hits bridge". Los Angeles Times. Retrieved Feb 15, 2010.
- ↑ Central California Coast Steelhead DPS (Report). NOAA's National Marine Fisheries Service Northwest Regional Office. Retrieved Feb 15, 2010.
- ↑ "Map showing endangered species status of west coast steelhead". Alameda Creek Alliance. Retrieved Feb 14, 2010.
- 1 2 Greg Miller (January 2010). "In Central California, Coho Salmon Are on the Brink". Science. 327 (5965): 512–3. doi:10.1126/science.327.5965.512. PMID 20110475. Retrieved Feb 15, 2010.
- ↑ Central California Coast Coho ESU (Report). NOAA's National Marine Fisheries Service Northwest Regional Office. Retrieved Feb 15, 2010.
- ↑ Donna Whitmarsh (Jan 2010). "California Coho Salmon In Dire Straits". Bay Nature.
- ↑ "Get Outside!". San Francisco Chronicle. April 1966. Archived from the original on June 30, 2009. Retrieved March 6, 2011.
- ↑ "Blue Oak Ranch Reserve". University of California. Retrieved March 6, 2011.
- ↑ Adele Ogden (1975). The California sea otter trade, 1784–1848. Berkeley, California: University of California Press. p. 54. ISBN 978-0-520-02806-7. Retrieved March 6, 2011.
- ↑ Hubert Howe Bancroft; Alfred Bates; Ivan Petroff; William Nemos (1887). History of Alaska: 1730–1885. San Francisco, California: A. L. Bancroft & company. p. 482. Retrieved March 6, 2011.
- ↑ "Home Page". GOLDEN GATE CETACEAN RESEARCH. Retrieved 2016-06-13.
- ↑ Rendon, JIm (Nov–Dec 1999). "Owl Be Damned:Developers plow into the homes of the burrowing owl". Metro, Silicon Valley's Weekly Newspaper.
- ↑ Joe Eaton (Jan 14, 2010). "Wild Neighbors: Antioch Owls Face Evicition". Berkeley Daily Planet. Retrieved Jan 14, 2010.
- ↑ Katherine Tam (Jan 3, 2010). "Owl advocates protest birds relocation". Contra Costa Times. Retrieved Jan 3, 2010.
- ↑ DeBolt, Daniel (January 10, 2008). "Burrowing Owls vs. Google:Pair of birds found on Google's hotel site will cost city $150,000". Mountain View Voice.
- ↑ Lisa M. Krieger (2012-03-23). "Eagles reappear in San Mateo County after nearly century absence". San Jose Mercury News. Retrieved 2012-03-25.
- ↑ Grinnell, J., and Wythe, M. W. (1927). "Directory to the bird-life of the San Francisco Bay region". Pacific Coast Avifauna. 18. Retrieved May 22, 2016.
- ↑ Henny, C. J., and Anthony, R. G. (1989). B. G. Pendleton, ed. "Bald Eagle and Osprey, in Proceedings of the Western Raptor Management Symposium and Workshop". National Wildlife Federation Scientific and Technical Series. 12: 66–82.
- ↑ Anthony J. Brake; Harvey A. Wilson; Robin Leong & Allen M. Fish (September 2014). "Status of Ospreys Nesting on San Francisco Bay" (PDF). Western Birds. 45 (3): 190–198. Retrieved May 22, 2016.
- ↑ William G. Bousman (1 January 2007). Breeding Bird Atlas of Santa Clara County, California. Santa Clara Valley Audubon Society. ISBN 978-0-9796038-0-8.
- ↑ California Department of Fish and Game. Wild Turkey Guide 2005.
- ↑ Rubio, Tena (November 27, 2015). "Like It or Not, Wild Turkeys Proliferate in East Bay". kqed.org. Retrieved 27 November 2015.
- ↑ Alameda County geologic map USGS publication
- ↑ Preliminary geologic map emphasizing bedrock formations in Alameda County, California: A digital database USGS Publication (Geologic explanation of map noted above)
- ↑ Expiration: 11.09.11. "Maps and information about Bay Area threats including earthquakes, landslides, and tsunamis.". Quake.abag.ca.gov. Retrieved November 4, 2011.
- ↑ "Earthquake Setting of the San Francisco Bay Area". usgs.gov.
- ↑ Describes Bay Area damage from 1960 tsunami. Archived May 5, 2011, at WebCite
- ↑ "University Archives – SJSU Special Collections & Archives – SJSU Subject Guides (LibGuides) at San Jose State University Library". Libguides.sjsu.edu. September 22, 2011. Retrieved November 4, 2011.
- ↑ "American Community Survey: 2006–2008 American Community Survey 3-Year Estimates: S1401. School Enrollment: San Jose-San Francisco-Oakland CSA". U.S. Census Bureau. Retrieved October 21, 2010.
- ↑ 2002 American Community Survey, SELECTED POPULATION CHARACTERISTICIS FOR LARGE METROPOLITAN AREAS. Retrieved November 5, 2007.
- ↑ Smith, Chris (July 2011). "Rehab of a strung-out musical scene". San Francisco Magazine. Retrieved 7 August 2011.; Smith, Chris (6 July 2011). "Our avant-garde metal scene". ca-smith.net. Retrieved 7 August 2011.
- ↑ Essi Berelian (2005), The Rough Guide to Heavy Metal, p. 259, "Faith No More must be counted among the pioneers [of nu metal]"
- ↑ Joel McIver (2002), NU-METAL- The Next Generation Of Rock & Punk
External links
| Wikimedia Commons has media related to San Francisco Bay Area. |
- sfbaywildlife.info Guide to wildlife-watching in the San Francisco Bay Area
- Travel
-
 San Francisco Bay Area travel guide from Wikivoyage
 - World War II in the San Francisco Bay Area, a National Park Service Discover Our Shared Heritage Travel Itinerary
| Bodies of water |
| |
|---|---|---|
| Counties | ||
| Major cities | ||
| Cities and towns 100k–250k | ||
| Cities and towns 50k–99k | ||
| Cities and towns 25k-50k | ||
| Cities and towns 10k–25k |
| |
| Sub-regions | ||
Coordinates: 37°45′N 122°17′W / 37.750°N 122.283°W