United States presidential election, 1936
| | |||||||||||||||||||||||||||||||||||||||||||
| |||||||||||||||||||||||||||||||||||||||||||
| |||||||||||||||||||||||||||||||||||||||||||
|
| |||||||||||||||||||||||||||||||||||||||||||
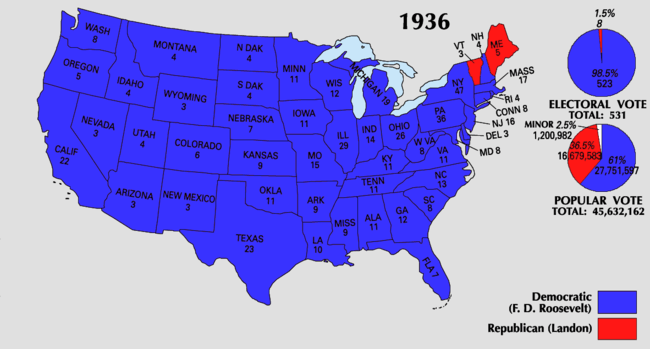
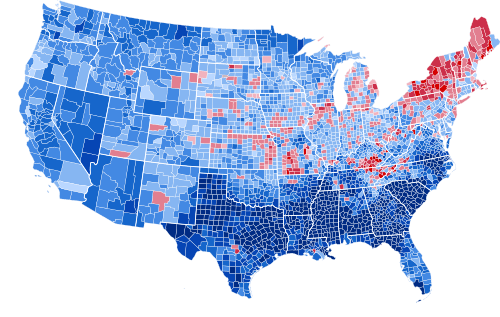
| Presidential election results map. Blue denotes those won by Roosevelt/Garner, red denotes states won by Landon/Knox. Numbers indicate the number of electoral votes allotted to each state. | |||||||||||||||||||||||||||||||||||||||||||
| |||||||||||||||||||||||||||||||||||||||||||

The United States presidential election of 1936 was the 38th quadrennial presidential election, held on Tuesday, November 3, 1936. In terms of electoral votes, it was the most lopsided presidential election in the history of the United States. In terms of the popular vote, it was the second-biggest victory for the winner since the election of 1820, which was not seriously contested.
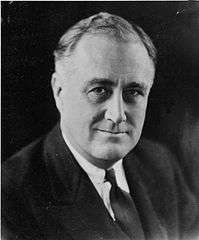
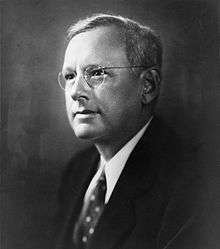
The election took place as the Great Depression entered its eighth year. Incumbent President and Democratic candidate Franklin D. Roosevelt was still working to push the provisions of his New Deal economic policy through Congress and the courts. However, the New Deal policies he had already enacted, such as Social Security and unemployment benefits, had proven to be highly popular with most Americans. Roosevelt's Republican opponent was Governor Alf Landon of Kansas, a political moderate.
Although some political pundits predicted a close race, Roosevelt went on to win the greatest electoral landslide since the beginning of the current two-party system in the 1850s. Roosevelt carried every state except Maine and Vermont, which together could only return 8 electoral votes. By winning 523 electoral votes, Roosevelt received 98.49% of the electoral vote total, the highest percentage since the uncontested election of 1820. Roosevelt also won the largest number of electoral votes recorded at that time, only surpassed by Ronald Reagan in the election of 1984, when there were seven more electoral votes available to contest. In addition, Roosevelt won 60.8% of the national popular vote, the second highest popular-vote percentage won (the highest percentage was won by Lyndon B. Johnson in 1964) and margin of victory (to Warren Harding's 26.2-point popular vote win in 1920) since 1820.
Nominations
Democratic Party nomination

President Roosevelt faced only one primary opponent other than various favorite sons. Henry Skillman Breckinridge, an anti-New Deal lawyer from New York, filed to run against Roosevelt in four primaries. Breckinridge's challenge of the popularity of the New Deal among Democrats failed miserably. In New Jersey, President Roosevelt did not file for the preference vote and lost that primary to Breckinridge, even though he did receive 19% of the vote on write-ins. Roosevelt's candidates for delegates swept the race in New Jersey and elsewhere. In other primaries, Breckinridge's best showing was 15% in Maryland. Overall, Roosevelt received 93% of the primary vote, compared to 2% for Breckinridge.[2]
The Democratic Party Convention was held in Philadelphia between July 23 and 27. The delegates unanimously re-nominated incumbents President Roosevelt and Vice-President John Nance Garner. At Roosevelt's request, the two-thirds rule, which had given the South a veto power, was repealed.
| Presidential ballot | Vice-presidential ballot | ||
|---|---|---|---|
| Franklin D. Roosevelt | 1100 | John Nance Garner | 1100 |
Republican Party nomination
-
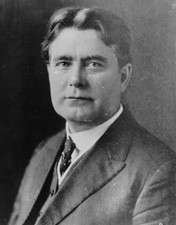
Senator William Borah from Idaho
-
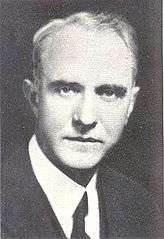
Publisher Frank Knox from Illinois
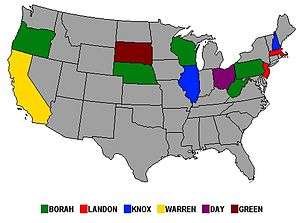
The 1936 Republican National Convention was held in Cleveland, Ohio, between June 9 and 12. Although many candidates sought the Republican nomination, only two, Governor Landon and Senator William Borah from Idaho, were considered to be serious candidates. While favorite sons County Attorney Earl Warren from California, Governor Warren Green of South Dakota, and Stephen A. Day from Ohio won their respective primaries, the 70-year-old Borah, a well-known progressive and "insurgent," won the Wisconsin, Nebraska, Pennsylvania, West Virginia, and Oregon primaries, while also performing quite strongly in Knox's Illinois and Green's South Dakota. The party machinery, however, almost uniformly backed Landon, a wealthy businessman and centrist, who won primaries in Massachusetts and New Jersey and dominated in the caucuses and at state party conventions.
With Knox withdrawing to become Landon's selection for vice-president (after the rejection of New Hampshire Governor Styles Bridges) and Day, Green, and Warren releasing their delegates, the tally at the convention was as follows:
- Alf Landon 984
- William Borah 19
Other nominations
Many people expected Huey Long, the colorful Democratic senator from Louisiana, to run as a third-party candidate with his "Share Our Wealth" program as his platform. However, he was assassinated in September 1935. Some historians, including Long biographer T. Harry Williams, contend that Long had never, in fact, intended to run for the presidency in 1936. Instead, he had been plotting with Father Charles Coughlin, a Catholic priest and populist talk radio personality, to run someone else on the soon-to-be-formed "Share Our Wealth" Party ticket. According to Williams, the idea was that this candidate would split the left-wing vote with President Roosevelt, thereby electing a Republican president and proving the electoral appeal of Share Our Wealth. Long would then wait four years and run for president as a Democrat in 1940.
Prior to Long's death, leading contenders for the role of the sacrificial 1936 candidate included Senators Burton K. Wheeler (D-Montana) and William Borah, and Governor Floyd B. Olson of the Minnesota Farmer–Labor Party. After the assassination, however, the two senators lost interest in the idea; Olson was diagnosed with terminal stomach cancer.
Father Coughlin, who had allied himself with Dr. Francis Townsend, a left-wing political activist who was pushing for the creation of an old-age pension system, and Rev. Gerald L. K. Smith, was eventually forced to run Representative William Lemke (R-North Dakota) as the candidate of the newly created "Union Party". Lemke, who lacked the charisma and national stature of the other potential candidates, fared poorly in the election, barely managing 2% of the vote, and the party was dissolved the following year.
William Dudley Pelley, Chief of the Silver Shirts Legion, ran on the ballot for the Christian Party in Washington State, but won fewer than 2,000 votes.
General election
Campaign

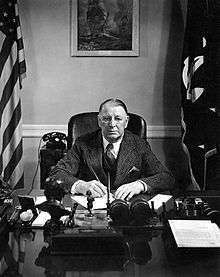
Landon proved to be an ineffective campaigner who rarely traveled. Most of the attacks on FDR and Social Security were developed by Republican campaigners rather than Landon himself. In the two months after his nomination he made no campaign appearances. Columnist Westbrook Pegler lampooned, "Considerable mystery surrounds the disappearance of Alfred M. Landon of Topeka, Kansas.... The Missing Persons Bureau has sent out an alarm bulletin bearing Mr. Landon's photograph and other particulars, and anyone having information of his whereabouts is asked to communicate direct with the Republican National Committee."
Landon respected and admired Roosevelt and accepted much of the New Deal but objected that it was hostile to business and involved too much waste and inefficiency. Late in the campaign, Landon accused Roosevelt of corruption – that is, of acquiring so much power that he was subverting the Constitution:
The President spoke truly when he boasted... "We have built up new instruments of public power." He spoke truly when he said these instruments could provide "shackles for the liberties of the people... and... enslavement for the public". These powers were granted with the understanding that they were only temporary. But after the powers had been obtained, and after the emergency was clearly over, we were told that another emergency would be created if the power was given up. In other words, the concentration of power in the hands of the President was not a question of temporary emergency. It was a question of permanent national policy. In my opinion the emergency of 1933 was a mere excuse.... National economic planning—the term used by this Administration to describe its policy—violates the basic ideals of the American system.... The price of economic planning is the loss of economic freedom. And economic freedom and personal liberty go hand in hand.
This election is notable for The Literary Digest poll, which was based on 10 million questionnaires mailed to readers and potential readers; 2.3 million were returned. The Literary Digest, which had correctly predicted the winner of the last 5 elections, announced in its October 31 issue that Landon would be the winner with 370 electoral votes. The cause of this mistake has often been attributed to improper sampling: more Republicans subscribed to the Literary Digest than Democrats, and were thus more likely to vote for Landon than Roosevelt. However, a 1976 article in The American Statistician demonstrates that the actual reason for the error was that the Literary Digest relied on voluntary responses. As the article explains, the 2.3 million "respondents who returned their questionnaires represented only that subset of the population with a relatively intense interest in the subject at hand, and as such constitute in no sense a random sample... it seems clear that the minority of anti-Roosevelt voters felt more strongly about the election than did the pro-Roosevelt majority."[3] A more detailed study in 1988 showed that both the initial sample and non-response bias were contributing factors, and that the error due to the initial sample taken alone would not have been sufficient to predict the Landon victory.[4] This mistake by the Literary Digest proved to be devastating to the magazine's credibility and it ceased publishing within a few months of the election.
That same year, George Gallup, an advertising executive who had begun a scientific poll, predicted that Roosevelt would win the election, based on a quota sample of 50,000 people. He also predicted that the Literary Digest would mis-predict the results. His correct predictions made public opinion polling a critical element of elections for journalists and indeed for politicians. The Gallup Poll would become a staple of future presidential elections, and remains one of the most prominent election polling organizations.
Results
Roosevelt won in a landslide, carrying 46 of the then-48 states and bringing in many additional Democratic members of Congress. After Lyndon B. Johnson's 61.1% share of the popular vote in 1964, Roosevelt's 60.8% is the second-largest percentage in U.S. history since the nearly unopposed election of James Monroe in 1820, and his 98.5% of the electoral vote is the highest in two-party competition. Roosevelt won the largest number of electoral votes ever recorded at that time, so far only surpassed by Ronald Reagan in 1984, when seven more electoral votes were available to contest. Garner won the highest percentage of the electoral vote of any vice president. Landon became the second official major-party candidate since the current system was established to win fewer than ten electoral votes by tying William Howard Taft, who won eight votes in his unsuccessful re-election campaign in 1912. No major-party candidate has won so few electoral votes since this election. The closest anyone has come was Reagan's 1984 opponent Walter Mondale, who only won 13 electoral votes.
Of the 3,095 counties/independent cities making returns, Roosevelt won in 2,634 (85.11%) while Landon carried 461 (14.89%).
Some political pundits predicted the Republicans, whom many voters blamed for the Great Depression, would soon become an extinct political party. However, the Republicans would make a strong comeback in the 1938 congressional elections and would remain a potent force in Congress, although they were not able to win the presidency again until 1952.
The Electoral College results, in which Landon only won Maine and Vermont, inspired Democratic Party chairman James Farley, who had in fact declared during the campaign that Roosevelt was to lose only these two states, to amend the then-conventional political wisdom of "As Maine goes, so goes the nation" into "As goes Maine, so goes Vermont." Additionally, a prankster posted a sign on Vermont's border with New Hampshire the day after the 1936 election, reading, "You are now leaving the United States." Some of Roosevelt's advisers even joked that America's fiscal woes might be best solved if he offered to sell Vermont and Maine to Canada.
As of 2012, even after many years as a classic "blue" state that usually supports Democratic presidential candidates, Vermont has voted for more Republican presidential nominees than any other state. From 1856 through 1960, Vermont gave the state's electoral votes to the Republican Party nominee in every presidential election. No other state has voted so many times in a row for candidates of the same political party. Maine once held a similar political record. From 1856 through 1960, Maine voted for the Republican candidate in every presidential election but one (in 1912, the state gave Democrat Woodrow Wilson a plurality with 39.43% of the vote). Another state that had been reliably Republican for a very long time up to 1936 was Pennsylvania. Roosevelt was the first Democrat to carry Pennsylvania since "favorite son" James Buchanan did so in 1856.
| Presidential candidate | Party | Home state | Popular vote | Electoral vote |
Running mate | |||
|---|---|---|---|---|---|---|---|---|
| Count | Pct | Vice-presidential candidate | Home state | Elect. vote | ||||
| Franklin D. Roosevelt (Incumbent) | Democratic | New York | 27,752,648 | 60.80% | 523 | John Nance Garner (Incumbent) | Texas | 523 |
| Alf Landon | Republican | Kansas | 16,681,862 | 36.54% | 8 | Frank Knox | Illinois | 8 |
| William Lemke | Union | North Dakota | 892,378 | 1.95% | 0 | Thomas C. O'Brien | Massachusetts | 0 |
| Norman Thomas | Socialist | New York | 187,910 | 0.41% | 0 | George A. Nelson | Wisconsin | 0 |
| Earl Browder | Communist | Kansas | 79,315 | 0.17% | 0 | James W. Ford | New York | 0 |
| D. Leigh Colvin | Prohibition | New York | 37,646 | 0.08% | 0 | Claude A. Watson | California | 0 |
| John W. Aiken | Socialist Labor | Connecticut | 12,799 | 0.03% | 0 | Emil F. Teichert | New York | 0 |
| Other | 3,141 | 0.00% | — | Other | — | |||
| Total | 45,647,699 | 100% | 531 | 531 | ||||
| Needed to win | 266 | 266 | ||||||
Source (Popular Vote): Leip, David. "1936 Presidential Election Results". Dave Leip's Atlas of U.S. Presidential Elections. Retrieved July 31, 2005.
Source (Electoral Vote): "Electoral College Box Scores 1789–1996". National Archives and Records Administration. Retrieved July 31, 2005.
Geography of Results
-
Results by county, shaded according to winning candidate's percentage of the vote
Cartographic Gallery
-
Presidential election results by county.
-
Democratic presidential election results by county.
-
Republican presidential election results by county.
-

"Other" presidential election results by county.
-

American Labor presidential election results by county.
-
Cartogram of presidential election results by county.
-

Cartogram of Democratic presidential election results by county.
-
Cartogram of Republican presidential election results by county.
-
Cartogram of "Other" presidential election results by county.
-

Cartogram of American Labor presidential election results by county.
Results by state
| States won by Roosevelt/Garner |
| States won by Landon/Knox |
| Franklin D. Roosevelt Democratic |
Alfred Landon Republican |
William Lemke Union |
Norman Thomas Socialist |
Other | Margin | State Total | ||||||||||||||
|---|---|---|---|---|---|---|---|---|---|---|---|---|---|---|---|---|---|---|---|---|
| State | electoral votes |
# | % | electoral votes |
# | % | electoral votes |
# | % | electoral votes |
# | % | electoral votes |
# | % | electoral votes |
# | % | # | |
| Alabama | 11 | 238,136 | 86.38 | 11 | 35,358 | 12.82 | - | 551 | 0.20 | - | 242 | 0.09 | - | 1,397 | 0.51 | - | 202,838 | 73.56 | 275,244 | AL |
| Arizona | 3 | 86,722 | 69.85 | 3 | 33,433 | 26.93 | - | 3,307 | 2.66 | - | 317 | 0.26 | - | 384 | 0.31 | - | 53,289 | 42.92 | 124,163 | AZ |
| Arkansas | 9 | 146,765 | 81.80 | 9 | 32,039 | 17.86 | - | 4 | 0.00 | - | 446 | 0.25 | - | 169 | 0.09 | - | 114,726 | 63.94 | 179,423 | AR |
| California | 22 | 1,766,836 | 66.95 | 22 | 836,431 | 31.70 | - | - | - | - | 11,331 | 0.43 | - | 24,284 | 0.92 | - | 930,405 | 35.26 | 2,638,882 | CA |
| Colorado | 6 | 295,021 | 60.37 | 6 | 181,267 | 37.09 | - | 9,962 | 2.04 | - | 1,593 | 0.33 | - | 841 | 0.17 | - | 113,754 | 23.28 | 488,684 | CO |
| Connecticut | 8 | 382,129 | 55.32 | 8 | 278,685 | 40.35 | - | 21,805 | 3.16 | - | 5,683 | 0.82 | - | 2,421 | 0.35 | - | 103,444 | 14.98 | 690,723 | CT |
| Delaware | 3 | 69,702 | 54.62 | 3 | 57,236 | 44.85 | - | 442 | 0.35 | - | 172 | 0.13 | - | 51 | 0.04 | - | 12,466 | 9.77 | 127,603 | DE |
| Florida | 7 | 249,117 | 76.10 | 7 | 78,248 | 23.90 | - | - | - | - | - | - | - | - | - | - | 170,869 | 52.20 | 327,365 | FL |
| Georgia | 12 | 255,364 | 87.10 | 12 | 36,942 | 12.60 | - | 141 | 0.05 | - | 68 | 0.02 | - | 660 | 0.23 | - | 218,422 | 74.50 | 293,175 | GA |
| Idaho | 4 | 125,683 | 62.96 | 4 | 66,256 | 33.19 | - | 7,678 | 3.85 | - | - | - | - | - | - | - | 59,427 | 29.77 | 199,617 | ID |
| Illinois | 29 | 2,282,999 | 57.70 | 29 | 1,570,393 | 39.69 | - | 89,439 | 2.26 | - | 7,530 | 0.19 | - | 6,161 | 0.16 | - | 712,606 | 18.01 | 3,956,522 | IL |
| Indiana | 14 | 934,974 | 56.63 | 14 | 691,570 | 41.89 | - | 19,407 | 1.18 | - | 3,856 | 0.23 | - | 1,090 | 0.07 | - | 243,404 | 14.74 | 1,650,897 | IN |
| Iowa | 11 | 621,756 | 54.41 | 11 | 487,977 | 42.70 | - | 29,687 | 2.60 | - | 1,373 | 0.12 | - | 1,940 | 0.17 | - | 133,779 | 11.71 | 1,142,733 | IA |
| Kansas | 9 | 464,520 | 53.67 | 9 | 397,727 | 45.95 | - | 497 | 0.06 | - | 2,770 | 0.32 | - | - | - | - | 66,793 | 7.72 | 865,014 | KS |
| Kentucky | 11 | 541,944 | 58.51 | 11 | 369,702 | 39.92 | - | 12,501 | 1.35 | - | 632 | 0.07 | - | 1,424 | 0.15 | - | 172,242 | 18.60 | 926,203 | KY |
| Louisiana | 10 | 292,894 | 88.82 | 10 | 36,791 | 11.16 | - | - | - | - | - | - | - | 93 | 0.00 | - | 256,103 | 77.66 | 329,778 | LA |
| Maine | 5 | 126,333 | 41.52 | - | 168,823 | 55.49 | 5 | 7,581 | 2.49 | - | 783 | 0.26 | - | 720 | 0.24 | - | -42,490 | -13.97 | 304,240 | ME |
| Maryland | 8 | 389,612 | 62.35 | 8 | 231,435 | 37.04 | - | - | - | - | 1,629 | 0.26 | - | 2,220 | 0.36 | - | 158,177 | 25.31 | 624,896 | MD |
| Massachusetts | 17 | 942,716 | 51.22 | 17 | 768,613 | 41.76 | - | 118,639 | 6.45 | - | 5,111 | 0.28 | - | 5,278 | 0.29 | - | 174,103 | 9.46 | 1,840,357 | MA |
| Michigan | 19 | 1,016,794 | 56.33 | 19 | 699,733 | 38.76 | - | 75,795 | 4.20 | - | 8,208 | 0.45 | - | 4,568 | 0.25 | - | 317,061 | 17.56 | 1,805,098 | MI |
| Minnesota | 11 | 698,811 | 61.84 | 11 | 350,461 | 31.01 | - | 74,296 | 6.58 | - | 2,872 | 0.25 | - | 3,535 | 0.31 | - | 348,350 | 30.83 | 1,129,975 | MN |
| Mississippi | 9 | 157,318 | 97.06 | 9 | 4,443 | 2.74 | - | - | - | - | 329 | 0.20 | - | - | - | - | 152,875 | 94.31 | 162,090 | MS |
| Missouri | 15 | 1,111,043 | 60.76 | 15 | 697,891 | 38.16 | - | 14,630 | 0.80 | - | 3,454 | 0.19 | - | 1,617 | 0.09 | - | 413,152 | 22.59 | 1,828,635 | MO |
| Montana | 4 | 159,690 | 69.28 | 4 | 63,598 | 27.59 | - | 5,549 | 2.41 | - | 1,066 | 0.46 | - | 609 | 0.26 | - | 96,092 | 41.69 | 230,512 | MT |
| Nebraska | 7 | 347,445 | 57.14 | 7 | 247,731 | 40.74 | - | 12,847 | 2.11 | - | - | - | - | - | - | - | 99,714 | 16.40 | 608,023 | NE |
| Nevada | 3 | 31,925 | 72.81 | 3 | 11,923 | 27.19 | - | - | - | - | - | - | - | - | - | - | 20,002 | 45.62 | 43,848 | NV |
| New Hampshire | 4 | 108,460 | 49.73 | 4 | 104,642 | 47.98 | - | 4,819 | 2.21 | - | - | - | - | 193 | 0.09 | - | 3,818 | 1.75 | 218,114 | NH |
| New Jersey | 16 | 1,083,850 | 59.54 | 16 | 720,322 | 39.57 | - | 9,407 | 0.52 | - | 3,931 | 0.22 | - | 2,927 | 0.16 | - | 364,128 | 19.97 | 1,820,437 | NJ |
| New Mexico | 3 | 106,037 | 62.69 | 3 | 61,727 | 36.50 | - | 924 | 0.55 | - | 343 | 0.20 | - | 105 | 0.06 | - | 44,310 | 26.20 | 169,176 | NM |
| New York | 47 | 3,293,222 | 58.85 | 47 | 2,180,670 | 38.97 | - | - | - | - | 86,897 | 1.55 | - | 35,609 | 0.64 | - | 1,112,552 | 19.88 | 5,596,398 | NY |
| North Carolina | 13 | 616,141 | 73.40 | 13 | 223,283 | 26.60 | - | 2 | 0.00 | - | 21 | 0.00 | - | 17 | 0.00 | - | 392,858 | 46.80 | 839,464 | NC |
| North Dakota | 4 | 163,148 | 59.60 | 4 | 72,751 | 26.58 | - | 36,708 | 13.41 | - | 552 | 0.20 | - | 557 | 0.20 | - | 90,397 | 33.03 | 273,716 | ND |
| Ohio | 26 | 1,747,140 | 57.99 | 26 | 1,127,855 | 37.44 | - | 132,212 | 4.39 | - | 117 | 0.00 | - | 5,265 | 0.17 | - | 619,285 | 20.56 | 3,012,589 | OH |
| Oklahoma | 11 | 501,069 | 66.83 | 11 | 245,122 | 32.69 | - | - | - | - | 2,221 | 0.30 | - | 1,328 | 0.18 | - | 255,947 | 34.14 | 749,740 | OK |
| Oregon | 5 | 266,733 | 64.42 | 5 | 122,706 | 29.64 | - | 21,831 | 5.27 | - | 2,143 | 0.52 | - | 608 | 0.15 | - | 144,027 | 34.79 | 414,021 | OR |
| Pennsylvania | 36 | 2,353,987 | 56.88 | 36 | 1,690,200 | 40.84 | - | 67,468 | 1.63 | - | 14,599 | 0.35 | - | 12,172 | 0.29 | - | 663,787 | 16.04 | 4,138,426 | PA |
| Rhode Island | 4 | 165,238 | 53.10 | 4 | 125,031 | 40.18 | - | 19,569 | 6.29 | - | - | - | - | 1,340 | 0.43 | - | 40,207 | 12.92 | 311,178 | RI |
| South Carolina | 8 | 113,791 | 98.57 | 8 | 1,646 | 1.43 | - | - | - | - | - | - | - | - | - | - | 112,145 | 97.15 | 115,437 | SC |
| South Dakota | 4 | 160,137 | 54.02 | 4 | 125,977 | 42.49 | - | 10,338 | 3.49 | - | - | - | - | - | - | - | 34,160 | 11.52 | 296,472 | SD |
| Tennessee | 11 | 328,083 | 68.85 | 11 | 146,520 | 30.75 | - | 296 | 0.06 | - | 686 | 0.14 | - | 953 | 0.20 | - | 181,563 | 38.10 | 476,538 | TN |
| Texas | 23 | 734,485 | 87.08 | 23 | 103,874 | 12.31 | - | 3,281 | 0.39 | - | 1,075 | 0.13 | - | 767 | 0.09 | - | 630,611 | 74.76 | 843,482 | TX |
| Utah | 4 | 150,246 | 69.34 | 4 | 64,555 | 29.79 | - | 1,121 | 0.52 | - | 432 | 0.20 | - | 323 | 0.15 | - | 85,691 | 39.55 | 216,677 | UT |
| Vermont | 3 | 62,124 | 43.24 | - | 81,023 | 56.39 | 3 | - | - | - | - | - | - | 542 | 0.38 | - | -18,899 | -13.15 | 143,689 | VT |
| Virginia | 11 | 234,980 | 70.23 | 11 | 98,336 | 29.39 | - | 233 | 0.07 | - | 313 | 0.09 | - | 728 | 0.22 | - | 136,644 | 40.84 | 334,590 | VA |
| Washington | 8 | 459,579 | 66.38 | 8 | 206,892 | 29.88 | - | 17,463 | 2.52 | - | 3,496 | 0.50 | - | 4,908 | 0.71 | - | 252,687 | 36.50 | 692,338 | WA |
| West Virginia | 8 | 502,582 | 60.56 | 8 | 325,358 | 39.20 | - | - | - | - | 832 | 0.10 | - | 1,173 | 0.14 | - | 177,224 | 21.35 | 829,945 | WV |
| Wisconsin | 12 | 802,984 | 63.80 | 12 | 380,828 | 30.26 | - | 60,297 | 4.79 | - | 10,626 | 0.84 | - | 3,825 | 0.30 | - | 422,156 | 33.54 | 1,258,560 | WI |
| Wyoming | 3 | 62,624 | 60.58 | 3 | 38,739 | 37.47 | - | 1,653 | 1.60 | - | 200 | 0.19 | - | 166 | 0.16 | - | 23,885 | 23.10 | 103,382 | WY |
| TOTALS: | 531 | 27,752,648 | 60.80 | 523 | 16,681,862 | 36.54 | 8 | 892,378 | 1.95 | - | 187,910 | 0.41 | - | 132,901 | 0.29 | - | 11,070,786 | 24.25 | 45,647,699 | US |
Close states
Margin of victory less than 5% (4 electoral votes):
- New Hampshire, 1.75%
Margin of victory between 5% and 10% (29 electoral votes):
- Kansas, 7.72%
- Massachusetts, 9.46%
- Delaware, 9.77%
See also
- History of the United States (1918–1945)
- United States Senate elections, 1936
- Second inauguration of Franklin D. Roosevelt
References
- ↑ "Voter Turnout in Presidential Elections". The American Presidency Project. UC Santa Barbara.
- ↑ Our Campaigns – US President – D Primaries Race – Feb 01, 1936
- ↑ Bryson, Maurice C. "The Literary Digest Poll: Making of a Statistical Myth." The American Statistician, 30(4):November 1976
- ↑ Squire, Peverill "Why the 1936 Literary Digest Poll Failed" Public Opinion Quarterly, 52:125–133 1988
- ↑ "1936 Presidential General Election Data - National". Retrieved April 8, 2013.
Further reading
- Andersen, Kristi. The Creation of a Democratic Majority: 1928–1936 (1979), statistical
- Burns, James MacGregor. Roosevelt: The Lion and the Fox (1956)
- Communist Party USA, The Communist Election Platform, 1936. New York: Workers Library Publishers, 1936.
- Fadely, James Philip. "Editors, Whistle Stops, and Elephants: the Presidential Campaign of 1936 in Indiana." Indiana Magazine of History 1989 85(2): 101–137. ISSN 0019-6673
- Leuchtenburg, William E. "Election of 1936", in Arthur M. Schlesinger, Jr., ed., A History of American Presidential Elections vol 3 (1971), analysis and primary documents
- McCoy, Donald. Landon of Kansas (1968)
- Nicolaides, Becky M. "Radio Electioneering in the American Presidential Campaigns of 1932 and 1936," Historical Journal of Film, Radio and Television, June 1988, Vol. 8 Issue 2, pp. 115–138
- Savage, Sean J. "The 1936-1944 Campaigns," in William D. Pederson, ed. A Companion to Franklin D. Roosevelt (2011) pp 96–113 online
- Schlesinger, Jr., Arthur M. The Politics of Upheaval (1960)
External links
- 1936 popular vote by counties
- How close was the 1936 election? – Michael Sheppard, Massachusetts Institute of Technology
- Election of 1936 in Counting the Votes