Climate of California


The climate of California varies widely, from hot desert to subarctic, depending on latitude, elevation, and proximity to the coast. California's coastal regions, the Sierra Nevada foothills, and much of the Central Valley have a Mediterranean climate, with warm to hot, dry summers and mild, moderately wet winters. The influence of the ocean generally moderates temperature extremes, creating warmer winters and substantially cooler summers in coastal areas.
Temperature range
The cool California Current offshore, enhanced by upwelling of cold sub-surface waters, often creates summer fog near the coast, creating a warm-summer Mediterranean climate (Köppen climate classification Csb). Further inland, the climate becomes more continental, with some areas turning semi-arid (Köppen BSk), with colder winters and markedly hotter summers. Low-lying inland valleys, especially the Central Valley, have a hot-summer Mediterranean climate (Köppen Csa), with subtropical temperatures but a well-defined summer dry season and a foggy, rainy season in winter.
The temperature gradient between immediate coast and low-lying inland valleys in the south is about 7 °F (4 °C) in winter, the coast being warmer, and in summer roughly 25 °F (14 °C), the interior being warmer. For example, the average daily high in San Francisco in July and August is between 62 and 68 °F (17 and 20 °C),[1][2] and in Walnut Creek, some 20 miles (32 km) inland, the average daily high in July and August is 90 °F (32 °C): a temperature gain of more than one degree (Fahrenheit) per mile.[3] In the south, the figures are approximately 4 °F and 23 °F (2 °C and 13 °C), respectively. At the coast in Santa Monica, the average high in August is 75 °F (24 °C), while in Burbank, approximately 10 miles (16 km) inland, the average high in August is 95 °F (35 °C): a temperature gain of about two degrees Fahrenheit per mile.[4]
During the cooler winter months (October–March), the Coachella Valley regularly has the warmest winter temperatures out of any place west of the Rocky Mountains. East Los Angeles, the Gateway Cities, and parts of the San Gabriel Valley average the warmest winter high temps (72 °F, 22 °C) in all of the western U.S., and Santa Monica averages the warmest winter lows (52 °F, 11 °C) in all of the western U.S. Palm Springs, a city in the Coachella Valley, averages high/low/mean temperatures of 75 °F/50 °F/63 °F, (24 °C/10 °C/17 °C) respectively during the period of cooler weather from November to April.[5]
The extreme southwest, around San Diego, has a subtropical semi-arid or steppe climate (Koppen BSh) as winters are drier there.
The southeastern regions have a hot arid climate (Koppen BWh), similar to that of the Sahara Desert. In the northern portion of the Mojave Desert on the east side of the state is Death Valley, which has recorded temperatures among the highest in the world. It is common in the summer for temperatures in the valley to reach 120 °F (49 °C). The highest reliably recorded temperature in the world,[6][7] 134 °F (56.7 °C), was recorded in Death Valley on July 10, 1913. Temperatures of 130 °F (54 °C) or higher have been recorded as recently as 2005. The 24-hour average July temperature in Death Valley is 101.8 °F (38.8 °C) (1981–2010 NCDC Normals).
Map of locations in the table below |
| Place | Jan | Feb | Mar | Apr | May | Jun | Jul | Aug | Sep | Oct | Nov | Dec |
|---|---|---|---|---|---|---|---|---|---|---|---|---|
| Alturas[8] | 44 / 18 (7 / −8) |
48 / 21 (9 / −6) |
54 / 25 (12 / −4) |
60 / 28 (16 / −2) |
70 / 34 (21 / 1) |
79 / 40 (26 / 4) |
90 / 44 (32 / 7) |
89 / 42 (32 / 6) |
80 / 36 (27 / 2) |
68 / 28 (20 / −2) |
52 / 23 (11 / −5) |
42 / 18 (6 / −8) |
| Bakersfield[9] | 56 / 39 (13 / 4) |
63 / 42 (17 / 6) |
69 / 47 (21 / 8) |
75 / 50 (24 / 10) |
84 / 58 (29 / 14) |
91 / 64 (33 / 18) |
97 / 71 (36 / 22) |
96 / 69 (36 / 21) |
90 / 64 (32 / 18) |
80 / 55 (27 / 13) |
66 / 45 (19 / 7) |
57 / 39 (14 / 4) |
| Bishop[10] | 54 / 23 (12 / −5) |
58 / 27 (14 / −3) |
66 / 31 (19 / −1) |
73 / 36 (23 / 2) |
82 / 44 (28 / 7) |
92 / 51 (33 / 11) |
98 / 56 (37 / 13) |
96 / 54 (36 / 12) |
88 / 47 (31 / 8) |
76 / 37 (24 / 3) |
63 / 28 (17 / −2) |
53 / 22 (12 / −6) |
| Bodie[11] | 40 / 5 (4 / −15) |
41 / 7 (5 / −14) |
45 / 11 (7 / −12) |
50 / 17 (10 / −8) |
61 / 24 (16 / −4) |
70 / 30 (21 / −1) |
78 / 34 (26 / 1) |
77 / 32 (25 / 0) |
71 / 26 (22 / −3) |
60 / 18 (16 / −8) |
49 / 11 (9 / −12) |
41 / 6 (5 / −14) |
| Death Valley[12] | 67 / 40 (19 / 4) |
73 / 46 (23 / 8) |
82 / 55 (28 / 13) |
91 / 62 (33 / 17) |
101 / 73 (38 / 23) |
110 / 81 (43 / 27) |
117 / 88 (47 / 31) |
115 / 86 (46 / 30) |
107 / 76 (42 / 24) |
93 / 62 (34 / 17) |
77 / 48 (25 / 9) |
65 / 38 (18 / 3) |
| Eureka[13] | 56 / 41 (13 / 5) |
56 / 42 (13 / 6) |
57 / 43 (14 / 6) |
58 / 44 (14 / 7) |
60 / 48 (16 / 9) |
62 / 50 (17 / 10) |
63 / 52 (17 / 11) |
64 / 53 (18 / 12) |
64 / 50 (18 / 10) |
62 / 47 (17 / 8) |
58 / 44 (14 / 7) |
55 / 41 (13 / 5) |
| Fresno[14] | 55 / 38 (13 / 3) |
62 / 42 (17 / 6) |
68 / 46 (20 / 8) |
75 / 49 (24 / 9) |
84 / 56 (29 / 13) |
92 / 62 (33 / 17) |
98 / 68 (37 / 20) |
97 / 66 (36 / 19) |
91 / 62 (33 / 17) |
80 / 53 (27 / 12) |
65 / 43 (18 / 6) |
55 / 38 (13 / 3) |
| Los Angeles[15] | 68 / 48 (20 / 9) |
69 / 49 (21 / 9) |
70 / 51 (21 / 11) |
73 / 54 (23 / 12) |
75 / 57 (24 / 14) |
78 / 60 (26 / 16) |
83 / 64 (28 / 18) |
84 / 64 (29 / 18) |
83 / 63 (28 / 17) |
79 / 59 (26 / 15) |
73 / 52 (23 / 11) |
68 / 48 (20 / 9) |
| Needles[16] | 65 / 44 (18 / 7) |
70 / 47 (21 / 8) |
77 / 52 (25 / 11) |
85 / 59 (29 / 15) |
95 / 68 (35 / 20) |
104 / 77 (40 / 25) |
109 / 84 (43 / 29) |
107 / 83 (42 / 28) |
100 / 75 (38 / 24) |
88 / 62 (31 / 17) |
73 / 50 (23 / 10) |
63 / 43 (17 / 6) |
| Redding[17] | 55 / 37 (13 / 3) |
60 / 39 (16 / 4) |
65 / 43 (18 / 6) |
71 / 46 (22 / 8) |
81 / 54 (27 / 12) |
90 / 61 (32 / 16) |
98 / 66 (37 / 19) |
97 / 63 (36 / 17) |
90 / 58 (32 / 14) |
78 / 50 (26 / 10) |
63 / 41 (17 / 5) |
55 / 36 (13 / 2) |
| Riverside[18] | 69 / 43 (21 / 6) |
70 / 45 (21 / 7) |
73 / 46 (23 / 8) |
78 / 50 (26 / 10) |
83 / 55 (28 / 13) |
89 / 60 (32 / 16) |
95 / 64 (35 / 18) |
96 / 65 (36 / 18) |
92 / 61 (33 / 16) |
83 / 55 (28 / 13) |
75 / 47 (24 / 8) |
68 / 42 (20 / 6) |
| Sacramento[19] | 54 / 39 (12 / 4) |
60 / 41 (16 / 5) |
65 / 44 (18 / 7) |
71 / 46 (22 / 8) |
80 / 51 (27 / 11) |
87 / 56 (31 / 13) |
92 / 58 (33 / 14) |
91 / 58 (33 / 14) |
87 / 56 (31 / 13) |
78 / 50 (26 / 10) |
64 / 43 (18 / 6) |
54 / 38 (12 / 3) |
| San Diego[20] | 65 / 49 (18 / 9) |
65 / 51 (18 / 11) |
67 / 53 (19 / 12) |
68 / 56 (20 / 13) |
69 / 59 (21 / 15) |
71 / 62 (22 / 17) |
75 / 65 (24 / 18) |
76 / 67 (24 / 19) |
76 / 65 (24 / 18) |
73 / 61 (23 / 16) |
69 / 54 (21 / 12) |
65 / 48 (18 / 9) |
| San Francisco[1] |
57 / 46 (14 / 8) |
60 / 48 (16 / 9) |
62 / 49 (17 / 9) |
63 / 49 (17 / 9) |
64 / 51 (18 / 11) |
66 / 53 (19 / 12) |
66 / 54 (19 / 12) |
68 / 55 (20 / 13) |
70 / 55 (21 / 13) |
69 / 54 (21 / 12) |
63 / 50 (17 / 10) |
57 / 46 (14 / 8) |
| San Jose[21] | 58 / 42 (14 / 6) |
62 / 45 (17 / 7) |
66 / 47 (19 / 8) |
69 / 49 (21 / 9) |
74 / 52 (23 / 11) |
79 / 56 (26 / 13) |
82 / 58 (28 / 14) |
82 / 58 (28 / 14) |
80 / 57 (27 / 14) |
74 / 53 (23 / 12) |
64 / 46 (18 / 8) |
58 / 42 (14 / 6) |
| Santa Rosa[22] | 59 / 39 (15 / 4) |
63 / 41 (17 / 5) |
67 / 43 (19 / 6) |
70 / 45 (21 / 7) |
75 / 48 (24 / 9) |
80 / 52 (27 / 11) |
82 / 52 (28 / 11) |
83 / 53 (28 / 12) |
83 / 52 (28 / 11) |
78 / 48 (26 / 9) |
67 / 43 (19 / 6) |
59 / 39 (15 / 4) |
| South Lake Tahoe[23] |
43 / 16 (6 / −9) |
44 / 18 (7 / −8) |
49 / 23 (9 / −5) |
54 / 27 (12 / −3) |
64 / 32 (18 / 0) |
72 / 37 (22 / 3) |
81 / 41 (27 / 5) |
80 / 40 (27 / 4) |
74 / 35 (23 / 2) |
63 / 28 (17 / −2) |
51 / 22 (11 / −6) |
43 / 17 (6 / −8) |
Full statistics for selected cities
| Climate data for Fresno, California (Fresno Airport), 1981–2010 normals, extremes 1881–present[lower-alpha 1] | |||||||||||||
|---|---|---|---|---|---|---|---|---|---|---|---|---|---|
| Month | Jan | Feb | Mar | Apr | May | Jun | Jul | Aug | Sep | Oct | Nov | Dec | Year |
| Record high °F (°C) | 78 (26) |
84 (29) |
90 (32) |
101 (38) |
110 (43) |
112 (44) |
115 (46) |
113 (45) |
111 (44) |
102 (39) |
90 (32) |
77 (25) |
115 (46) |
| Average high °F (°C) | 54.8 (12.7) |
61.6 (16.4) |
67.6 (19.8) |
74.6 (23.7) |
84.1 (28.9) |
92.0 (33.3) |
98.4 (36.9) |
97.1 (36.2) |
90.9 (32.7) |
79.5 (26.4) |
65.1 (18.4) |
54.9 (12.7) |
76.7 (24.8) |
| Average low °F (°C) | 38.3 (3.5) |
41.5 (5.3) |
45.6 (7.6) |
49.4 (9.7) |
56.2 (13.4) |
62.4 (16.9) |
67.6 (19.8) |
66.2 (19) |
61.5 (16.4) |
53.0 (11.7) |
43.4 (6.3) |
38.0 (3.3) |
51.9 (11.1) |
| Record low °F (°C) | 17 (−8) |
24 (−4) |
26 (−3) |
32 (0) |
36 (2) |
42 (6) |
50 (10) |
49 (9) |
37 (3) |
27 (−3) |
26 (−3) |
18 (−8) |
17 (−8) |
| Average precipitation inches (mm) | 2.19 (55.6) |
2.03 (51.6) |
2.03 (51.6) |
0.95 (24.1) |
0.43 (10.9) |
0.21 (5.3) |
0.01 (0.3) |
0.01 (0.3) |
0.17 (4.3) |
0.63 (16) |
1.07 (27.2) |
1.77 (45) |
11.50 (292.1) |
| Average precipitation days (≥ 0.01 in) | 7.6 | 8.6 | 7.5 | 4.5 | 2.2 | 0.7 | 0.2 | 0.3 | 1.0 | 2.5 | 5.5 | 7.5 | 48.1 |
| Average relative humidity (%) | 83.3 | 77.2 | 68.9 | 57.4 | 47.3 | 41.9 | 39.2 | 44.7 | 50.0 | 58.5 | 74.1 | 84.2 | 60.6 |
| Mean monthly sunshine hours | 141.5 | 196.9 | 286.2 | 335.5 | 398.9 | 412.2 | 428.2 | 399.6 | 345.9 | 302.3 | 189.9 | 127.1 | 3,564.2 |
| Percent possible sunshine | 46 | 65 | 77 | 85 | 91 | 94 | 96 | 95 | 93 | 87 | 62 | 42 | 80 |
| Source: NOAA (relative humidity and sun 1961–1990)[24][25][26], Weather.com[27] | |||||||||||||
| Climate data for Los Angeles (USC, Downtown), 1981–2010 normals, extremes 1877–present | |||||||||||||
|---|---|---|---|---|---|---|---|---|---|---|---|---|---|
| Month | Jan | Feb | Mar | Apr | May | Jun | Jul | Aug | Sep | Oct | Nov | Dec | Year |
| Record high °F (°C) | 95 (35) |
95 (35) |
99 (37) |
106 (41) |
103 (39) |
112 (44) |
109 (43) |
106 (41) |
113 (45) |
108 (42) |
100 (38) |
92 (33) |
113 (45) |
| Mean maximum °F (°C) | 83.3 (28.5) |
84.3 (29.1) |
85.8 (29.9) |
91.2 (32.9) |
89.7 (32.1) |
90.2 (32.3) |
94.1 (34.5) |
95.3 (35.2) |
98.9 (37.2) |
95.5 (35.3) |
88.0 (31.1) |
81.4 (27.4) |
102.7 (39.3) |
| Average high °F (°C) | 68.2 (20.1) |
68.6 (20.3) |
70.2 (21.2) |
72.7 (22.6) |
74.5 (23.6) |
78.1 (25.6) |
83.1 (28.4) |
84.4 (29.1) |
83.1 (28.4) |
78.5 (25.8) |
72.8 (22.7) |
67.7 (19.8) |
75.2 (24) |
| Average low °F (°C) | 47.8 (8.8) |
49.3 (9.6) |
51.0 (10.6) |
53.5 (11.9) |
57.1 (13.9) |
60.3 (15.7) |
63.6 (17.6) |
64.1 (17.8) |
63.1 (17.3) |
58.7 (14.8) |
52.0 (11.1) |
47.5 (8.6) |
55.7 (13.2) |
| Mean minimum °F (°C) | 41.3 (5.2) |
42.9 (6.1) |
44.9 (7.2) |
48.4 (9.1) |
53.6 (12) |
57.2 (14) |
61.2 (16.2) |
61.8 (16.6) |
59.2 (15.1) |
54.1 (12.3) |
45.0 (7.2) |
40.8 (4.9) |
39.1 (3.9) |
| Record low °F (°C) | 28 (−2) |
28 (−2) |
31 (−1) |
36 (2) |
40 (4) |
46 (8) |
49 (9) |
49 (9) |
44 (7) |
40 (4) |
34 (1) |
30 (−1) |
28 (−2) |
| Average rainfall inches (mm) | 3.12 (79.2) |
3.80 (96.5) |
2.43 (61.7) |
0.91 (23.1) |
0.26 (6.6) |
0.09 (2.3) |
0.01 (0.3) |
0.04 (1) |
0.24 (6.1) |
0.66 (16.8) |
1.04 (26.4) |
2.33 (59.2) |
14.93 (379.2) |
| Average rainy days (≥ 0.01 in) | 6.1 | 6.4 | 5.5 | 3.2 | 1.3 | 0.6 | 0.3 | 0.3 | 1.0 | 2.5 | 3.3 | 5.2 | 35.7 |
| Mean monthly sunshine hours | 225.3 | 222.5 | 267.0 | 303.5 | 276.2 | 275.8 | 364.1 | 349.5 | 278.5 | 255.1 | 217.3 | 219.4 | 3,254.2 |
| Percent possible sunshine | 71 | 72 | 72 | 78 | 64 | 64 | 83 | 84 | 75 | 73 | 70 | 71 | 73 |
| Source: NOAA (sun 1961–1977)[28][29][30] | |||||||||||||
| Climate data for Los Angeles (LAX), 1981–2010 normals, extremes 1944–present | |||||||||||||
|---|---|---|---|---|---|---|---|---|---|---|---|---|---|
| Month | Jan | Feb | Mar | Apr | May | Jun | Jul | Aug | Sep | Oct | Nov | Dec | Year |
| Record high °F (°C) | 91 (33) |
92 (33) |
95 (35) |
95 (35) |
91 (33) |
103 (39) |
93 (34) |
98 (37) |
106 (41) |
101 (38) |
101 (38) |
94 (34) |
106 (41) |
| Mean maximum °F (°C) | 81.2 (27.3) |
81.0 (27.2) |
79.6 (26.4) |
83.4 (28.6) |
79.9 (26.6) |
80.0 (26.7) |
83.6 (28.7) |
85.7 (29.8) |
90.1 (32.3) |
89.9 (32.2) |
85.5 (29.7) |
78.9 (26.1) |
94.7 (34.8) |
| Average high °F (°C) | 64.6 (18.1) |
64.3 (17.9) |
64.4 (18) |
66.4 (19.1) |
68.1 (20.1) |
70.6 (21.4) |
73.8 (23.2) |
74.9 (23.8) |
74.6 (23.7) |
72.5 (22.5) |
68.9 (20.5) |
64.6 (18.1) |
69.0 (20.6) |
| Average low °F (°C) | 48.8 (9.3) |
50.0 (10) |
51.7 (10.9) |
53.8 (12.1) |
57.3 (14.1) |
60.5 (15.8) |
63.7 (17.6) |
64.3 (17.9) |
63.2 (17.3) |
59.3 (15.2) |
53.2 (11.8) |
48.7 (9.3) |
56.2 (13.4) |
| Mean minimum °F (°C) | 41.1 (5.1) |
42.5 (5.8) |
44.6 (7) |
47.5 (8.6) |
52.5 (11.4) |
56.2 (13.4) |
59.8 (15.4) |
60.6 (15.9) |
58.4 (14.7) |
52.7 (11.5) |
45.3 (7.4) |
40.9 (4.9) |
38.8 (3.8) |
| Record low °F (°C) | 27 (−3) |
34 (1) |
35 (2) |
42 (6) |
45 (7) |
48 (9) |
52 (11) |
51 (11) |
47 (8) |
43 (6) |
38 (3) |
32 (0) |
27 (−3) |
| Average rainfall inches (mm) | 2.71 (68.8) |
3.25 (82.6) |
1.85 (47) |
0.70 (17.8) |
0.22 (5.6) |
0.08 (2) |
0.03 (0.8) |
0.05 (1.3) |
0.21 (5.3) |
0.56 (14.2) |
1.11 (28.2) |
2.05 (52.1) |
12.82 (325.6) |
| Average rainy days (≥ 0.01 in) | 6.0 | 6.6 | 5.8 | 2.8 | 1.2 | 0.6 | 0.5 | 0.3 | 1.0 | 2.3 | 3.4 | 5.2 | 35.7 |
| Average relative humidity (%) | 63.4 | 67.9 | 70.5 | 71.0 | 74.0 | 75.9 | 76.6 | 76.6 | 74.2 | 70.5 | 65.5 | 62.9 | 70.8 |
| Source: NOAA (relative humidity 1961–1990)[28][31][32] | |||||||||||||
| Climate data for Sacramento, California (Sacramento Executive Airport), 1981–2010 normals,[lower-alpha 2] extremes 1941–present[lower-alpha 3] | |||||||||||||
|---|---|---|---|---|---|---|---|---|---|---|---|---|---|
| Month | Jan | Feb | Mar | Apr | May | Jun | Jul | Aug | Sep | Oct | Nov | Dec | Year |
| Record high °F (°C) | 76 (24) |
76 (24) |
88 (31) |
95 (35) |
105 (41) |
115 (46) |
114 (46) |
110 (43) |
108 (42) |
104 (40) |
87 (31) |
73 (23) |
115 (46) |
| Mean maximum °F (°C) | 64.0 (17.8) |
70.5 (21.4) |
76.8 (24.9) |
87.2 (30.7) |
95.8 (35.4) |
102.3 (39.1) |
105.0 (40.6) |
103.7 (39.8) |
100.1 (37.8) |
91.6 (33.1) |
76.1 (24.5) |
64.6 (18.1) |
106.8 (41.6) |
| Average high °F (°C) | 53.8 (12.1) |
60.3 (15.7) |
65.1 (18.4) |
71.1 (21.7) |
79.9 (26.6) |
87.1 (30.6) |
92.1 (33.4) |
91.2 (32.9) |
87.2 (30.7) |
77.6 (25.3) |
63.8 (17.7) |
53.9 (12.2) |
73.6 (23.1) |
| Average low °F (°C) | 38.8 (3.8) |
41.4 (5.2) |
44.1 (6.7) |
46.2 (7.9) |
51.1 (10.6) |
55.8 (13.2) |
58.4 (14.7) |
58.0 (14.4) |
55.7 (13.2) |
50.2 (10.1) |
42.8 (6) |
38.4 (3.6) |
48.4 (9.1) |
| Mean minimum °F (°C) | 29.1 (−1.6) |
31.5 (−0.3) |
35.1 (1.7) |
38.0 (3.3) |
42.9 (6.1) |
48.7 (9.3) |
53.1 (11.7) |
53.0 (11.7) |
49.2 (9.6) |
41.7 (5.4) |
32.5 (0.3) |
28.5 (−1.9) |
26.6 (−3) |
| Record low °F (°C) | 20 (−7) |
23 (−5) |
26 (−3) |
31 (−1) |
34 (1) |
41 (5) |
48 (9) |
48 (9) |
42 (6) |
35 (2) |
26 (−3) |
18 (−8) |
18 (−8) |
| Average precipitation inches (mm) | 3.64 (92.5) |
3.47 (88.1) |
2.75 (69.9) |
1.15 (29.2) |
0.68 (17.3) |
0.21 (5.3) |
0 (0) |
0.05 (1.3) |
0.29 (7.4) |
0.95 (24.1) |
2.08 (52.8) |
3.25 (82.6) |
18.25 (463.6) |
| Average precipitation days (≥ 0.01 in) | 10.3 | 9.4 | 9.1 | 4.9 | 3.2 | 1.2 | 0 | 0.3 | 1.3 | 3.6 | 6.9 | 9.9 | 60.0 |
| Average relative humidity (%) | 83.3 | 76.8 | 71.6 | 64.5 | 58.9 | 55.0 | 53.2 | 55.7 | 57.0 | 63.1 | 75.6 | 82.9 | 66.5 |
| Mean monthly sunshine hours | 145.5 | 201.3 | 278.0 | 329.6 | 406.3 | 419.5 | 440.2 | 406.9 | 347.8 | 296.7 | 194.9 | 141.1 | 3,607.8 |
| Percent possible sunshine | 48 | 67 | 75 | 83 | 92 | 94 | 98 | 96 | 93 | 86 | 64 | 48 | 81 |
| Source: NOAA (relative humidity and sun 1961–1990)[34][35] | |||||||||||||
| Climate data for Sacramento 5 ESE, California (1981–2010 normals,[lower-alpha 2] extremes 1877–present) | |||||||||||||
|---|---|---|---|---|---|---|---|---|---|---|---|---|---|
| Month | Jan | Feb | Mar | Apr | May | Jun | Jul | Aug | Sep | Oct | Nov | Dec | Year |
| Record high °F (°C) | 79 (26) |
80 (27) |
90 (32) |
98 (37) |
107 (42) |
112 (44) |
114 (46) |
111 (44) |
109 (43) |
102 (39) |
86 (30) |
72 (22) |
114 (46) |
| Mean maximum °F (°C) | 65.7 (18.7) |
72.8 (22.7) |
80.0 (26.7) |
90.2 (32.3) |
97.9 (36.6) |
104.1 (40.1) |
106.6 (41.4) |
105.4 (40.8) |
101.7 (38.7) |
93.1 (33.9) |
77.0 (25) |
65.6 (18.7) |
108.3 (42.4) |
| Average high °F (°C) | 54.4 (12.4) |
61.2 (16.2) |
66.8 (19.3) |
72.7 (22.6) |
80.9 (27.2) |
87.9 (31.1) |
93.3 (34.1) |
92.2 (33.4) |
87.9 (31.1) |
77.9 (25.5) |
63.7 (17.6) |
54.3 (12.4) |
74.4 (23.6) |
| Average low °F (°C) | 40.7 (4.8) |
43.7 (6.5) |
46.5 (8.1) |
49.0 (9.4) |
53.9 (12.2) |
58.4 (14.7) |
60.9 (16.1) |
60.5 (15.8) |
58.4 (14.7) |
52.8 (11.6) |
45.5 (7.5) |
40.4 (4.7) |
50.9 (10.5) |
| Mean minimum °F (°C) | 32.8 (0.4) |
35.0 (1.7) |
38.7 (3.7) |
41.9 (5.5) |
46.7 (8.2) |
51.6 (10.9) |
55.0 (12.8) |
55.3 (12.9) |
52.1 (11.2) |
45.1 (7.3) |
35.7 (2.1) |
31.5 (−0.3) |
30.1 (−1.1) |
| Record low °F (°C) | 19 (−7) |
21 (−6) |
29 (−2) |
34 (1) |
37 (3) |
43 (6) |
47 (8) |
48 (9) |
44 (7) |
34 (1) |
27 (−3) |
17 (−8) |
17 (−8) |
| Average precipitation inches (mm) | 3.97 (100.8) |
3.69 (93.7) |
3.02 (76.7) |
1.30 (33) |
0.76 (19.3) |
0.19 (4.8) |
0 (0) |
0.03 (0.8) |
0.35 (8.9) |
1.05 (26.7) |
2.43 (61.7) |
3.48 (88.4) |
20.27 (514.9) |
| Average precipitation days (≥ 0.01 in) | 11.2 | 9.8 | 9.2 | 5.2 | 3.2 | 1.2 | 0.1 | 0.4 | 1.4 | 3.6 | 7.4 | 10.5 | 63.5 |
| Source: NOAA[34], Western Regional Climate Center[36] | |||||||||||||
| Climate data for San Francisco (downtown),[lower-alpha 4] 1981–2010 normals,[lower-alpha 5] extremes 1849–present | |||||||||||||
|---|---|---|---|---|---|---|---|---|---|---|---|---|---|
| Month | Jan | Feb | Mar | Apr | May | Jun | Jul | Aug | Sep | Oct | Nov | Dec | Year |
| Record high °F (°C) | 79 (26) |
81 (27) |
87 (31) |
94 (34) |
97 (36) |
103 (39) |
98 (37) |
98 (37) |
101 (38) |
102 (39) |
86 (30) |
76 (24) |
103 (39) |
| Mean maximum °F (°C) | 67.3 (19.6) |
72.5 (22.5) |
75.7 (24.3) |
82.3 (27.9) |
82.7 (28.2) |
86.0 (30) |
83.1 (28.4) |
85.5 (29.7) |
89.6 (32) |
88.1 (31.2) |
76.1 (24.5) |
66.4 (19.1) |
94.3 (34.6) |
| Average high °F (°C) | 56.9 (13.8) |
60.2 (15.7) |
61.8 (16.6) |
63.1 (17.3) |
64.3 (17.9) |
66.4 (19.1) |
66.5 (19.2) |
68.1 (20.1) |
70.2 (21.2) |
69.2 (20.7) |
63.1 (17.3) |
57.1 (13.9) |
63.9 (17.7) |
| Average low °F (°C) | 45.7 (7.6) |
47.5 (8.6) |
48.5 (9.2) |
49.2 (9.6) |
51.0 (10.6) |
52.8 (11.6) |
54.1 (12.3) |
55.1 (12.8) |
55.1 (12.8) |
53.7 (12.1) |
50.1 (10.1) |
46.1 (7.8) |
50.7 (10.4) |
| Mean minimum °F (°C) | 40.3 (4.6) |
41.8 (5.4) |
43.6 (6.4) |
45.1 (7.3) |
47.7 (8.7) |
50.2 (10.1) |
51.5 (10.8) |
52.6 (11.4) |
52.0 (11.1) |
49.6 (9.8) |
44.2 (6.8) |
40.1 (4.5) |
38.2 (3.4) |
| Record low °F (°C) | 29 (−2) |
31 (−1) |
33 (1) |
40 (4) |
42 (6) |
46 (8) |
47 (8) |
46 (8) |
47 (8) |
43 (6) |
38 (3) |
27 (−3) |
27 (−3) |
| Average rainfall inches (mm) | 4.50 (114.3) |
4.46 (113.3) |
3.26 (82.8) |
1.46 (37.1) |
0.70 (17.8) |
0.16 (4.1) |
0.00 (0) |
0.06 (1.5) |
0.21 (5.3) |
1.12 (28.4) |
3.16 (80.3) |
4.56 (115.8) |
23.65 (600.7) |
| Average rainy days (≥ 0.01 in) | 11.7 | 11.1 | 11.0 | 6.5 | 3.8 | 1.5 | 0.3 | 1.0 | 1.7 | 3.9 | 8.9 | 11.6 | 73.0 |
| Mean monthly sunshine hours | 185.9 | 207.7 | 269.1 | 309.3 | 325.1 | 311.4 | 313.3 | 287.4 | 271.4 | 247.1 | 173.4 | 160.6 | 3,061.7 |
| Percent possible sunshine | 61 | 69 | 73 | 78 | 74 | 70 | 70 | 68 | 73 | 71 | 57 | 54 | 69 |
| Source: NOAA (sun 1961–1974)[37][38][39] | |||||||||||||
| Climate data for San Diego Int'l Airport (1981–2010 normals,[lower-alpha 6] extremes 1874–present)[lower-alpha 7] | |||||||||||||
|---|---|---|---|---|---|---|---|---|---|---|---|---|---|
| Month | Jan | Feb | Mar | Apr | May | Jun | Jul | Aug | Sep | Oct | Nov | Dec | Year |
| Record high °F (°C) | 88 (31) |
90 (32) |
99 (37) |
98 (37) |
98 (37) |
101 (38) |
100 (38) |
98 (37) |
111 (44) |
107 (42) |
100 (38) |
88 (31) |
111 (44) |
| Mean maximum °F (°C) | 78.4 (25.8) |
79.2 (26.2) |
79.8 (26.6) |
82.8 (28.2) |
79.0 (26.1) |
81.2 (27.3) |
83.2 (28.4) |
85.4 (29.7) |
89.5 (31.9) |
86.8 (30.4) |
82.9 (28.3) |
76.6 (24.8) |
94.1 (34.5) |
| Average high °F (°C) | 65.1 (18.4) |
65.0 (18.3) |
65.6 (18.7) |
67.5 (19.7) |
68.5 (20.3) |
70.8 (21.6) |
74.6 (23.7) |
76.4 (24.7) |
75.9 (24.4) |
72.8 (22.7) |
69.0 (20.6) |
64.7 (18.2) |
69.7 (20.9) |
| Average low °F (°C) | 49.0 (9.4) |
50.7 (10.4) |
53.2 (11.8) |
55.9 (13.3) |
59.4 (15.2) |
62.0 (16.7) |
65.4 (18.6) |
66.7 (19.3) |
65.2 (18.4) |
60.6 (15.9) |
53.6 (12) |
48.4 (9.1) |
57.5 (14.2) |
| Mean minimum °F (°C) | 41.9 (5.5) |
44.6 (7) |
47.1 (8.4) |
50.7 (10.4) |
55.0 (12.8) |
59.1 (15.1) |
62.5 (16.9) |
63.3 (17.4) |
60.4 (15.8) |
54.4 (12.4) |
45.8 (7.7) |
41.4 (5.2) |
40.3 (4.6) |
| Record low °F (°C) | 25 (−4) |
34 (1) |
36 (2) |
39 (4) |
45 (7) |
50 (10) |
54 (12) |
54 (12) |
50 (10) |
43 (6) |
36 (2) |
32 (0) |
25 (−4) |
| Average rainfall inches (mm) | 1.98 (50.3) |
2.27 (57.7) |
1.81 (46) |
0.78 (19.8) |
0.12 (3) |
0.07 (1.8) |
0.03 (0.8) |
0.02 (0.5) |
0.15 (3.8) |
0.57 (14.5) |
1.01 (25.7) |
1.53 (38.9) |
10.34 (262.6) |
| Average rainy days (≥ 0.01 in) | 6.7 | 7.1 | 6.5 | 4.0 | 1.4 | 0.8 | 0.7 | 0.4 | 1.2 | 2.8 | 4.1 | 5.8 | 41.5 |
| Average relative humidity (%) | 63.1 | 65.7 | 67.3 | 67.0 | 70.6 | 74.0 | 74.6 | 74.1 | 72.7 | 69.4 | 66.3 | 63.7 | 69.0 |
| Mean monthly sunshine hours | 239.3 | 227.4 | 261.0 | 276.2 | 250.5 | 242.4 | 304.7 | 295.0 | 253.3 | 243.4 | 230.1 | 231.3 | 3,054.6 |
| Percent possible sunshine | 75 | 74 | 70 | 71 | 58 | 57 | 70 | 71 | 68 | 69 | 73 | 74 | 69 |
| Source: NOAA (sun and relative humidity 1961–1990)[41][42][43] | |||||||||||||
Precipitation

The large Westerly winds from the oceans also bring moisture, and the northern parts of the state generally receive higher annual rainfall amounts than the south. California's mountain ranges influence the climate as well: moisture-laden air from the west cools as it ascends the mountains, dropping moisture; some of the rainiest parts of the state are west-facing mountain slopes. Northwestern California has a temperate climate with rainfall of 15 inches (380 mm) to 50 inches (1,300 mm) per year. Some areas of Coast Redwood forest receive over 100 inches (2,500 mm) of precipitation per year.
The Central Valley has a wide range of precipitation. The northern parts of the Central Valley receive substantially greater precipitation from winter storms which sweep down from the Pacific Northwest, while the southernmost regions of the Central Valley are near desert-like because of a lack of precipitation. Parts of the Valley are occasionally filled with thick fog (known locally as "tule fog").
The high mountains, including the Sierra Nevada, the Cascade Range, and the Klamath Mountains, have a mountain climate with snow in winter and mild to moderate heat in summer. Ski resorts at Lake Tahoe, Mammoth Lakes, and Mount Shasta routinely receive over 10 feet (3.0 m) of snow in a season, and some years, substantially more – leading, for example, to annual ski races on the Fourth of July.
On the east side of the mountains is a drier rain shadow. California's desert climate regions lie east of the high Sierra Nevada and Southern California's Transverse Ranges and Peninsular Ranges. The low deserts east of the southern California mountains, including the Imperial and Coachella valleys and the lower Colorado River, are part of the Sonoran Desert, with minimal frost in the winter; the higher elevation deserts of eastern California, including the Mojave Desert, Owens Valley, and the Modoc Plateau, are part of the Great Basin region, which has a more continental climate. During the summer months, especially from July through early September, the region is affected by the Mexican Monsoon (also called the "southwest monsoon"), which drives moisture from the tropical Pacific, Gulf of California, and/or Gulf of Mexico into the deserts, setting off brief, but often torrential thunderstorms, particularly over mountainous terrain.
Despite its long coastline, California is not vulnerable to tropical cyclones. Because of the cold California Current from the North Pacific Ocean and the fact that the storms tend to "steer" west, California has only been hit with two tropical storms in recorded history, a storm which came ashore in 1939 and dumped heavy rainfall on the Los Angeles Area and interior deserts and Tropical Storm Nora. The remnants of tropical systems will affect California more commonly, every several years.
The ENSO cycle has a huge effect on rainfall and snowfall patterns in California, especially during the winter and spring seasons. During the El Niño phase, the jet stream is located south through California, allowing for warmer temperatures and more heavy rains to occur, particularly in the southern portions of the state. During the La Niña phase, the jet stream is much further north, and therefore the far northern portions of California are wetter, while the southern half stays cool and dry.
 Snow in the mountains of Southern California
 Summer in the Sierra Nevada at Lake Tahoe
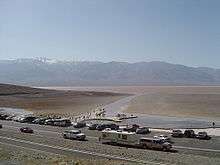 High precipitation in 2005 caused an ephemeral lake in the Badwater Basin of Death Valley.
Wildfires

|
|
Summers in inland California can see temperatures well over 100 °F (38 °C) during the day and less than 0.3 in (7.6 mm) of monthly rainfall, particularly in the southern areas. This makes them prone to wildfires. These can be life-threatening and cause evacuation. Wildfires are less common along the coast because of the cooler, more humid summers, but can occur in autumn when the marine layer is less common, making temperatures warmer and humidity drop significantly.
Glossary
The following are terms used to describe local or regional weather events.
- Santa Ana winds: Santa Anas are hot, high winds that blow from the eastern mountains and deserts towards coastal Southern California, usually in the spring and fall. They are the result of air pressure buildup between the Sierra Nevada and the Rocky Mountains. This air mass spills out, is pulled by gravity, and circulates clockwise around the high pressure area, bringing winds from the east and northeast; as the air descends in elevation, it heats up and the humidity plummets to less than 15 percent. It is often said that the air is heated and dried as it passes through the nearby deserts, but according to meteorologists this is a popular misconception (it is actually due to adiabatic compression as the air flows from the higher elevations down to sea level); during Santa Ana conditions, it is typically hotter along the coast than in the deserts. As the Santa Ana winds are channeled through the mountain passes they can approach hurricane force. The combination of speed, heat, and dryness turns the chaparral into explosive fuel for wildfires.
- Pineapple Express: A complex combination of events, bringing high levels of torrential precipitation to California. The Pineapple Express occurs when the jet stream dips across California, and warm, humid air from the mid-Pacific (from the vicinity of Hawaii–hence, the name) is drawn towards California. The resulting combination can cause extraordinarily heavy rains. A January 2005 Pineapple Express dropped nearly 25 inches (63.5 cm) of rain in Santa Barbara County.
- Tule fog: A thick ground fog that settles in the San Joaquin Valley and Sacramento Valley areas of the California Central Valley. Tule fog forms during the mid fall, winter to early spring after the first significant rainfall. This phenomenon is named after the tule grass wetlands of the Central Valley. Tule fog can extend from Bakersfield to Chico. Accidents caused by the tule fog are the leading cause of weather-related deaths in California; visibility is usually less than an eighth of a mile (about 600 feet or 183–200 m), but can be less than 10 feet (3 m).
- May Gray/June Gloom: A characteristic weather pattern of late spring (May and June) in which a combination of inland heat, off-shore cool water, and prevailing wind patterns bring foggy and overcast weather to coastal regions. From Point Conception northwards the gloom continues until early autumn. (See also: Catalina eddy)
- Marine layer: The cool, moist layer of air coming in from the ocean which typically includes fog. A standard weather phenomenon along the northern and central California coast from late spring to early fall.
- "Earthquake weather:" Any unseasonal, uncomfortable weather, typically hot and more humid than usual, and often associated with high and mid-level clouds, is spoken of (usually jokingly) as "earthquake weather."
Gallery
 Visitors at Redwood National Park
 Mediterranean climate at Santa Barbara
 Storms over California
 Storms over California
See also
- Climate change in California
- List of wettest known tropical cyclones in California
- Climate of Southern California
Notes
- ↑ Official records for Fresno kept September 1881 to 15 August 1887 at downtown, 16 August 1887 to June 1939 at Fresno City Offices, July 1939 to 20 August 1949 at Chandler Field, and at Fresno Yosemite Int'l since 21 August 1949. For more information, see Threadex
- 1 2
- ↑ Official records for Sacramento were kept exclusively at the airport since 10 November 1941.[33]
- ↑ The coordinates of the station are 37°46′14″N 122°25′37″W / 37.7706°N 122.4269°W. Precipitation, high temperature, low temperature, snow, and snow depth records date from 1 October 1849, 1 June 1874, 1 January 1875, 1 January 1876, and 1 January 1922, respectively.
- ↑ Mean monthly maxima and minima (i.e. the expected highest and lowest temperature readings at any point during the year or given month) calculated based on data at said location from 1981 to 2010.
- ↑ Mean monthly maxima and minima (i.e. the highest and lowest temperature readings during an entire month or year) calculated based on data at said location from 1981 to 2010.
- ↑ Official precipitation records for San Diego were kept at the Weather Bureau Office in downtown from October 1850 to December 1859 at the Mission San Diego and from November 1871 to June 1939 and a variety of buildings at downtown, and at San Diego Int'l (Lindbergh Field) since July 1939.[40] Temperature records, however, only date from October 1874. For more information on data coverage, see ThreadEx
References
- 1 2 "San Francisco Downtown, California". National Climatic Data Center (NCDC) 1981-2010 Monthly Normals. Western Regional Climate Center (WRCC), National Oceanic and Atmospheric Administration (NOAA).
- ↑ "San Francisco Oceanside, California". National Climatic Data Center (NCDC) 1981-2010 Monthly Normals. Western Regional Climate Center (WRCC), National Oceanic and Atmospheric Administration (NOAA).
- ↑ average temperatures in Walnut Creek.
- ↑ Average temperatures in Santa Monica compared to average temperatures in Burbank.
- ↑ 1981–2010 Monthly Climate Normals
- ↑ El Fadli, KI; et al. (September 2012). "World Meteorological Organization Assessment of the Purported World Record 58°C Temperature Extreme at El Azizia, Libya (13 September 1922)". Bulletin of the American Meteorological Society. 94 (2): 199. doi:10.1175/BAMS-D-12-00093.1. (The 136.4 °F (58 °C), claimed by 'Aziziya, Libya, on September 13, 1922, has been officially deemed invalid by the World Meteorological Organization.)
- ↑ "World Meteorological Organization World Weather / Climate Extremes Archive". Archived from the original on 4 January 2013. Retrieved 10 January 2013.
- ↑ "Alturas, California". National Climatic Data Center (NCDC) 1981-2010 Monthly Normals. Western Regional Climate Center (WRCC), National Oceanic and Atmospheric Administration (NOAA).
- ↑ "Bakersfield Airport, California". National Climatic Data Center (NCDC) 1981-2010 Monthly Normals. Western Regional Climate Center (WRCC), National Oceanic and Atmospheric Administration (NOAA).
- ↑ "Bishop Airport, California". National Climatic Data Center (NCDC) 1981-2010 Monthly Normals. Western Regional Climate Center (WRCC), National Oceanic and Atmospheric Administration (NOAA).
- ↑ "Bodie, California". National Climatic Data Center (NCDC) 1981-2010 Monthly Normals. Western Regional Climate Center (WRCC), National Oceanic and Atmospheric Administration (NOAA).
- ↑ "Death Valley". National Climatic Data Center (NCDC) 1981-2010 Monthly Normals. Western Regional Climate Center (WRCC), National Oceanic and Atmospheric Administration (NOAA).
- ↑ "Eureka WFO Woodley Island, California". National Climatic Data Center (NCDC) 1981-2010 Monthly Normals. Western Regional Climate Center (WRCC), National Oceanic and Atmospheric Administration (NOAA).
- ↑ "Fresno Yosemite International Airport, California". National Climatic Data Center (NCDC) 1981-2010 Monthly Normals. Western Regional Climate Center (WRCC), National Oceanic and Atmospheric Administration (NOAA).
- ↑ "Los Angeles Downtown University of Southern California Campus, California". National Climatic Data Center (NCDC) 1981-2010 Monthly Normals. Western Regional Climate Center (WRCC), National Oceanic and Atmospheric Administration (NOAA).
- ↑ "Needles Airport, California". National Climatic Data Center (NCDC) 1981-2010 Monthly Normals. Western Regional Climate Center (WRCC), National Oceanic and Atmospheric Administration (NOAA).
- ↑ "Redding Municipal Airport". National Climatic Data Center (NCDC) 1981-2010 Monthly Normals. Western Regional Climate Center (WRCC), National Oceanic and Atmospheric Administration (NOAA).
- ↑ "Riverside Fire Station 3, California". National Climatic Data Center (NCDC) 1981-2010 Monthly Normals. Western Regional Climate Center (WRCC), National Oceanic and Atmospheric Administration (NOAA).
- ↑ "Sacramento Executive Airport, California". National Climatic Data Center (NCDC) 1981-2010 Monthly Normals. Western Regional Climate Center (WRCC), National Oceanic and Atmospheric Administration (NOAA).
- ↑ "San Diego Lindbergh Field, California". National Climatic Data Center (NCDC) 1981-2010 Monthly Normals. Western Regional Climate Center (WRCC), National Oceanic and Atmospheric Administration (NOAA).
- ↑ "San Jose". National Climatic Data Center (NCDC) 1981-2010 Monthly Normals. Western Regional Climate Center (WRCC), National Oceanic and Atmospheric Administration (NOAA).
- ↑ "Santa Rosa, California". National Climatic Data Center (NCDC) 1981-2010 Monthly Normals. Western Regional Climate Center (WRCC), National Oceanic and Atmospheric Administration (NOAA).
- ↑ "South Lake Tahoe Airport, California". National Climatic Data Center (NCDC) 1981-2010 Monthly Normals. Western Regional Climate Center (WRCC), National Oceanic and Atmospheric Administration (NOAA).
- ↑ "NowData – NOAA Online Weather Data". National Oceanic and Atmospheric Administration. Retrieved 2012-12-03.
- ↑ "Station Name: CA FRESNO YOSEMITE INTL AP". National Oceanic and Atmospheric Administration. Retrieved 2014-04-22.
- ↑ "WMO Climate Normals for FRESNO/AIR TERMINAL CA 1961–1990". National Oceanic and Atmospheric Administration. Retrieved 2014-03-11.
- ↑ "Average Weather for Fresno, CA – Temperature and Precipitation". The Weather Channel. Retrieved 2011-09-20.
- 1 2 "NowData – NOAA Online Weather Data". National Oceanic and Atmospheric Administration. Retrieved June 7, 2013.
- ↑ "Station Name: CA LOS ANGELES DWTN USC CAMPUS". National Oceanic and Atmospheric Administration. Retrieved 2014-05-09.
- ↑ "LOS ANGELES/WBO CA Climate Normals". National Oceanic and Atmospheric Administration. Retrieved October 20, 2013.
- ↑ "Station Name: CA LOS ANGELES INTL AP". National Oceanic and Atmospheric Administration. Retrieved 2014-05-09.
- ↑ "WMO Climate Normals for LOS ANGELES/INTL, CA 1961–1990". National Oceanic and Atmospheric Administration. Retrieved 2014-04-17.
- ↑ ThreadEx
- 1 2 "NowData – NOAA Online Weather Data". National Oceanic and Atmospheric Administration. Retrieved 2016-04-19.
- ↑ "WMO Climate Normals for SACRAMENTO/EXECUTIVE ARPT CA 1961–1990". National Oceanic and Atmospheric Administration. Retrieved 2014-03-11.
- ↑ "SACRAMENTO 5 ESE, CALIFORNIA". Western Regional Climate Center.
- ↑ "NowData – NOAA Online Weather Data". National Oceanic and Atmospheric Administration. Retrieved 2016-04-17.
- ↑ "Station Name: CA SAN FRANCISCO DWTN". National Oceanic and Atmospheric Administration. Retrieved 2014-03-18.
- ↑ "San Francisco/Mission Dolores, CA Climate Normals 1961–1990". National Oceanic and Atmospheric Administration. Retrieved April 23, 2013.
- ↑ Conner, Glen. History of weather observations San Diego, California 1849–1948. Climate Database Modernization Program, NOAA's National Climatic Data Center. pp. 7–8.
- ↑ "NowData – NOAA Online Weather Data". National Oceanic and Atmospheric Administration. Retrieved 11 April 2016.
- ↑ "Station Name: CA San Diego Lindbergh FLD". National Oceanic & Atmospheric Administration. Retrieved 2 June 2015.
- ↑ "San Diego/Lindbergh Field CA Climate Normals 1961–1990". National Oceanic and Atmospheric Administration. Retrieved 2 June 2015.