Mariposa County, California
| Mariposa County, California | |||||
|---|---|---|---|---|---|
| County | |||||
| Mariposa County | |||||
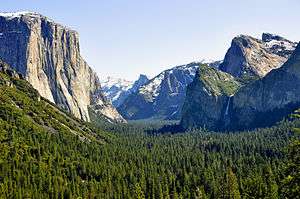
Images, from top down, left to right: The Mariposa County Courthouse; "The Dragon", crystalline gold from the Colorado Quartz Mine near Midpines; a view of Yosemite Valley from Tunnel View | |||||
| |||||
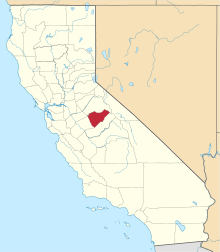 Location in the state of California | |||||
 California's location in the United States | |||||
| Country |
| ||||
| State |
| ||||
| Region | Sierra Nevada | ||||
| Incorporated | February 18, 1850[1] | ||||
| County seat | Mariposa | ||||
| Area | |||||
| • Total | 1,463 sq mi (3,790 km2) | ||||
| • Land | 1,449 sq mi (3,750 km2) | ||||
| • Water | 14 sq mi (40 km2) | ||||
| Population (April 1, 2010)[2] | |||||
| • Total | 18,251 | ||||
| • Estimate (2015)[2] | 17,531 | ||||
| • Density | 12/sq mi (4.8/km2) | ||||
| Time zone | Pacific Standard Time (UTC-8) | ||||
| • Summer (DST) | Pacific Daylight Time (UTC-7) | ||||
| Website | www.mariposacounty.org | ||||


Mariposa County is a county in the U.S. state of California. As of the 2010 census, the population was 18,251.[2] The county seat is Mariposa.[3] It is located in the western foothills of the Sierra Nevada mountains, north of Fresno, east of Merced, and southeast of Stockton.
The county's eastern section is the central portion of Yosemite National Park.
There are no incorporated cities in Mariposa County; however, there are communities recognized as census-designated places for statistical purposes. It also has the distinction of having no permanent traffic lights anywhere in the county.
History
Mariposa County was one of the original counties of California, created at the time of statehood in 1850. While it began as the state's largest county, territory that was once part of Mariposa was ceded over time to form twelve other counties: Fresno, Inyo, Kern, Kings, Los Angeles, Madera, Merced, Mono, San Benito, San Bernardino, San Luis Obispo, and Tulare. Thus, Mariposa County is known as the "Mother of Counties".[4]
Mariposa County's original seat was a now-nonexistent hamlet known as Agua Fria (Spanish for "cold water"), about 3 miles directly west of Mariposa proper on Agua Fria Road, which runs from Highway 140 to the south, to the community of Mt. Bullion to the northwest. Charles Fremont moved the county seat to Mariposa in 1854, resulting in the construction of the Mariposa County Courthouse, whose grounds occupies an entire block. The historic structure is fronted by Bullion Street; Jones Street is to the rear, with 9th and 10th Streets on either side. This handsome, white judicial building erected with whip-sawed wood from nearby forests is the oldest courthouse still in use in California: cases are still tried there to this day. The courthouse is so recognizable that its likeness is on the Mariposa County Seal. Also particularly noteworthy is the courthouse's clock tower and bell, which chimes every hour, on the hour, 24 hours a day, 7 days a week.
The county took its name from Mariposa Creek, which was so named by Spanish explorers in 1806, when they discovered a great cluster of butterflies ("mariposas" in Spanish and Portuguese) in the foothills of the Sierras. Each year, the first weekend in May, residents mark the annual arrival of migrating Monarch butterflies with a "Butterfly Days" festival and parade.
Gold Rush
Mariposa County is located at the southern end of California's Mother Lode region. During the California Gold Rush, great quantities of the prized mineral were found and extracted, first in local stream-beds and later in hard rock mines. One of the most notable beneficiaries of this wealth was the famed explorer and 1856 Republican presidential candidate, John Charles Frémont, for whom the local hospital and Charles Street (more commonly known as "Highway 140") are named. (Jessie Street, in the town of Mariposa, is named for Fremont's wife, Jessie Benton Frémont, who came to Mariposa with her husband on many extended visits although they never took up permanent residence within the county.)
Many aspects of the area's mining history are depicted in exhibits at two local museums: the Mariposa History Museum, located in the town of Mariposa; and the California Mining and Mineral Museum, located at the Mariposa Fairgrounds (2 miles east of Mariposa on Highway 49).
Two small gold mines in Mariposa county, the Mockingbird[5] and the Colorado Quartz,[6] intermittently produce world-class (and very expensive) specimens of crystalline gold for mineral collectors. "Specimens from these occurrences commonly have bright luster and rich color, with well-developed crystals in unusual and attractive arrangements."[7] The best-known example is "The Dragon", now on display at the Houston Museum of Natural Science.[8]
Geography
According to the U.S. Census Bureau, the county has a total area of 1,463 square miles (3,790 km2), of which 1,449 square miles (3,750 km2) is land and 14 square miles (36 km2) (1.0%) is water.[9] Along the banks of the Merced River is found the sole habitat for the Limestone salamander, a rare species endemic to Mariposa County.
National protected areas
- Sierra National Forest (part)
- Stanislaus National Forest (part)
- Yosemite National Park (part)
Demographics
2014
The largest self-reported ancestry groups in Mariposa County were English (14.5%), German (13.7%), Irish (13.1%), Italian (4.1%), "American" (3.8%), Scottish (3.2%) and Portuguese (3.0%).[10]
2011
| Population, race, and income | |||||
|---|---|---|---|---|---|
| Total population[11] | 18,290 | ||||
| White[11] | 16,357 | 89.4% | |||
| Black or African American[11] | 180 | 1.0% | |||
| American Indian or Alaska Native[11] | 335 | 1.8% | |||
| Asian[11] | 200 | 1.1% | |||
| Native Hawaiian or other Pacific Islander[11] | 50 | 0.3% | |||
| Some other race[11] | 458 | 2.5% | |||
| Two or more races[11] | 710 | 3.9% | |||
| Hispanic or Latino (of any race)[12] | 1,727 | 9.4% | |||
| Per capita income[13] | $27,209 | ||||
| Median household income[14] | $49,174 | ||||
| Median family income[15] | $58,237 | ||||
Places by population, race, and income
| Places by population and race | ||||||||
|---|---|---|---|---|---|---|---|---|
| Place | Type[16] | Population[11] | White[11] | Other[11] [note 1] |
Asian[11] | Black or African American[11] |
Native American[11] [note 2] |
Hispanic or Latino (of any race)[12] |
| Bear Valley | CDP | 255 | 100.0% | 0.0% | 0.0% | 0.0% | 0.0% | 0.0% |
| Bootjack | CDP | 951 | 85.0% | 13.6% | 1.5% | 0.0% | 0.0% | 0.0% |
| Buck Meadows | CDP | 12 | 0.0% | 0.0% | 100.0% | 0.0% | 0.0% | 0.0% |
| Catheys Valley | CDP | 811 | 83.5% | 16.5% | 0.0% | 0.0% | 0.0% | 11.6% |
| Coulterville | CDP | 190 | 100.0% | 0.0% | 0.0% | 0.0% | 0.0% | 7.4% |
| El Portal | CDP | 509 | 72.5% | 7.1% | 6.1% | 7.3% | 7.1% | 19.4% |
| Fish Camp | CDP | 53 | 41.5% | 0.0% | 0.0% | 0.0% | 58.5% | 0.0% |
| Greeley Hill | CDP | 805 | 97.8% | 0.6% | 0.0% | 0.1% | 1.5% | 6.3% |
| Hornitos | CDP | 67 | 100.0% | 0.0% | 0.0% | 0.0% | 0.0% | 0.0% |
| Lake Don Pedro | CDP | 1,088 | 88.4% | 7.1% | 3.4% | 1.1% | 0.0% | 14.8% |
| Mariposa | CDP | 2,479 | 74.4% | 18.3% | 0.0% | 0.4% | 7.0% | 27.4% |
| Midpines | CDP | 661 | 91.8% | 5.6% | 1.7% | 0.9% | 0.0% | 7.1% |
| Wawona | CDP | 80 | 56.2% | 0.0% | 43.8% | 0.0% | 0.0% | 0.0% |
| Yosemite Valley | CDP | 779 | 90.9% | 2.1% | 1.0% | 6.0% | 0.0% | 6.0% |
| Places by population and income | |||||
|---|---|---|---|---|---|
| Place | Type[16] | Population[17] | Per capita income[13] | Median household income[14] | Median family income[15] |
| Bear Valley | CDP | 255 | $17,787 | $15,417 | $12,050 |
| Bootjack | CDP | 951 | $26,801 | $45,875 | $46,333 |
| Buck Meadows | CDP | 12 | [18] | [18] | [18] |
| Catheys Valley | CDP | 811 | $18,940 | $26,759 | $26,759 |
| Coulterville | CDP | 190 | $9,579 | $12,351 | $43,000 |
| El Portal | CDP | 509 | $27,412 | $70,870 | $45,862 |
| Fish Camp | CDP | 53 | $15,630 | [18] | [18] |
| Greeley Hill | CDP | 805 | $19,854 | $29,333 | $28,625 |
| Hornitos | CDP | 67 | [18] | [18] | [18] |
| Lake Don Pedro | CDP | 1,088 | $44,112 | $83,372 | $86,771 |
| Mariposa | CDP | 2,479 | $19,614 | $43,418 | $39,830 |
| Midpines | CDP | 661 | $39,161 | $36,803 | $36,947 |
| Wawona | CDP | 80 | $19,068 | $22,353 | $85,156 |
| Yosemite Valley | CDP | 779 | $28,524 | $62,321 | $147,717 |
2010
| Historical population | |||
|---|---|---|---|
| Census | Pop. | %± | |
| 1850 | 4,379 | — | |
| 1860 | 6,243 | 42.6% | |
| 1870 | 4,572 | −26.8% | |
| 1880 | 4,339 | −5.1% | |
| 1890 | 3,787 | −12.7% | |
| 1900 | 4,720 | 24.6% | |
| 1910 | 3,956 | −16.2% | |
| 1920 | 2,775 | −29.9% | |
| 1930 | 3,233 | 16.5% | |
| 1940 | 5,605 | 73.4% | |
| 1950 | 5,145 | −8.2% | |
| 1960 | 5,064 | −1.6% | |
| 1970 | 6,015 | 18.8% | |
| 1980 | 11,108 | 84.7% | |
| 1990 | 14,302 | 28.8% | |
| 2000 | 17,130 | 19.8% | |
| 2010 | 18,251 | 6.5% | |
| Est. 2015 | 17,531 | [19] | −3.9% |
| U.S. Decennial Census[20] 1790–1960[21] 1900–1990[22] 1990–2000[23] 2010–2015[2] | |||
The 2010 United States Census reported that Mariposa County had a population of 18,251. The racial makeup of Mariposa County was 16,103 (88.2%) White, 138 (0.8%) African American, 527 (2.9%) Native American, 204 (1.1%) Asian, 26 (0.1%) Pacific Islander, 508 (2.8%) from other races, and 745 (4.1%) from two or more races. Hispanic or Latino of any race were 1,676 persons (9.2%).[24]
| Population reported at 2010 United States Census | |||||||||
|---|---|---|---|---|---|---|---|---|---|
Population | American | American | | Islander | races | more races | or Latino (of any race) | ||
| Mariposa County | 18,251 | 16,103 | 138 | 527 | 204 | 26 | 508 | 745 | 1,676 |
place | Population | American | American | | Islander | races | more races | or Latino (of any race) | |
| Bear Valley | 125 | 117 | 0 | 1 | 2 | 0 | 1 | 4 | 8 |
| Bootjack | 960 | 811 | 2 | 34 | 11 | 0 | 31 | 71 | 76 |
| Buck Meadows | 31 | 23 | 0 | 0 | 0 | 0 | 5 | 3 | 7 |
| Catheys Valley | 825 | 730 | 6 | 12 | 12 | 1 | 33 | 31 | 80 |
| Coulterville | 201 | 181 | 0 | 5 | 1 | 0 | 0 | 14 | 20 |
| El Portal | 474 | 434 | 1 | 9 | 5 | 0 | 5 | 20 | 28 |
| Fish Camp | 59 | 57 | 0 | 0 | 1 | 0 | 0 | 1 | 3 |
| Greeley Hill | 915 | 847 | 7 | 14 | 1 | 6 | 11 | 29 | 53 |
| Hornitos | 75 | 66 | 0 | 2 | 1 | 0 | 0 | 6 | 5 |
| Lake Don Pedro | 1,077 | 979 | 7 | 18 | 12 | 2 | 18 | 41 | 109 |
| Mariposa | 2,173 | 1,895 | 10 | 105 | 30 | 0 | 59 | 74 | 215 |
| Midpines | 1,204 | 990 | 4 | 63 | 7 | 0 | 97 | 43 | 208 |
| Wawona | 169 | 138 | 2 | 3 | 4 | 0 | 8 | 14 | 12 |
| Yosemite Valley | 1,035 | 831 | 28 | 31 | 31 | 7 | 70 | 37 | 123 |
communities | Population | American | American | | Islander | races | more races | or Latino (of any race) | |
| All others not CDPs (combined) | 8,928 | 8,004 | 71 | 230 | 86 | 10 | 170 | 357 | 729 |
2000
As of the census[25] of 2000, there were 17,130 people, 6,613 households, and 4,490 families residing in the county. The population density was 12 people per square mile (5/km²). There were 8,826 housing units at an average density of 6 per square mile (2/km²). The racial makeup of the county was 88.9% White, 0.7% Black or African American, 3.5% Native American, 0.7% Asian, 0.1% Pacific Islander, 2.7% from other races, and 3.4% from two or more races. 7.8% of the population were Hispanic or Latino of any race. 17.8% were of German, 13.4% English, 12.7% Irish and 6.7% American ancestry according to Census 2000. 96.0% spoke English and 3.5% Spanish as their first language.
There were 6,613 households out of which 25.6% had children under the age of 18 living with them, 55.8% were married couples living together, 8.0% had a female householder with no husband present, and 32.1% were non-families. 26.5% of all households were made up of individuals and 11.2% had someone living alone who was 65 years of age or older. The average household size was 2.37 and the average family size was 2.86.
In the county the population was spread out with 21.6% under the age of 18, 6.9% from 18 to 24, 25.1% from 25 to 44, 29.2% from 45 to 64, and 17.2% who were 65 years of age or older. The median age was 43 years. For every 100 females there were 104.7 males. For every 100 females age 18 and over, there were 105.4 males.
The median income for a household in the county was $34,626, and the median income for a family was $42,655. Males had a median income of $31,194 versus $25,440 for females. The per capita income for the county was $18,190. About 10.5% of families and 14.8% of the population were below the poverty line, including 16.5% of those under age 18 and 9.0% of those age 65 or over.
Government
The Government of Mariposa County is defined and authorized under the California Constitution and law as a general law county. The County government is composed of the Board of Supervisors, which has legislative and executive power. It is composed of five members elected from the five separate districts of the County, on a non-partisan basis, to serve four-year staggered terms.
State and federal representation
In the California State Legislature, Mariposa is in the 8th Senate District, represented by Republican Tom Berryhill, and in the 5th Assembly District, represented by Republican Frank Bigelow.
In the United States House of Representatives, Mariposa County is in California's 4th congressional district, represented by Republican Tom McClintock.[26]
Politics
| Year | GOP | DEM | Others |
|---|---|---|---|
| 2012 | 57.1% 5,140 | 38.8% 3,498 | 4.1% 362 |
| 2008 | 55.2% 4,880 | 42.6% 3,766 | 2.3% 199 |
| 2004 | 60.2% 5,215 | 37.6% 3,251 | 2.2% 192 |
| 2000 | 58.5% 4,727 | 34.9% 2,816 | 6.6% 531 |
| 1996 | 50.0% 3,976 | 36.7% 2,920 | 13.3% 1,053 |
| 1992 | 36.0% 2,982 | 36.5% 3,023 | 27.5% 2,282 |
| 1988 | 54.5% 3,768 | 43.4% 2,998 | 2.1% 144 |
| 1984 | 61.2% 3,989 | 36.8% 2,399 | 2.0% 130 |
| 1980 | 55.0% 3,082 | 33.7% 1,889 | 11.4% 637 |
| 1976 | 46.6% 2,012 | 48.5% 2,093 | 4.9% 212 |
| 1972 | 56.2% 2,122 | 39.3% 1,487 | 4.5% 170 |
| 1968 | 49.9% 1,496 | 39.6% 1,187 | 10.5% 314 |
| 1964 | 42.6% 1,264 | 57.4% 1,704 | |
| 1960 | 54.0% 1,599 | 45.2% 1,338 | 0.9% 26 |
Mariposa is a strongly Republican county in Presidential and congressional elections. The last Democrat to win a majority in the county was Lyndon Johnson in 1964 but the last Democrat to win the county was Bill Clinton in 1992 who won a plurality.
On Nov. 4, 2008 Mariposa County voted 62.3% for Proposition 8 which amended the California Constitution to ban same-sex marriages.
Voter registration
| Population and registered voters | ||
|---|---|---|
| Total population[11] | 18,290 | |
| Registered voters[27][note 3] | 10,613 | 58.0% |
| Democratic[27] | 3,156 | 29.7% |
| Republican[27] | 4,751 | 44.8% |
| Democratic–Republican spread[27] | -1,595 | -15.1% |
| Independent[27] | 459 | 4.3% |
| Green[27] | 117 | 1.1% |
| Libertarian[27] | 97 | 0.9% |
| Peace and Freedom[27] | 22 | 0.2% |
| Americans Elect[27] | 1 | 0.0% |
| Other[27] | 155 | 1.5% |
| No party preference[27] | 1,855 | 17.5% |
Crime
The following table includes the number of incidents reported and the rate per 1,000 persons for each type of offense.
| Population and crime rates | ||
|---|---|---|
| Population[11] | 18,290 | |
| Violent crime[28] | 48 | 2.62 |
| Homicide[28] | 0 | 0.00 |
| Forcible rape[28] | 3 | 0.16 |
| Robbery[28] | 1 | 0.05 |
| Aggravated assault[28] | 44 | 2.41 |
| Property crime[28] | 179 | 9.79 |
| Burglary[28] | 106 | 5.80 |
| Larceny-theft[28][note 4] | 173 | 9.46 |
| Motor vehicle theft[28] | 16 | 0.87 |
| Arson[28] | 1 | 0.05 |
Healthcare
Mariposa County has one hospital, John C. Fremont Hospital.
Mariposa County has the highest rate of child abuse and neglect,[29] and the second highest of rate of unvaccinated children[30] in the state of California.
Media
Several media sources are located in Mariposa. These include:
Online
Transportation
Major highways
Public transportation
- Mariposa County Transit provides dial-a-ride and some fixed route service
- Yosemite Area Regional Transportation System (YARTS) provides service along State Routes 120 and 140 to Yosemite National Park.
Airports
Mariposa Yosemite Airport is a general aviation airport. The nearest airports with scheduled flights are in Fresno and Merced.
Communities

Census-designated places
Unincorporated communities
- Foresta
- Jerseydale
- Lush Meadows
- Mt. Bullion
- Oak Grove Estates
- Ponderosa Basin
- Yosemite West
Population ranking
The population ranking of the following table is based on the 2010 census of Mariposa County.[31]
† county seat
| Rank | City/Town/etc. | Municipal type | Population (2010 Census)
|
|---|---|---|---|
| 1 | † Mariposa | CDP | 2,173 |
| 2 | Midpines | CDP | 1,204 |
| 3 | Lake Don Pedro | CDP | 1,077 |
| 4 | Yosemite Valley | CDP | 1,035 |
| 5 | Bootjack | CDP | 960 |
| 6 | Greeley Hill | CDP | 915 |
| 7 | Catheys Valley | CDP | 825 |
| 8 | El Portal | CDP | 474 |
| 9 | Coulterville | CDP | 201 |
| 10 | Wawona | CDP | 169 |
| 11 | Bear Valley | CDP | 125 |
| 12 | Hornitos | CDP | 75 |
| 13 | Fish Camp | CDP | 59 |
| 14 | Buck Meadows | CDP | 31 |
See also
- List of school districts in Mariposa County, California
- National Register of Historic Places listings in Mariposa County, California
- Valley and Sierra Miwok people
- Yokut people (Mariposan)
Notes
- ↑ Other = Some other race + Two or more races
- ↑ Native American = Native Hawaiian or other Pacific Islander + American Indian or Alaska Native
- ↑ Percentage of registered voters with respect to total population. Percentages of party members with respect to registered voters follow.
- ↑ Only larceny-theft cases involving property over $400 in value are reported as property crimes.
References
- ↑ "Chronology". California State Association of Counties. Retrieved February 6, 2015.
- 1 2 3 4 "State & County QuickFacts". United States Census Bureau. Retrieved April 4, 2016.
- ↑ "Find a County". National Association of Counties. Retrieved 2011-06-07.
- ↑ "Mariposa: Mother Of Counties". Superior Court of California, County of Mariposa. Retrieved 2009-05-17.
- ↑ Mockingbird Mine
- ↑ Colorado Quartz mine
- ↑ The Colorado Quartz Gold Mine, Rocks and Minerals, Sept-Oct 2009.
- ↑ "The Dragon"
- ↑ "2010 Census Gazetteer Files". United States Census Bureau. August 22, 2012. Retrieved September 28, 2015.
- ↑ http://factfinder.census.gov/bkmk/table/1.0/en/ACS/14_5YR/DP02/0500000US06043
- 1 2 3 4 5 6 7 8 9 10 11 12 13 14 15 16 U.S. Census Bureau. American Community Survey, 2011 American Community Survey 5-Year Estimates, Table B02001. American FactFinder. Retrieved 2013-10-26.
- 1 2 U.S. Census Bureau. American Community Survey, 2011 American Community Survey 5-Year Estimates, Table B03003. American FactFinder. Retrieved 2013-10-26.
- 1 2 U.S. Census Bureau. American Community Survey, 2011 American Community Survey 5-Year Estimates, Table B19301. American FactFinder. Retrieved 2013-10-21.
- 1 2 U.S. Census Bureau. American Community Survey, 2011 American Community Survey 5-Year Estimates, Table B19013. American FactFinder. Retrieved 2013-10-21.
- 1 2 U.S. Census Bureau. American Community Survey, 2011 American Community Survey 5-Year Estimates, Table B19113. American FactFinder. Retrieved 2013-10-21.
- 1 2 U.S. Census Bureau. American Community Survey, 2011 American Community Survey 5-Year Estimates. American FactFinder. Retrieved 2013-10-21.
- ↑ U.S. Census Bureau. American Community Survey, 2011 American Community Survey 5-Year Estimates, Table B01003. American FactFinder. Retrieved 2013-10-21.
- 1 2 3 4 5 6 7 8 Data unavailable
- ↑ "County Totals Dataset: Population, Population Change and Estimated Components of Population Change: April 1, 2010 to July 1, 2015". Retrieved July 2, 2016.
- ↑ "U.S. Decennial Census". United States Census Bureau. Retrieved September 28, 2015.
- ↑ "Historical Census Browser". University of Virginia Library. Retrieved September 28, 2015.
- ↑ Forstall, Richard L., ed. (March 27, 1995). "Population of Counties by Decennial Census: 1900 to 1990". United States Census Bureau. Retrieved September 28, 2015.
- ↑ "Census 2000 PHC-T-4. Ranking Tables for Counties: 1990 and 2000" (PDF). United States Census Bureau. April 2, 2001. Retrieved September 28, 2015.
- ↑ "2010 Census P.L. 94-171 Summary File Data". United States Census Bureau.
- ↑ "American FactFinder". United States Census Bureau. Retrieved 2011-05-14.
- ↑ "California's 4th Congressional District - Representatives & District Map". Civic Impulse, LLC. Retrieved March 1, 2013.
- 1 2 3 4 5 6 7 8 9 10 11 California Secretary of State. February 10, 2013 - Report of Registration. Retrieved 2013-10-31.
- 1 2 3 4 5 6 7 8 9 10 Office of the Attorney General, Department of Justice, State of California. Table 11: Crimes – 2009. Retrieved 2013-11-14.
- ↑ Mariposa County has state’s highest rate of child abuse | www.mariposagazette.com | Mariposa Gazette | News for the Mariposa-Yosemite region
- ↑ County’s youth second highest of unvaccinated in the entire state | www.mariposagazette.com | Mariposa Gazette | News for the Mariposa-Yosemite region
- ↑ 2010 Census
Further reading
- A Memorial and Biographical History of the Counties of Merced, Stanislaus, Calaveras, Tuolumne and Mariposa, California. Chicago: Lewis Publishing Co., 1892.
External links
- Official website
- Mariposa County Chamber of Commerce
- Yosemite / Mariposa County Tourism Bureau
- Daily News and Photos of Mariposa County
- History and Genealogy of Mariposa County
- Mockingbird mine crystalline gold discovery, circa 2006, includes photo gallery
Coordinates: 37°35′N 119°55′W / 37.58°N 119.91°W
| Wikimedia Commons has media related to Mariposa County, California. |
 |
Stanislaus County | Tuolumne County | | |
| Merced County | |
Madera County | ||
| ||||
| | ||||
| Madera County |
Municipalities and communities of Mariposa County, California, United States | ||
|---|---|---|
| CDPs | | |
| Unincorporated communities | ||
| Former settlements | ||