Sutter County, California
| Sutter County, California | |||||
|---|---|---|---|---|---|
| County | |||||
| County of Sutter | |||||
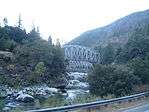
Images, from top down, left to right: Sutter Buttes terrain, Live Oak Blvd near Pennington Road in the City of Live Oak, bridges crossing the Feather River | |||||
| |||||
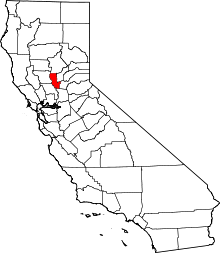 Location in the state of California | |||||
 California's location in the United States | |||||
| Country |
| ||||
| State |
| ||||
| Region | Sacramento Valley | ||||
| Metro area | Sacramento metropolitan area | ||||
| Incorporated | February 18, 1850[1] | ||||
| County seat | Yuba City | ||||
| Area | |||||
| • Total | 1,570 km2 (608 sq mi) | ||||
| • Land | 1,560 km2 (602 sq mi) | ||||
| • Water | 16 km2 (6.1 sq mi) | ||||
| Population (April 1, 2010)[2] | |||||
| • Total | 94,737 | ||||
| • Estimate (2015)[2] | 96,463 | ||||
| • Density | 60/km2 (160/sq mi) | ||||
| Time zone | Pacific Time Zone (UTC-8) | ||||
| • Summer (DST) | Pacific Daylight Time (UTC-7) | ||||
| Website | www.co.sutter.ca.us | ||||


Sutter County is a county in the U.S. state of California. As of the 2010 census, the population was 94,737.[2] The county seat is Yuba City.[3]
Sutter County is included in the Yuba City, CA Metropolitan Statistical Area as well as the Sacramento-Roseville, CA Combined Statistical Area. The county is located along the Sacramento River in the Sacramento Valley.
History
Sutter County was one of the original counties of California, created in 1850 at the time of statehood. Parts of the county were given to Placer County in 1852.
Sutter County is named after one of the state’s more engaging and complex historical personalities, and an agricultural visionary. John Augustus Sutter, a German native born to Swiss parents, was one of the first to recognize the Sacramento Valley for its potential as an agricultural empire, and his Hock Farm, established in 1841 on the Feather River just south of present-day Yuba City, was the site of the valley’s first large agricultural enterprise.
Sutter obtained the Rancho New Helvetia Mexican land grant, and called his first settlement New Helvetia (which included the present day city of Sacramento). In 1850, Sutter retired to Hock Farm when gold seekers deprived him of most of his holdings at Sacramento.
Sutter County is the birthplace (Yuba City, 1858) of John Joseph Montgomery, who was the first American to successfully pilot a heavier than air craft, 20 years before the Wright Brothers, and who held the first patent for an "aeroplane."
In the 1890s Sutter County was one of the two prohibition counties in California; the other was Riverside County. Both outlawed saloons and sale or consumption of alcohol in public.[4]
Geography
According to the U.S. Census Bureau, the county has a total area of 608 square miles (1,570 km2), of which 602 square miles (1,560 km2) is land and 6.1 square miles (16 km2) (1.0%) is water.[5] It is the fourth-smallest county in California by total area. Some 88 percent of the county is prime farmland and grazing land.
Sutter County is home to the Sutter Buttes, known as the "World's Smallest Mountain Range." This volcanic formation provides relief to the otherwise seemingly flat Sacramento Valley.
Bordered by the Sacramento River on the west and the Feather River on the east, Sutter County has 240 miles (390 km) of levees. The Sutter Bypass, which diverts flood waters from the Sacramento River, cuts through the heart of Sutter County.
National protected areas
Sutter County also has the State Feather River Wildlife Area, consisting of the Nelson Slough, O'Connor Lakes, Abbott Lake, Shanghai Bend, and Morse Road Units in Sutter County. Also, a 1795 acre State Park in the Sutter Buttes. In addition, there are the state public trust lands of the Feather, Bear and Sacramento rivers as well as smaller streams including Butte Creek and Butte Slough.
Transportation
Major highways
Public transportation
Yuba Sutter Transit operates local bus service, as well as commuter runs to Downtown Sacramento.
Airports
Sutter County Airport is a general aviation airport located just south of Yuba City.
Politics
Voter registration statistics
| Population and registered voters | ||
|---|---|---|
| Total population[6] | 94,192 | |
| Registered voters[7][note 1] | 41,760 | 44.3% |
| Democratic[7] | 13,557 | 32.5% |
| Republican[7] | 18,571 | 44.5% |
| Democratic–Republican spread[7] | -5,014 | -12.0% |
| Independent[7] | 1,328 | 3.2% |
| Green[7] | 117 | 0.3% |
| Libertarian[7] | 224 | 0.5% |
| Peace and Freedom[7] | 124 | 0.3% |
| Americans Elect[7] | 1 | 0.0% |
| Other[7] | 550 | 1.3% |
| No party preference[7] | 7,288 | 17.5% |
Cities by population and voter registration
| Cities by population and voter registration | |||||||
|---|---|---|---|---|---|---|---|
| City | Population[6] | Registered voters[7] [note 1] |
Democratic[7] | Republican[7] | D–R spread[7] | Other[7] | No party preference[7] |
| Live Oak | 8,244 | 35.9% | 44.5% | 29.9% | +14.6% | 8.9% | 19.6% |
| Yuba City | 64,224 | 42.6% | 34.2% | 41.3% | -7.1% | 9.2% | 18.7% |
Overview
| Year | GOP | DEM | Others |
|---|---|---|---|
| 2012 | 58.3% 18,122 | 39.2% 12,192 | 2.5% 769 |
| 2008 | 57.3% 18,911 | 40.6% 13,412 | 2.1% 698 |
| 2004 | 67.2% 20,254 | 31.9% 9,602 | 1.0% 289 |
| 2000 | 65.3% 17,350 | 31.7% 8,416 | 3.0% 798 |
| 1996 | 57.6% 14,264 | 34.4% 8,504 | 8.0% 1,977 |
| 1992 | 50.1% 12,956 | 30.5% 7,883 | 19.4% 5,021 |
| 1988 | 67.5% 14,100 | 31.1% 6,557 | 1.2% 241 |
| 1984 | 71.2% 14,477 | 27.2% 5,535 | 1.5% 311 |
| 1980 | 63.5% 11,778 | 27.5% 5,103 | 9.0% 1,676 |
| 1976 | 54.2% 8,745 | 43.2% 6,966 | 2.6% 420 |
| 1972 | 62.5% 10,224 | 33.0% 5,409 | 4.5% 739 |
| 1968 | 59.8% 8,665 | 31.8% 4,624 | 8.6% 1,256 |
| 1964 | 51.6% 7,241 | 48.3% 6,787 | 0.1% 16 |
| 1960 | 62.9% 7,520 | 36.6% 4,379 | 0.5% 55 |
| 1956 | 62.8% 6,327 | 36.5% 3,673 | 0.8% 77 |
| 1952 | 67.3% 7,053 | 32.3% 3,382 | 0.4% 44 |
| 1948 | 52.5% 3,913 | 45.1% 3,362 | 2.5% 183 |
| 1944 | 50.0% 3,111 | 49.5% 3,083 | 0.5% 29 |
| 1940 | 42.1% 3,089 | 57.1% 4,195 | 0.8% 61 |
| 1936 | 28.1% 1,613 | 70.0% 4,019 | 1.9% 106 |
| 1932 | 25.7% 1,392 | 70.4% 3,807 | 3.8% 208 |
| 1928 | 54.0% 2,239 | 45.2% 1,875 | 0.8% 34 |
| 1924 | 49.9% 1,617 | 11.3% 367 | 38.8% 1,255 |
| 1920 | 70.3% 1,862 | 24.0% 636 | 5.7% 150 |
Sutter is a strongly Republican county in presidential and congressional elections. The last Democrat to win a majority in the county was Franklin Roosevelt in 1940.
In the United States House of Representatives, Sutter County is in California's 3rd congressional district, represented by Democrat John Garamendi.[8]
In the California State Legislature, the county is in the 4th Senate District, represented by Republican Jim Nielsen,[9] and the 3rd Assembly District, represented by Republican James Gallagher.
On November 4, 2008, Sutter County voted 70.7% for Proposition 8 which amended the California Constitution to ban same-sex marriages.
Crime
The following table includes the number of incidents reported and the rate per 1,000 persons for each type of offense.
| Population and crime rates | ||
|---|---|---|
| Population[6] | 94,192 | |
| Violent crime[10] | 316 | 3.35 |
| Homicide[10] | 1 | 0.01 |
| Forcible rape[10] | 24 | 0.25 |
| Robbery[10] | 54 | 0.57 |
| Aggravated assault[10] | 237 | 2.52 |
| Property crime[10] | 1,038 | 11.02 |
| Burglary[10] | 446 | 4.74 |
| Larceny-theft[10][note 2] | 1,474 | 15.65 |
| Motor vehicle theft[10] | 201 | 2.13 |
| Arson[10] | 11 | 0.12 |
Cities by population and crime rates
| Cities by population and crime rates | ||||||||
|---|---|---|---|---|---|---|---|---|
| City | Population[11] | Violent crimes[11] | Violent crime rate per 1,000 persons |
Property crimes[11] | Property crime rate per 1,000 persons | |||
| Yuba City | 65,653 | 247 | 3.76 | 1,982 | 30.19 | |||
Demographics
2011
| Population, race, and income | |||||
|---|---|---|---|---|---|
| Total population[6] | 94,192 | ||||
| White[6] | 61,951 | 65.8% | |||
| Black or African American[6] | 1,800 | 1.9% | |||
| American Indian or Alaska Native[6] | 1,428 | 1.5% | |||
| Asian[6] | 13,029 | 13.8% | |||
| Native Hawaiian or other Pacific Islander[6] | 290 | 0.3% | |||
| Some other race[6] | 10,267 | 10.9% | |||
| Two or more races[6] | 5,427 | 5.8% | |||
| Hispanic or Latino (of any race)[12] | 26,642 | 28.3% | |||
| Per capita income[13] | $22,464 | ||||
| Median household income[14] | $50,010 | ||||
| Median family income[15] | $54,737 | ||||
Places by population, race, and income
| Places by population and race | ||||||||
|---|---|---|---|---|---|---|---|---|
| Place | Type[16] | Population[6] | White[6] | Other[6] [note 3] |
Asian[6] | Black or African American[6] |
Native American[6] [note 4] |
Hispanic or Latino (of any race)[12] |
| East Nicolaus | CDP | 301 | 36.9% | 46.5% | 16.6% | 0.0% | 0.0% | 46.5% |
| Live Oak | City | 8,244 | 58.4% | 30.7% | 8.3% | 0.4% | 2.2% | 50.3% |
| Meridian | CDP | 485 | 97.3% | 2.7% | 0.0% | 0.0% | 0.0% | 17.5% |
| Nicolaus | CDP | 183 | 81.4% | 4.4% | 13.1% | 1.1% | 0.0% | 0.0% |
| Rio Oso | CDP | 349 | 100.0% | 0.0% | 0.0% | 0.0% | 0.0% | 15.2% |
| Robbins | CDP | 285 | 82.1% | 16.5% | 0.0% | 0.0% | 1.4% | 54.0% |
| Sutter | CDP | 2,892 | 88.1% | 9.2% | 0.2% | 0.6% | 1.8% | 9.0% |
| Trowbridge | CDP | 112 | 95.5% | 4.5% | 0.0% | 0.0% | 0.0% | 0.0% |
| Yuba City | City | 64,224 | 62.2% | 16.2% | 17.3% | 2.4% | 1.9% | 28.5% |
| Places by population and income | |||||
|---|---|---|---|---|---|
| Place | Type[16] | Population[17] | Per capita income[13] | Median household income[14] | Median family income[15] |
| East Nicolaus | CDP | 301 | $18,776 | $32,813 | $40,833 |
| Live Oak | City | 8,244 | $16,052 | $41,773 | $40,919 |
| Meridian | CDP | 485 | $30,530 | $53,125 | $77,500 |
| Nicolaus | CDP | 183 | $35,223 | $75,000 | $100,000 |
| Rio Oso | CDP | 349 | $32,149 | $85,750 | $90,357 |
| Robbins | CDP | 285 | $22,532 | $55,625 | $55,268 |
| Sutter | CDP | 2,892 | $28,772 | $62,708 | $76,667 |
| Trowbridge | CDP | 112 | $33,904 | $60,833 | $62,083 |
| Yuba City | City | 64,224 | $21,566 | $48,830 | $53,818 |
2010
The 2010 United States Census reported that Sutter County had a population of 94,737. The racial makeup of Sutter County was 57,749 (61.0%) White, 1,919 (2.0%) African American, 1,365 (1.4%) Native American, 13,663 (14.4%) Asian, 281 (0.3%) Pacific Islander, 14,463 (15.3%) from other races, and 5,297 (5.6%) from two or more races. Hispanic or Latino of any race were 27,251 persons (28.8%).[18]
| Population reported at 2010 United States Census | |||||||||
|---|---|---|---|---|---|---|---|---|---|
Population | American | American | | Islander | races | more races | or Latino (of any race) | ||
| Sutter County | 94,737 | 57,749 | 1,919 | 1,365 | 13,663 | 281 | 14,463 | 5,297 | 27,251 |
cities | Population | American | American | | Islander | races | more races | or Latino (of any race) | |
| Live Oak | 8,392 | 4,491 | 138 | 130 | 978 | 17 | 2,173 | 465 | 4,093 |
| Yuba City | 64,925 | 37,382 | 1,591 | 909 | 11,190 | 228 | 9,772 | 3,853 | 18,413 |
places | Population | American | American | | Islander | races | more races | or Latino (of any race) | |
| East Nicolaus | 225 | 159 | 0 | 1 | 19 | 0 | 41 | 5 | 49 |
| Meridian | 358 | 268 | 2 | 7 | 0 | 0 | 58 | 23 | 85 |
| Nicolaus | 211 | 186 | 1 | 0 | 5 | 0 | 10 | 9 | 13 |
| Rio Oso | 356 | 274 | 5 | 7 | 26 | 1 | 32 | 11 | 53 |
| Robbins | 323 | 208 | 0 | 9 | 5 | 0 | 94 | 7 | 181 |
| Sutter | 2,904 | 2,503 | 16 | 54 | 30 | 1 | 160 | 140 | 410 |
| Trowbridge | 226 | 167 | 3 | 5 | 25 | 0 | 15 | 11 | 38 |
communities | Population | American | American | | Islander | races | more races | or Latino (of any race) | |
| All others not CDPs (combined) | 16,817 | 12,111 | 163 | 243 | 1,385 | 34 | 2,108 | 773 | 3,916 |
2000
| Historical population | |||
|---|---|---|---|
| Census | Pop. | %± | |
| 1850 | 3,444 | — | |
| 1860 | 3,390 | −1.6% | |
| 1870 | 5,030 | 48.4% | |
| 1880 | 5,159 | 2.6% | |
| 1890 | 5,469 | 6.0% | |
| 1900 | 5,886 | 7.6% | |
| 1910 | 6,328 | 7.5% | |
| 1920 | 10,115 | 59.8% | |
| 1930 | 14,618 | 44.5% | |
| 1940 | 18,680 | 27.8% | |
| 1950 | 26,239 | 40.5% | |
| 1960 | 33,380 | 27.2% | |
| 1970 | 41,935 | 25.6% | |
| 1980 | 52,246 | 24.6% | |
| 1990 | 64,415 | 23.3% | |
| 2000 | 78,930 | 22.5% | |
| 2010 | 94,737 | 20.0% | |
| Est. 2015 | 96,463 | [19] | 1.8% |
| U.S. Decennial Census[20] 1790-1960[21] 1900-1990[22] 1990-2000[23] 2010-2015[2] | |||
As of the census[24] of 2000, there were 78,930 people, 27,033 households, and 19,950 families residing in the county. The population density was 131 people per square mile (51/km²). There were 28,319 housing units at an average density of 47 per square mile (18/km²). The racial makeup of the county was 67.5% White, 1.9% Black or African American, 1.6% Native American, 11.3% Asian, 0.2% Pacific Islander, 13.0% from other races, and 4.6% from two or more races. 22.2% of the population were Hispanic or Latino of any race. 10.3% were of German, 9.0% American, 7.1% English and 6.1% Irish ancestry according to Census 2000. 70.3% spoke English, 17.9% Spanish and 9.3% Punjabi as their first language.
There were 27,033 households out of which 37.9% had children under the age of 18 living with them, 57.0% were married couples living together, 11.7% had a female householder with no husband present, and 26.2% were non-families. 21.2% of all households were made up of individuals and 8.6% had someone living alone who was 65 years of age or older. The average household size was 2.87 and the average family size was 3.35.
In the county the population was spread out with 29.0% under the age of 18, 9.2% from 18 to 24, 28.2% from 25 to 44, 21.3% from 45 to 64, and 12.4% who were 65 years of age or older. The median age was 34 years. For every 100 females there were 98.0 males. For every 100 females age 18 and over, there were 94.3 males.
The median income for a household in the county was $38,375, and the median income for a family was $44,330. Males had a median income of $35,723 versus $25,778 for females. The per capita income for the county was $17,428. About 12.1% of families and 15.5% of the population were below the poverty line, including 21.3% of those under age 18 and 7.7% of those age 65 or over.
Media
MySYtv.com provides television coverage of local events in the area.
Communities
Cities
Census-designated places
Unincorporated communities
- Catlett
- Kirkville
- Lee
- Pleasant Grove
- Riego
- Rio Ramaza
- Verona
- Tierra Buena
Proposed town
Population ranking
The population ranking of the following table is based on the 2010 census of Sutter County.[25]
† county seat
| Rank | City/Town/etc. | Municipal type | Population (2010 Census)
|
|---|---|---|---|
| 1 | † Yuba City | City | 64,925 |
| 2 | Live Oak | City | 8,392 |
| 3 | Sutter | CDP | 2,904 |
| 4 | Meridian | CDP | 358 |
| 5 | Rio Oso | CDP | 356 |
| 6 | Robbins | CDP | 323 |
| 7 | Trowbridge | CDP | 226 |
| 8 | East Nicolaus | CDP | 225 |
| 9 | Nicolaus | CDP | 211 |
See also
- Hiking trails in Sutter County
- List of school districts in Sutter County, California
- National Register of Historic Places listings in Sutter County, California
Notes
- 1 2 Percentage of registered voters with respect to total population. Percentages of party members with respect to registered voters follow.
- ↑ Only larceny-theft cases involving property over $400 in value are reported as property crimes.
- ↑ Other = Some other race + Two or more races
- ↑ Native American = Native Hawaiian or other Pacific Islander + American Indian or Alaska Native
References
- ↑ "Chronology". California State Association of Counties. Retrieved February 6, 2015.
- 1 2 3 4 "State & County QuickFacts". United States Census Bureau. Retrieved April 6, 2016.
- ↑ "Find a County". National Association of Counties. Retrieved 2011-06-07.
- ↑ Berkeley Gazette, 1905. July 28
- ↑ "US Gazetteer files: 2010, 2000, and 1990". United States Census Bureau. 2011-02-12. Retrieved 2011-04-23.
- 1 2 3 4 5 6 7 8 9 10 11 12 13 14 15 16 17 U.S. Census Bureau. American Community Survey, 2011 American Community Survey 5-Year Estimates, Table B02001. American FactFinder. Retrieved 2013-10-26.
- 1 2 3 4 5 6 7 8 9 10 11 12 13 14 15 16 17 California Secretary of State. February 10, 2013 - Report of Registration. Retrieved 2013-10-31.
- ↑ "California's 3rd Congressional District - Representatives & District Map". Civic Impulse, LLC. Retrieved March 1, 2013.
- ↑ "Communities of Interest — County". California Citizens Redistricting Commission. Retrieved September 28, 2014.
- 1 2 3 4 5 6 7 8 9 10 Office of the Attorney General, Department of Justice, State of California. Table 11: Crimes – 2009. Retrieved 2013-11-14.
- 1 2 3 United States Department of Justice, Federal Bureau of Investigation. Crime in the United States, 2012, Table 8 (California). Retrieved 2013-11-14.
- 1 2 U.S. Census Bureau. American Community Survey, 2011 American Community Survey 5-Year Estimates, Table B03003. American FactFinder. Retrieved 2013-10-26.
- 1 2 U.S. Census Bureau. American Community Survey, 2011 American Community Survey 5-Year Estimates, Table B19301. American FactFinder. Retrieved 2013-10-21.
- 1 2 U.S. Census Bureau. American Community Survey, 2011 American Community Survey 5-Year Estimates, Table B19013. American FactFinder. Retrieved 2013-10-21.
- 1 2 U.S. Census Bureau. American Community Survey, 2011 American Community Survey 5-Year Estimates, Table B19113. American FactFinder. Retrieved 2013-10-21.
- 1 2 U.S. Census Bureau. American Community Survey, 2011 American Community Survey 5-Year Estimates. American FactFinder. Retrieved 2013-10-21.
- ↑ U.S. Census Bureau. American Community Survey, 2011 American Community Survey 5-Year Estimates, Table B01003. American FactFinder. Retrieved 2013-10-21.
- ↑ "2010 Census P.L. 94-171 Summary File Data". United States Census Bureau.
- ↑ "County Totals Dataset: Population, Population Change and Estimated Components of Population Change: April 1, 2010 to July 1, 2015". Retrieved July 2, 2016.
- ↑ "U.S. Decennial Census". United States Census Bureau. Retrieved May 31, 2014.
- ↑ "Historical Census Browser". University of Virginia Library. Retrieved May 31, 2014.
- ↑ "Population of Counties by Decennial Census: 1900 to 1990". United States Census Bureau. Retrieved May 31, 2014.
- ↑ "Census 2000 PHC-T-4. Ranking Tables for Counties: 1990 and 2000" (PDF). United States Census Bureau. Retrieved May 31, 2014.
- ↑ "American FactFinder". United States Census Bureau. Retrieved 2011-05-14.
- ↑ http://www.census.gov/2010census/
| Wikimedia Commons has media related to Sutter County, California. |
External links
 |
Butte County | | ||
| Colusa County | |
Yuba County | ||
| ||||
| | ||||
| Sacramento County and Yolo County | Placer County |
Municipalities and communities of Sutter County, California, United States | ||
|---|---|---|
| Cities | | |
| CDPs | ||
| Unincorporated communities | ||
Coordinates: 39°02′N 121°41′W / 39.04°N 121.69°W