Butte County, California
| Butte County, California | |||
|---|---|---|---|
| County | |||
| County of Butte | |||
|
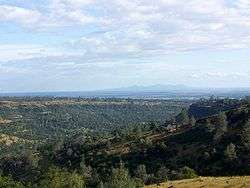
Butte County in 2005, with a view of the Sutter Buttes in the background | |||
| |||
| Nickname(s): "The Land of Natural Wealth and Beauty" | |||
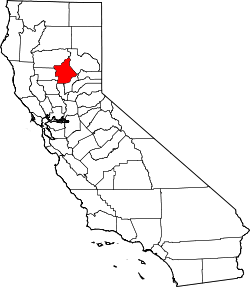 Location in the state of California | |||
 California's location in the United States | |||
| Country | United States of America | ||
| State | California | ||
| Region | Sacramento Valley | ||
| Incorporated | February 18, 1850[1] | ||
| County seat | Oroville | ||
| Largest city | Chico (population and area) | ||
| Area | |||
| • Total | 1,677 sq mi (4,340 km2) | ||
| • Land | 1,636 sq mi (4,240 km2) | ||
| • Water | 41 sq mi (110 km2) | ||
| Highest elevation[2] | 7,124 ft (2,171 m) | ||
| Population (April 1, 2010)[3] | |||
| • Total | 220,000 | ||
| • Estimate (2015)[3] | 225,411 | ||
| • Density | 130/sq mi (51/km2) | ||
| Time zone | Pacific Time Zone (UTC-8) | ||
| • Summer (DST) | Pacific Daylight Time (UTC-7) | ||
| Area code | 530 | ||
| FIPS code | 06-007 | ||
| GNIS feature ID | 1675842 | ||
| Website |
www | ||

Butte County is a county in the U.S. state of California. As of the 2010 census, the population was 220,000.[4] The county seat is Oroville.[5]
Butte County comprises the Chico, CA Metropolitan Statistical Area. It is in the California Central Valley, north of the state capital of Sacramento. Butte County is known as the "Land of Natural Wealth and Beauty."
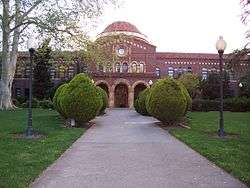
Butte County is watered by the Feather River and the Sacramento River. Butte Creek and Big Chico Creek are additional perennial streams, both tributary to the Sacramento. The county is the home of California State University, Chico and of Butte College.
There are four major hospitals and the State of California defines Butte County as being inside Health Service Area 1. A special district, the Butte County Air Quality Management District, regulates airborne pollutant emissions in the county. It does this following regional regulations, state, and federal laws. For example, in recent years, the agency changed rules that once allowed residents to burn household trash outdoors.
Geography
According to the U.S. Census Bureau, the county has a total area of 1,677 square miles (4,340 km2), of which 1,636 square miles (4,240 km2) is land and 41 square miles (110 km2) (2.4%) is water.[4]
The county is drained by the Feather River and Butte Creek. Part of the county's western border is formed by the Sacramento River. The county lies along the western slope of the Sierra Nevada, the steep slopes making it prime territory for the siting of hydroelectric power plants. About a half dozen of these plants are located in the county.
National protected areas
- Butte Sink National Wildlife Refuge (part)
- Lassen National Forest (part)
- Plumas National Forest (part)
- Sacramento River National Wildlife Refuge (part)
Adjacent counties
- Sutter County, California - south
- Colusa County, California - southwest
- Glenn County, California - west
- Tehama County, California - northwest
- Plumas County, California - northeast
- Yuba County, California - southeast
Demographics
2011
| Population, ethnicity, and income | |||||
|---|---|---|---|---|---|
| Total population[6] | 219,309 | ||||
| White[6] | 182,734 | 83.3% | |||
| Black or African American[6] | 3,353 | 1.5% | |||
| American Indian or Alaska Native[6] | 2,513 | 1.1% | |||
| Asian[6] | 9,240 | 4.2% | |||
| Native Hawaiian or other Pacific Islander[6] | 479 | 0.2% | |||
| Some other race[6] | 8,661 | 3.9% | |||
| Two or more races[6] | 12,329 | 5.6% | |||
| Hispanic or Latino (of any race)[7] | 30,476 | 13.9% | |||
| Per capita income[8] | $23,431 | ||||
| Median household income[9] | $42,971 | ||||
| Median family income[10] | $54,175 | ||||
Places by population, race, and income
| Places by population and race | ||||||||
|---|---|---|---|---|---|---|---|---|
| Place | Type[11] | Population[6] | White[6] | Other[6] [note 1] |
Asian[6] | Black or African American[6] |
Native American[6] [note 2] |
Hispanic or Latino (of any race)[7] |
| Bangor | CDP | 416 | 88.5% | 5.0% | 2.2% | 0.0% | 4.3% | 0.0% |
| Berry Creek | CDP | 1,305 | 85.9% | 11.7% | 0.2% | 0.0% | 2.1% | 4.1% |
| Biggs | City | 1,927 | 74.2% | 19.8% | 3.3% | 0.6% | 2.1% | 35.6% |
| Butte Creek Canyon | CDP | 924 | 96.6% | 2.4% | 0.6% | 0.0% | 0.3% | 3.6% |
| Butte Meadows | CDP | 21 | 100.0% | 0.0% | 0.0% | 0.0% | 0.0% | 0.0% |
| Butte Valley | CDP | 954 | 100.0% | 0.0% | 0.0% | 0.0% | 0.0% | 10.5% |
| Cherokee | CDP | 105 | 86.7% | 0.0% | 13.3% | 0.0% | 0.0% | 0.0% |
| Chico | City | 85,605 | 82.0% | 10.2% | 4.6% | 1.9% | 1.2% | 14.8% |
| Clipper Mills | CDP | 91 | 100.0% | 0.0% | 0.0% | 0.0% | 0.0% | 0.0% |
| Cohasset | CDP | 955 | 98.4% | 1.0% | 0.0% | 0.5% | 0.0% | 3.0% |
| Concow | CDP | 581 | 78.0% | 12.4% | 2.4% | 3.8% | 3.4% | 1.0% |
| Durham | CDP | 5,829 | 91.8% | 2.6% | 3.8% | 0.2% | 1.5% | 11.6% |
| Forbestown | CDP | 291 | 72.9% | 24.7% | 0.0% | 0.0% | 2.4% | 10.0% |
| Forest Ranch | CDP | 1,294 | 93.9% | 6.1% | 0.0% | 0.0% | 0.0% | 0.5% |
| Gridley | City | 6,509 | 79.8% | 18.8% | 0.0% | 1.0% | 0.4% | 50.5% |
| Honcut | CDP | 745 | 54.6% | 43.9% | 0.0% | 1.5% | 0.0% | 52.5% |
| Kelly Ridge | CDP | 2,246 | 99.2% | 0.0% | 0.0% | 0.8% | 0.0% | 0.0% |
| Magalia | CDP | 11,188 | 90.5% | 5.7% | 1.8% | 0.2% | 1.8% | 9.2% |
| Nord | CDP | 196 | 100.0% | 0.0% | 0.0% | 0.0% | 0.0% | 20.4% |
| Oroville | City | 15,445 | 71.0% | 12.8% | 11.4% | 3.3% | 1.4% | 11.3% |
| Oroville East | CDP | 9,663 | 82.1% | 9.7% | 2.4% | 1.2% | 4.6% | 7.9% |
| Palermo | CDP | 4,775 | 77.0% | 19.7% | 0.8% | 1.0% | 1.4% | 23.2% |
| Paradise | Town | 26,348 | 91.0% | 6.0% | 1.4% | 0.8% | 0.7% | 7.7% |
| Rackerby | CDP | 254 | 100.0% | 0.0% | 0.0% | 0.0% | 0.0% | 3.5% |
| Richvale | CDP | 155 | 83.9% | 16.1% | 0.0% | 0.0% | 0.0% | 16.1% |
| Robinson Mill | CDP | 136 | 84.6% | 15.4% | 0.0% | 0.0% | 0.0% | 15.4% |
| South Oroville | CDP | 5,982 | 63.9% | 7.8% | 17.3% | 8.3% | 2.7% | 15.2% |
| Stirling City | CDP | 271 | 100.0% | 0.0% | 0.0% | 0.0% | 0.0% | 0.0% |
| Thermalito | CDP | 6,295 | 80.2% | 5.9% | 10.8% | 1.3% | 1.7% | 12.7% |
| Yankee Hill | CDP | 240 | 88.8% | 11.2% | 0.0% | 0.0% | 0.0% | 2.5% |
| Places by population and income | |||||
|---|---|---|---|---|---|
| Place | Type[11] | Population[12] | Per capita income[8] | Median household income[9] | Median family income[10] |
| Bangor | CDP | 416 | $18,172 | $45,625 | $47,917 |
| Berry Creek | CDP | 1,305 | $22,277 | $36,164 | $51,607 |
| Biggs | City | 1,927 | $17,159 | $44,485 | $50,714 |
| Butte Creek Canyon | CDP | 924 | $37,677 | $58,750 | $76,786 |
| Butte Meadows | CDP | 21 | [13] | [13] | [13] |
| Butte Valley | CDP | 954 | $28,426 | $69,659 | $77,500 |
| Cherokee | CDP | 105 | $20,351 | $80,714 | $80,714 |
| Chico | City | 85,605 | $23,611 | $41,632 | $56,268 |
| Clipper Mills | CDP | 91 | [13] | [13] | [13] |
| Cohasset | CDP | 955 | $21,628 | $55,175 | $55,425 |
| Concow | CDP | 581 | $26,821 | $24,792 | $53,750 |
| Durham | CDP | 5,829 | $34,886 | $64,720 | $75,357 |
| Forbestown | CDP | 291 | $19,434 | $58,167 | $82,750 |
| Forest Ranch | CDP | 1,294 | $51,819 | $46,901 | $47,057 |
| Gridley | City | 6,509 | $15,525 | $36,563 | $41,474 |
| Honcut | CDP | 745 | $8,071 | $48,144 | $48,277 |
| Kelly Ridge | CDP | 2,246 | $33,366 | $49,444 | $60,205 |
| Magalia | CDP | 11,188 | $19,400 | $37,182 | $42,277 |
| Nord | CDP | 196 | $19,182 | $69,063 | $69,063 |
| Oroville | City | 15,445 | $18,750 | $35,678 | $45,430 |
| Oroville East | CDP | 9,663 | $24,503 | $53,167 | $65,142 |
| Palermo | CDP | 4,775 | $19,783 | $42,292 | $46,458 |
| Paradise | Town | 26,348 | $25,132 | $42,363 | $54,267 |
| Rackerby | CDP | 254 | $17,387 | $46,141 | $46,184 |
| Richvale | CDP | 155 | $45,061 | $87,150 | $87,150 |
| Robinson Mill | CDP | 136 | $21,793 | $54,762 | $54,762 |
| South Oroville | CDP | 5,982 | $11,666 | $32,205 | $38,750 |
| Stirling City | CDP | 271 | $14,811 | $82,969 | [13] |
| Thermalito | CDP | 6,295 | $16,301 | $37,738 | $38,053 |
| Yankee Hill | CDP | 240 | $21,149 | $22,054 | $44,286 |
2010
| Historical population | |||
|---|---|---|---|
| Census | Pop. | %± | |
| 1850 | 3,574 | — | |
| 1860 | 12,106 | 238.7% | |
| 1870 | 11,403 | −5.8% | |
| 1880 | 18,721 | 64.2% | |
| 1890 | 17,939 | −4.2% | |
| 1900 | 17,117 | −4.6% | |
| 1910 | 27,301 | 59.5% | |
| 1920 | 30,030 | 10.0% | |
| 1930 | 34,093 | 13.5% | |
| 1940 | 42,840 | 25.7% | |
| 1950 | 64,930 | 51.6% | |
| 1960 | 82,030 | 26.3% | |
| 1970 | 101,969 | 24.3% | |
| 1980 | 143,851 | 41.1% | |
| 1990 | 182,120 | 26.6% | |
| 2000 | 203,171 | 11.6% | |
| 2010 | 220,000 | 8.3% | |
| Est. 2015 | 225,411 | [14] | 2.5% |
| U.S. Decennial Census[15] 1790–1960[16] 1900–1990[17] 1990–2000[18] 2010–2015[4] | |||
The 2010 United States Census reported that Butte County had a population of 220,000. The racial makeup of Butte County was 180,096 (81.9%) White, 3,415 (1.6%) African American, 4,395 (2.0%) Native American, 9,057 (4.1%) Asian, 452 (0.2%) Pacific Islander, 12,141 (5.5%) from other races, and 10,444 (4.7%) from two or more races. Hispanic or Latino of any race were 31,116 persons (14.1%).[19]
| Population reported at 2010 United States Census | |||||||||
|---|---|---|---|---|---|---|---|---|---|
Population | American | American | | Islander | races | more races | or Latino (of any race) | ||
| Butte County | 220,000 | 180,096 | 3,415 | 4,395 | 9,057 | 452 | 12,141 | 10,444 | 31,116 |
cities and towns | Population | American | American | | Islander | races | more races | or Latino (of any race) | |
| Biggs | 1,707 | 1,302 | 11 | 54 | 9 | 1 | 252 | 78 | 580 |
| Chico | 86,187 | 69,606 | 1,771 | 1,167 | 3,656 | 210 | 5,437 | 4,340 | 13,315 |
| Gridley | 6,584 | 4,283 | 55 | 98 | 249 | 3 | 1,552 | 344 | 3,000 |
| Oroville | 15,546 | 11,686 | 453 | 573 | 1,238 | 56 | 554 | 986 | 1,945 |
| Paradise | 26,218 | 24,129 | 112 | 301 | 330 | 24 | 416 | 906 | 1,836 |
places | Population | American | American | | Islander | races | more races | or Latino (of any race) | |
| Bangor | 646 | 543 | 5 | 17 | 4 | 1 | 18 | 58 | 47 |
| Berry Creek | 1,424 | 1,249 | 8 | 48 | 13 | 3 | 13 | 90 | 98 |
| Butte Creek Canyon | 1,086 | 1,011 | 0 | 20 | 18 | 1 | 8 | 28 | 48 |
| Butte Meadows | 40 | 38 | 0 | 0 | 0 | 0 | 0 | 2 | 0 |
| Butte Valley | 899 | 782 | 0 | 19 | 9 | 1 | 42 | 46 | 89 |
| Cherokee | 69 | 48 | 0 | 2 | 8 | 0 | 0 | 11 | 1 |
| Clipper Mills | 142 | 131 | 0 | 3 | 0 | 0 | 2 | 6 | 5 |
| Cohasset | 847 | 764 | 8 | 14 | 2 | 1 | 20 | 38 | 43 |
| Concow | 710 | 611 | 0 | 24 | 5 | 3 | 10 | 57 | 56 |
| Durham | 5,518 | 5,088 | 19 | 55 | 35 | 9 | 165 | 147 | 614 |
| Forbestown | 320 | 262 | 4 | 15 | 10 | 0 | 4 | 25 | 23 |
| Forest Ranch | 1,184 | 1,116 | 8 | 6 | 4 | 1 | 20 | 29 | 52 |
| Honcut | 370 | 248 | 6 | 14 | 4 | 0 | 85 | 13 | 145 |
| Kelly Ridge | 2,544 | 2,287 | 20 | 56 | 35 | 7 | 43 | 96 | 204 |
| Magalia | 11,310 | 10,398 | 40 | 141 | 90 | 17 | 134 | 490 | 765 |
| Nord | 320 | 233 | 1 | 6 | 16 | 0 | 48 | 16 | 122 |
| Oroville East | 8,280 | 6,830 | 126 | 477 | 294 | 8 | 147 | 398 | 702 |
| Palermo | 5,382 | 3,901 | 39 | 221 | 246 | 4 | 642 | 329 | 1,281 |
| Rackerby | 204 | 193 | 0 | 1 | 0 | 0 | 3 | 7 | 18 |
| Richvale | 244 | 216 | 0 | 11 | 0 | 0 | 10 | 7 | 27 |
| Robinson Mill | 80 | 74 | 0 | 1 | 0 | 1 | 0 | 4 | 11 |
| South Oroville | 5,742 | 3,407 | 406 | 245 | 885 | 9 | 361 | 429 | 851 |
| Stirling City | 295 | 264 | 1 | 11 | 0 | 0 | 1 | 18 | 17 |
| Thermalito | 6,646 | 4,594 | 61 | 257 | 1,102 | 37 | 270 | 325 | 713 |
| Yankee Hill | 333 | 305 | 2 | 7 | 4 | 0 | 5 | 10 | 22 |
communities | Population | American | American | | Islander | races | more races | or Latino (of any race) | |
| All others not CDPs (combined) | 29,123 | 24,497 | 259 | 531 | 791 | 55 | 1,879 | 1,111 | 4,486 |
2000
As of the census[20] of 2000, there were 203,171 people, 79,566 households, and 49,410 families residing in the county. The population density was 124 people per square mile (48/km²). There were 85,523 housing units at an average density of 52 per square mile (20/km²). The racial makeup of the county was 84.5% White, 1.4% Black or African American, 1.9% Native American, 3.3% Asian, 0.2% Pacific Islander, 4.8% from other races, and 3.9% from two or more races. 10.5% of the population were Hispanic or Latino of any race. 14.2% were of German, 11.1% English, 10.2% Irish, 7.8% American and 5.6% Italian ancestry according to Census 2000. 87.9% spoke English, 7.8% Spanish and 1.4% Hmong as their first language.
There were 79,566 households out of which 28.4% had children under the age of 18 living with them, 46.7% were married couples living together, 11.2% had a female householder with no husband present, and 37.9% were non-families. 27.2% of all households were made up of individuals and 11.1% had someone living alone who was 65 years of age or older. The average household size was 2.48 and the average family size was 3.02.
In the county the population was spread out with 24.0% under the age of 18, 13.6% from 18 to 24, 24.8% from 25 to 44, 21.8% from 45 to 64, and 15.8% who were 65 years of age or older. The median age was 36 years. For every 100 females there were 96.1 males. For every 100 females age 18 and over, there were 92.6 males.
The median income for a household in the county was $31,924, and the median income for a family was $41,010. Males had a median income of $34,137 versus $25,393 for females. The per capita income for the county was $17,517. About 12.2% of families and 19.8% of the population were below the poverty line, including 23.8% of those under age 18 and 7.3% of those age 65 or over.
Crime
The following table includes the number of incidents reported and the rate per 1,000 persons for each type of offense.
| Population and crime rates | ||
|---|---|---|
| Population[6] | 219,309 | |
| Violent crime[21] | 932 | 4.25 |
| Homicide[21] | 10 | 0.05 |
| Forcible rape[21] | 87 | 0.40 |
| Robbery[21] | 187 | 0.85 |
| Aggravated assault[21] | 648 | 2.95 |
| Property crime[21] | 3,579 | 16.32 |
| Burglary[21] | 1,733 | 7.90 |
| Larceny-theft[21][note 3] | 3,765 | 17.17 |
| Motor vehicle theft[21] | 840 | 3.83 |
| Arson[21] | 81 | 0.37 |
Cities by population and crime rates
| Cities by population and crime rates | ||||||||
|---|---|---|---|---|---|---|---|---|
| City | Population[22] | Violent crimes[22] | Violent crime rate per 1,000 persons |
Property crimes[22] | Property crime rate per 1,000 persons | |||
| Biggs | 1,724 | 19 | 11.02 | 34 | 19.72 | |||
| Chico | 87,090 | 282 | 3.24 | 2,291 | 26.31 | |||
| Gridley | 6,654 | 78 | 11.72 | 220 | 33.06 | |||
| Oroville | 15,707 | 107 | 6.81 | 991 | 63.09 | |||
| Paradise | 26,492 | 66 | 2.49 | 479 | 18.08 | |||
Government
Voter registration statistics
| Population and registered voters | ||
|---|---|---|
| Total population[6] | 219,309 | |
| Registered voters[23][note 4] | 121,388 | 55.4% |
| Democratic[23] | 41,767 | 34.4% |
| Republican[23] | 45,001 | 37.1% |
| Democratic–Republican spread[23] | -3,234 | -2.7% |
| Independent[23] | 4,137 | 3.4% |
| Green[23] | 1,429 | 1.2% |
| Libertarian[23] | 1,088 | 0.9% |
| Peace and Freedom[23] | 437 | 0.4% |
| Americans Elect[23] | 4 | 0.0% |
| Other[23] | 1,401 | 1.2% |
| No party preference[23] | 26,124 | 21.5% |
Cities by population and voter registration
| Cities by population and voter registration | |||||||
|---|---|---|---|---|---|---|---|
| City | Population[6] | Registered voters[23] [note 4] |
Democratic[23] | Republican[23] | D–R spread[23] | Other[23] | No party preference[23] |
| Biggs | 1,927 | 38.7% | 36.7% | 37.9% | -1.2% | 8.8% | 19.8% |
| Chico | 85,605 | 55.0% | 40.1% | 30.3% | +9.8% | 9.8% | 22.7% |
| Gridley | 6,509 | 40.6% | 37.6% | 34.8% | +2.8% | 9.7% | 21.3% |
| Oroville | 15,445 | 40.8% | 32.1% | 36.2% | -4.1% | 11.7% | 24.2% |
| Paradise | 26,348 | 62.1% | 31.1% | 40.8% | -9.7% | 11.5% | 20.5% |
| Year | GOP | DEM | Others |
|---|---|---|---|
| 2016 | 46.7% 45,144 | 43.0% 41,567 | 10.4% 10,047 |
| 2012 | 48.9% 44,479 | 46.9% 42,669 | 4.3% 3,873 |
| 2008 | 47.3% 46,706 | 49.7% 49,013 | 3.0% 2,988 |
| 2004 | 53.7% 51,662 | 44.1% 42,448 | 2.1% 2,047 |
| 2000 | 54.5% 45,584 | 37.4% 31,338 | 8.1% 6,799 |
| 1996 | 49.0% 38,961 | 38.5% 30,651 | 12.5% 9,938 |
| 1992 | 37.2% 31,608 | 38.2% 32,489 | 24.6% 20,917 |
| 1988 | 56.0% 40,143 | 42.5% 30,406 | 1.5% 1,082 |
| 1984 | 63.1% 45,381 | 35.3% 25,421 | 1.6% 1,162 |
| 1980 | 57.1% 38,188 | 29.6% 19,520 | 12.6% 8,304 |
| 1976 | 51.8% 28,400 | 44.1% 24,203 | 4.1% 2,251 |
| 1972 | 57.6% 28,819 | 36.8% 18,401 | 5.6% 2,808 |
| 1968 | 56.7% 22,225 | 32.9% 12,887 | 10.5% 4,099 |
| 1964 | 48.4% 19,574 | 51.5% 20,831 | 0.0% 14 |
| 1960 | 57.6% 20,838 | 41.9% 15,163 | 0.5% 174 |
| 1956 | 58.4% 18,382 | 41.1% 12,933 | 0.5% 147 |
| 1952 | 63.3% 19,248 | 35.9% 10,913 | 0.9% 263 |
| 1948 | 49.4% 10,948 | 45.7% 10,133 | 5.0% 1,100 |
| 1944 | 46.8% 7,852 | 52.6% 8,811 | 0.6% 105 |
| 1940 | 40.5% 7,433 | 58.2% 10,684 | 1.4% 255 |
| 1936 | 32.0% 5,103 | 65.9% 10,490 | 2.1% 335 |
| 1932 | 29.1% 4,322 | 65.0% 9,645 | 5.8% 865 |
| 1928 | 60.5% 6,306 | 37.8% 3,946 | 1.7% 180 |
| 1924 | 42.3% 4,382 | 12.5% 1,299 | 45.2% 4,691 |
| 1920 | 65.7% 5,409 | 27.5% 2,262 | 6.8% 563 |
Local
The citizens of the county of Butte are represented by the five member Butte County Board of Supervisors.
Tribal
The Berry Creek Rancheria of Tyme Maidu Indians of California is headquartered in Oroville. The Berry Creek Rancheria operates Gold Country Casino.
The Mooretown Rancheria of Maidu Indians of California is also headquartered in Oroville. The Mooretown Rancheria operates Feather Falls Casino.
The governmental headquarters of the Mechoopda Indian Tribe of Chico Rancheria is located in Chico.
State
Butte County is split between the 1st and 3rd Assembly districts, represented by Republican Brian Dahle and Republican James Gallagher, respectively.[25] The county is in the the 4th Senate District, represented by Republican Jim Nielsen.[26]
On November 4, 2008 Butte County voted 56.7% for Proposition 8 which amended the California Constitution to ban same-sex marriages.
Federal
Butte County is in California's 1st congressional district, represented by Republican Doug LaMalfa.[27]
Butte is a Republican-leaning county in Presidential and congressional elections. Lyndon Johnson in 1964 is the last Democrat to win a majority in the county (It was also his weakest county victory in the state that year); however, Bill Clinton and Barack Obama won the county by plurality in 1992 and 2008, respectively.
Education
Public schools
There are roughly 90 public schools in the county according to the National Center for Educational Statistics. The schools are operated by the County Office of Education and 15 school districts, which are:
- Bangor Union Elementary School District
- Biggs Unified School District
- Chico Unified School District
- Durham Unified School District
- Feather Falls Union Elementary School District
- Golden Feather Union Elementary School District
- Gridley Unified School District
- Manzanita Elementary School District
- Oroville City Elementary School District
- Oroville Union High School District
- Palermo Union School District
- Paradise Unified School District
- Pioneer Union Elementary School District
- Thermalito Union School District
Colleges and universities
Public libraries
Butte County Library provides library services to residents of the County through six branches in Biggs, Chico, Durham, Gridley, Oroville and Paradise. The mission of the Butte County Library is to provide all individuals, regardless of age, ethnic background, educational or economic level, with free access to ideas, information, and technology.
For many years, the library served rural and mountain communities through regularly scheduled bookmobile visits; however, due to budget cuts, this service was discontinued in 2009 and the bookmobile was sold. The library serves low-literacy adults through several programs of the Butte County Library Literacy Services division, including the Adult Reading Program, Families for Literacy and the Literacy Coach, a 36-foot (11 m) vehicle that provides mobile programming like story times, parent meetings, workshops, and computer and teacher trainings.
The library operates as a department of the County of Butte, governed by the Butte County Board of Supervisors.
Transportation

Major highways
Public transportation
Butte Regional Transit or the B-Line, provides service in and between Chico, Oroville, Paradise, Gridley and Biggs. Chico is also a connection point for Glenn Ride buses to Glenn County and Plumas Transit Systems buses to Plumas County.
Greyhound buses stop in Chico.
Airports
General Aviation airports in Butte County include:
- Chico Municipal Airport
- Oroville Municipal Airport
- Paradise Airport
- Ranchaero Airport
- Richvale Airport
Communities
Cities
Census-designated places
Ghost towns
- Hamilton – Was Butte County's first permanent county seat. John Bidwell discovered gold at Hamilton in 1848, and the settlement arose. It was located on the west side of the Feather River, 15 miles (24 km) downstream from Oroville.
- Bidwell's Bar – now located under Lake Oroville
- Forks of Butte
Population ranking
The population ranking of the following table is based on the 2010 census of Butte County.[28]
† county seat
| Rank | City/Town/etc. | Municipal type | Population (2010 Census)
|
|---|---|---|---|
| 1 | Chico | City | 86,187 |
| 2 | Paradise | Town | 26,218 |
| 3 | † Oroville | City | 15,546 |
| 4 | Magalia | CDP | 11,310 |
| 5 | Oroville East | CDP | 8,280 |
| 6 | Thermalito | CDP | 6,646 |
| 7 | Gridley | City | 6,584 |
| 8 | South Oroville | CDP | 5,742 |
| 9 | Durham | CDP | 5,518 |
| 10 | Palermo | CDP | 5,382 |
| 11 | Kelly Ridge | CDP | 2,544 |
| 12 | Biggs | City | 1,707 |
| 13 | Berry Creek | CDP | 1,424 |
| 14 | Forest Ranch | CDP | 1,184 |
| 15 | Butte Creek Canyon | CDP | 1,086 |
| 16 | Butte Valley | CDP | 899 |
| 17 | Cohasset | CDP | 847 |
| 18 | Concow | CDP | 710 |
| 19 | Bangor | CDP | 646 |
| 20 | Honcut | CDP | 370 |
| 21 | Yankee Hill | CDP | 333 |
| t-22 | Forbestown | CDP | 320 |
| t-22 | Nord | CDP | 320 |
| 23 | Stirling City | CDP | 295 |
| 24 | Richvale | CDP | 244 |
| 25 | Rackerby | CDP | 204 |
| 26 | Berry Creek Rancheria | AIAN | 152 |
| 27 | Clipper Mills | CDP | 142 |
| 28 | Robinson Mill | CDP | 80 |
| 29 | Cherokee | CDP | 69 |
| 30 | Butte Meadows | CDP | 40 |
| 31 | Enterprise Rancheria[29] | AIAN | 1 |
In popular culture
Several movies have been filmed in Butte County, including Gone with the Wind, The Outlaw Josey Wales, Friendly Persuasion, Magic Town, The Klansman, Ruby Ridge: An American Tragedy, The Adventures of Robin Hood and Under Wraps. The most recent season of the television series Sons of Anarchy features an episode in which the Sons come into contact with corrupt police in the town of Eden, located in Butte County.
See also
- List of California counties
- List of school districts in Butte County, California
- List of museums in the Shasta Cascade (California)
- National Register of Historic Places listings in Butte County, California
Sources
- US Department of Education, National Center for Educational Statistics.
- State of California, Office of Statewide Health Planning and Development.
Notes
- ↑ Other = Some other race + Two or more races
- ↑ Native American = Native Hawaiian or other Pacific Islander + American Indian or Alaska Native
- ↑ Only larceny-theft cases involving property over $400 in value are reported as property crimes.
- 1 2 Percentage of registered voters with respect to total population. Percentages of party members with respect to registered voters follow.
References
- ↑ Statistical Report of the California State Board of Agriculture for the Year 1918. Sacramento, CA: California State Printing Office. 1919. p. 316. Retrieved May 14, 2012.
- ↑ "Butte County High Point". Peakbagger.com. Retrieved February 11, 2015.
- 1 2 "American Fact Finder - Results". United States Census Bureau. Retrieved April 3, 2016.
- 1 2 3 "State & County QuickFacts". United States Census Bureau. Retrieved April 3, 2016.
- ↑ "Find a County". National Association of Counties. Archived from the original on May 31, 2011. Retrieved June 7, 2011.
- 1 2 3 4 5 6 7 8 9 10 11 12 13 14 15 16 17 U.S. Census Bureau. American Community Survey, 2011 American Community Survey 5-Year Estimates, Table B02001. American FactFinder Archived September 11, 2013, at the Wayback Machine.. Retrieved October 26, 2013.
- 1 2 U.S. Census Bureau. American Community Survey, 2011 American Community Survey 5-Year Estimates, Table B03003. American FactFinder Archived September 11, 2013, at the Wayback Machine.. Retrieved October 26, 2013.
- 1 2 U.S. Census Bureau. American Community Survey, 2011 American Community Survey 5-Year Estimates, Table B19301. American FactFinder Archived September 11, 2013, at the Wayback Machine.. Retrieved October 21, 2013.
- 1 2 U.S. Census Bureau. American Community Survey, 2011 American Community Survey 5-Year Estimates, Table B19013. American FactFinder Archived September 11, 2013, at the Wayback Machine.. Retrieved October 21, 2013.
- 1 2 U.S. Census Bureau. American Community Survey, 2011 American Community Survey 5-Year Estimates, Table B19113. American FactFinder Archived September 11, 2013, at the Wayback Machine.. Retrieved October 21, 2013.
- 1 2 U.S. Census Bureau. American Community Survey, 2011 American Community Survey 5-Year Estimates. American FactFinder Archived September 11, 2013, at the Wayback Machine.. Retrieved October 21, 2013.
- ↑ U.S. Census Bureau. American Community Survey, 2011 American Community Survey 5-Year Estimates, Table B01003. American FactFinder Archived September 11, 2013, at the Wayback Machine.. Retrieved October 21, 2013.
- 1 2 3 4 5 6 7 Data unavailable
- ↑ "County Totals Dataset: Population, Population Change and Estimated Components of Population Change: April 1, 2010 to July 1, 2015". Retrieved July 2, 2016.
- ↑ "U.S. Decennial Census". United States Census Bureau. Archived from the original on May 11, 2015. Retrieved September 24, 2015.
- ↑ "Historical Census Browser". University of Virginia Library. Retrieved September 24, 2015.
- ↑ Forstall, Richard L., ed. (March 27, 1995). "Population of Counties by Decennial Census: 1900 to 1990". United States Census Bureau. Retrieved September 24, 2015.
- ↑ "Census 2000 PHC-T-4. Ranking Tables for Counties: 1990 and 2000" (PDF). United States Census Bureau. April 2, 2001. Retrieved September 24, 2015.
- ↑ "2010 Census P.L. 94-171 Summary File Data". United States Census Bureau.
- ↑ "American FactFinder". United States Census Bureau. Archived from the original on September 11, 2013. Retrieved May 14, 2011.
- 1 2 3 4 5 6 7 8 9 10 Office of the Attorney General, Department of Justice, State of California. Table 11: Crimes – 2009 Archived December 2, 2013, at the Wayback Machine.. Retrieved November 14, 2013.
- 1 2 3 United States Department of Justice, Federal Bureau of Investigation. Crime in the United States, 2012, Table 8 (California). Retrieved November 14, 2013.
- 1 2 3 4 5 6 7 8 9 10 11 12 13 14 15 16 17 California Secretary of State. February 10, 2013 - Report of Registration Archived November 3, 2013, at the Wayback Machine.. Retrieved October 31, 2013.
- ↑ http://uselectionatlas.org/RESULTS/
- ↑ "Members Assembly". State of California. Retrieved March 19, 2013.
- ↑ "Senators". State of California. Retrieved March 19, 2013.
- ↑ "California's 1st Congressional District - Representatives & District Map". Civic Impulse, LLC. Retrieved February 28, 2013.
- ↑ "Archived copy". Archived from the original on December 21, 2013. Retrieved 2015-05-25.
- ↑ http://www.census.gov/2010census/popmap/ipmtext.php?fl=1055
External links
| Wikimedia Commons has media related to Butte County, California. |
- Official website
- 101 Things To Do In Butte County Magazine
- Butte County Search and Rescue
- CSU Chico (Chico State)
- Butte County Association of Governments
- Butte County Library
- Diseño of a portion of Butte County, Calif. : showing ranchos at The Bankcroft Library
- Listen to public safety radio traffic in Butte County
 |
Tehama County | | ||
| Glenn County | |
Plumas County | ||
| ||||
| | ||||
| Colusa County | Yuba County and Sutter County |
Coordinates: 39°40′N 121°36′W / 39.66°N 121.60°W