United States presidential election in California, 1964
| | ||||||||||||||||||||||||||||||||
| ||||||||||||||||||||||||||||||||
| ||||||||||||||||||||||||||||||||
|
| ||||||||||||||||||||||||||||||||
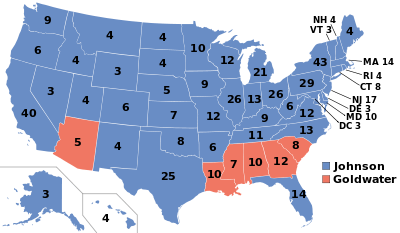
| County Results
Johnson—70-80%
Johnson—60-70%
Johnson—50-60%
Goldwater—50-60% | ||||||||||||||||||||||||||||||||
| ||||||||||||||||||||||||||||||||

| Elections in California | ||||||||||
|---|---|---|---|---|---|---|---|---|---|---|
 | ||||||||||
|
||||||||||
|
||||||||||
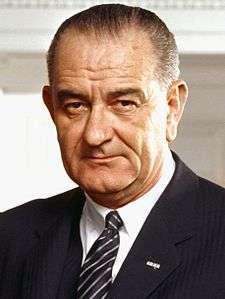
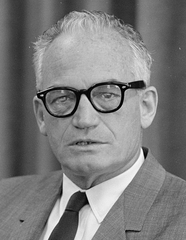
In the 1964 United States presidential election, the state of California voted for the incumbent Democratic President, Lyndon B. Johnson, in a landslide over the Republican nominee, Senator Barry Goldwater of Arizona.
As Johnson won nationally in a massive landslide, taking 61.05% of the vote nationwide, and dominating many Northeastern and Midwestern states by record landslide margins, California actually weighed in as about 4% more Republican than the national average in the 1964 election. Johnson dominated in more liberal Northern California, breaking 60% in many counties and even breaking 70% in Plumas County and the city of San Francisco. However the Western Conservative Goldwater, from neighboring Arizona, did hold some appeal in Southern California, where Johnson failed to break 60% in a single county and Goldwater even won two heavily populated Southern California counties, Orange County, and San Diego County, holding Johnson below the 60% mark statewide.
Although California has become a strongly Democrat state in recent elections, this was the only presidential election between 1952 and 1988 where the state was carried by a Democrat. Johnson is also the last Democrat to carry the counties of Calaveras, Colusa, Glenn, Inyo, Kern, Modoc and Tulare, and the last to win the majority of the vote in Butte, El Dorado, Kings, Mariposa, Siskiyou and Tuolumne counties (Although some Democrats since have won a plurality in those counties).
This was the last election in which California did not register the most votes cast by state.
Results
| Presidential candidate | Party | Home state | Popular vote | Electoral vote |
Running mate | |||
|---|---|---|---|---|---|---|---|---|
| Count | Pct | Vice-presidential candidate | Home state | Elect. vote | ||||
| Lyndon B. Johnson | Democratic | Texas | 4,171,877 | 59.11% | 40 | Hubert Humphrey | Minnesota | 40 |
| Barry Goldwater | Republican | Arizona | 2,879,108 | 40.79% | 0 | William E. Miller | New York | 0 |
| Write-in candidates | — | — | 5,410 | 0.08% | 0 | — | — | 0 |
| Eric Hass | Socialist Labor | New York | 489 | 0.01% | 0 | Henning A. Blomen | Massachusetts | 0 |
| Clifton DeBerry | Socialist Workers | New York | 378 | 0.01% | 0 | Ed Shaw | 0 | |
| E. Harold Munn | Prohibition Party | Michigan | 305 | 0.00% | 0 | Mark R. Shaw | Massachusetts | 0 |
| Kirby J. Hensley | Universal Party | California | 19 | 0.00% | 0 | Roscoe MacKenna | 0 | |
| Total | 7,057,586 | 100% | 40 | 40 | ||||
| Needed to win | 270 | 270 | ||||||
Results by county
| County | Johnson | Votes | Goldwater | Votes | Others | Votes |
|---|---|---|---|---|---|---|
| San Francisco | 71.24% | 230,758 | 28.71% | 92,994 | 0.05% | 156 |
| Plumas | 70.35% | 4,019 | 29.51% | 1,686 | 0.14% | 8 |
| Solano | 69.53% | 34,930 | 30.38% | 15,263 | 0.09% | 47 |
| Yolo | 69.52% | 18,266 | 30.36% | 7,976 | 0.12% | 32 |
| Kings | 69.39% | 13,073 | 30.54% | 5,753 | 0.07% | 14 |
| Merced | 68.74% | 19,431 | 31.18% | 8,814 | 0.08% | 24 |
| Madera | 67.75% | 9,391 | 32.18% | 4,461 | 0.07% | 10 |
| Shasta | 67.52% | 19,142 | 32.37% | 9,178 | 0.11% | 30 |
| Amador | 66.89% | 3,410 | 32.99% | 1,682 | 0.12% | 6 |
| Sierra | 66.72% | 828 | 33.28% | 413 | 0.00% | 0 |
| Alameda | 66.42% | 283,833 | 33.46% | 142,998 | 0.12% | 509 |
| Humboldt | 66.27% | 25,515 | 33.53% | 12,909 | 0.19% | 75 |
| Stanislaus | 66.14% | 43,078 | 33.74% | 21,973 | 0.12% | 77 |
| Placer | 65.96% | 18,256 | 33.92% | 9,389 | 0.11% | 31 |
| Sacramento | 65.68% | 149,668 | 34.17% | 77,871 | 0.15% | 332 |
| Lassen | 65.67% | 4,072 | 34.25% | 2,124 | 0.08% | 5 |
| Fresno | 65.57% | 89,375 | 34.33% | 46,792 | 0.10% | 141 |
| Mendocino | 65.12% | 11,869 | 34.68% | 6,322 | 0.20% | 36 |
| San Mateo | 64.32% | 140,978 | 35.55% | 77,916 | 0.14% | 297 |
| Del Norte | 63.77% | 3,652 | 36.23% | 2,075 | 0.00% | 0 |
| Siskiyou | 63.66% | 9,126 | 36.18% | 5,186 | 0.16% | 23 |
| Contra Costa | 63.44% | 113,071 | 36.47% | 65,011 | 0.09% | 163 |
| Trinity | 63.25% | 2,175 | 36.41% | 1,252 | 0.35% | 12 |
| Tuolumne | 63.16% | 4,939 | 36.59% | 2,861 | 0.26% | 20 |
| Santa Clara | 63.10% | 202,249 | 36.63% | 117,420 | 0.27% | 858 |
| Napa | 62.74% | 19,580 | 37.06% | 11,567 | 0.20% | 63 |
| Monterey | 61.83% | 40,093 | 37.90% | 24,579 | 0.27% | 172 |
| San Joaquin | 61.78% | 59,210 | 38.13% | 36,546 | 0.09% | 83 |
| Marin | 61.65% | 46,462 | 38.06% | 28,682 | 0.29% | 220 |
| Sonoma | 61.49% | 44,354 | 38.37% | 27,677 | 0.15% | 105 |
| San Benito | 60.59% | 3,779 | 39.19% | 2,444 | 0.22% | 14 |
| Colusa | 60.57% | 2,790 | 39.32% | 1,811 | 0.11% | 5 |
| Tehama | 60.42% | 6,928 | 39.50% | 4,529 | 0.09% | 10 |
| El Dorado | 60.30% | 8,810 | 39.53% | 5,775 | 0.17% | 25 |
| Tulare | 60.08% | 33,974 | 39.83% | 22,527 | 0.09% | 51 |
| San Luis Obispo | 59.84% | 22,252 | 40.08% | 14,906 | 0.08% | 28 |
| Ventura | 58.84% | 57,805 | 40.99% | 40,264 | 0.17% | 169 |
| Modoc | 58.73% | 1,972 | 41.27% | 1,386 | 0.00% | 0 |
| Kern | 58.71% | 64,174 | 41.18% | 45,014 | 0.11% | 120 |
| Santa Cruz | 58.53% | 26,714 | 41.27% | 18,836 | 0.21% | 94 |
| Calaveras | 58.27% | 3,145 | 41.58% | 2,244 | 0.15% | 8 |
| Yuba | 57.64% | 6,766 | 42.29% | 4,964 | 0.08% | 9 |
| Los Angeles | 57.43% | 1,568,300 | 42.52% | 1,161,067 | 0.06% | 1,551 |
| Mariposa | 57.41% | 1,704 | 42.59% | 1,264 | 0.00% | 0 |
| San Bernardino | 57.11% | 123,012 | 42.78% | 92,145 | 0.11% | 243 |
| Riverside | 56.79% | 80,528 | 43.14% | 61,165 | 0.07% | 95 |
| Nevada | 56.52% | 6,397 | 43.29% | 4,899 | 0.19% | 22 |
| Lake | 56.37% | 4,680 | 43.56% | 3,616 | 0.07% | 6 |
| Santa Barbara | 55.94% | 48,381 | 43.96% | 38,020 | 0.10% | 85 |
| Glenn | 54.01% | 3,937 | 45.97% | 3,351 | 0.03% | 2 |
| Inyo | 53.44% | 3,161 | 46.51% | 2,751 | 0.05% | 3 |
| Imperial | 51.85% | 11,143 | 48.06% | 10,330 | 0.09% | 19 |
| Butte | 51.54% | 20,831 | 48.43% | 19,574 | 0.03% | 14 |
| San Diego | 49.69% | 211,808 | 50.31% | 214,445 | 0.01% | 33 |
| Sutter | 48.33% | 6,787 | 51.56% | 7,241 | 0.11% | 16 |
| Orange | 44.01% | 176,539 | 55.89% | 224,196 | 0.11% | 430 |
| Mono | 43.93% | 666 | 56.07% | 850 | 0.00% | 0 |
| Alpine | 42.33% | 91 | 57.67% | 124 | 0.00% | 0 |
References
- ↑ "1964 Presidential General Election Results - California". Dave Leip's Atlas of U.S. Presidential Elections. Retrieved 2013-10-08.
| Candidates |
|  |
|---|---|---|
| General articles |
| |
| Local results |
| |
| Other 1964 elections | ||