United States presidential election in Georgia, 2008
| | ||||||||||||||||||||||||||||||||
| ||||||||||||||||||||||||||||||||
| ||||||||||||||||||||||||||||||||
|
| ||||||||||||||||||||||||||||||||
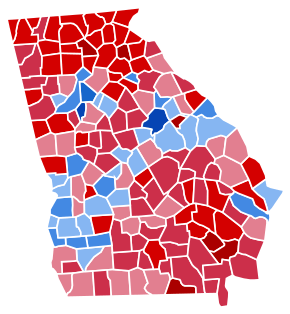
| County Results
Obama—80-90%
Obama—70-80%
Obama—60-70%
Obama—50-60%
McCain—50-60%
McCain—60-70%
McCain—70-80%
McCain—80-90% | ||||||||||||||||||||||||||||||||
| ||||||||||||||||||||||||||||||||

| Elections in Georgia | ||||||||||
|---|---|---|---|---|---|---|---|---|---|---|
 | ||||||||||
|
||||||||||
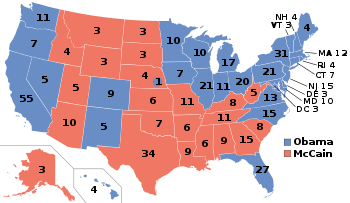
The 2008 United States presidential election in Georgia took place on November 4, 2008 throughout all 50 states and D.C., which was part of the 2008 United States presidential election. Voters chose 15 representatives, or electors to the Electoral College, who voted for President and Vice President.
Georgia was won by Republican nominee John McCain with a 5.2% margin of victory. Prior to the election, 15 of 17 news organizations considered this a state McCain would win, or otherwise considered as a red state. It is situated in the Deep South, entrenched in the Bible Belt, and is normally a much more reliable Republican stronghold. The Peach State has not voted for a Democratic presidential nominee since Bill Clinton won the state in 1992. Continuing on that trend, Republican John McCain was able to keep Georgia in the GOP column in 2008 despite the large African American turnout that kept the margin of victory within single digits. With its 15 electoral votes, Georgia was the second-largest prize for McCain in 2008 (only behind Texas).
Primaries
Campaign
An ambitious Barack Obama targeted Georgia as potential state he could flip from red to blue, albeit as a relatively long-shot target. Democrats hoped libertarian candidate Bob Barr - whose home state was Georgia - might take away votes for John McCain and play the role of a spoiler. In the early months, Obama bought ads and even appeared in person to campaign in the state.[1]
However, polling consistently showed McCain with a double-digit lead.[2] Over the summer, Obama's campaign stumbled, and the Illinois senator even fell behind McCain for a short while in September. In light of these difficulties, the Democratic campaign started shifting resources to North Carolina, which they regarded as more competitive.[3] Obama stopped advertising in the state and moved away staff, although he retained a large volunteer force. As the campaign neared the end, Obama jumped to a national lead, helped by the September financial crisis, but remained behind in Georgia polling.
Predictions
There were 17 news organizations who made state by state predictions of the election. Here are their last predictions before election day:
- D.C. Political Report: Republican[4]
- Cook Political Report: Toss Up[5]
- Takeaway: Leaning McCain[6]
- Election Projection: Leaning McCain[7]
- Electoral-vote.com: Leaning McCain[8]
- Washington Post: Leaning McCain[9]
- Politico: Solid McCain[10]
- Real Clear Politics: Toss Up[11]
- FiveThirtyEight.com: Leaning McCain[9]
- CQ Politics: Leaning Republican[12]
- New York Times: Leaning Republican[13]
- CNN: Leaning Republican[14]
- NPR: Leaning Republican[9]
- MSNBC: Leaning McCain[9]
- Fox News: Republican[15]
- Associated Press: Republican[16]
- Rasmussen Reports: Safe Republican[17]
Polling
McCain won almost every pre-election poll. The final 3 poll average gave the Republican the lead with 50% to 47%.[18]
Fundraising
McCain raised $4,835,902. Obama raised $8,568,716.[19]
Advertising and visits
Obama spent over $4,105,888. McCain and his interest groups spent just $49,507.[20] Both McCain and Obama visited Atlanta once.[21]
Analysis
In terms of the margin, McCain won a quite narrow victory, capturing 52.23% of the popular vote to Democrat Barack Obama's 47.02% popular vote. This margin was significantly lower than that in 2004 when George W. Bush carried this state by a 17% margin, winning 58% of the popular vote to John Kerry's 41%. Obama won huge victories in the two most populous counties, DeKalb County and Fulton County which contains the state capital and largest city of Atlanta, which contributed to his popular vote percentage. He also made significant inroads in Atlanta's normally heavily Republican suburbs. For instance, Obama lost Cobb County by nine points compared to Kerry's 35-point loss. Obama lost Gwinnett County by 11 points compared to a 33-point loss for Kerry. Aside from native son Jimmy Carter winning both counties in 1976 (a year in which he swept every county in the state), neither county has gone Democratic since 1960. However, McCain piled up the votes in the more rural northern and southeastern parts of the state (well over 70 percent in some cases) which gave him the edge and ultimate win. These two areas were among the first regions of Georgia to turn Republican; the old-line Southern Democrats in these areas began splitting their tickets as early as the 1950s, and some areas of north Georgia are among the few ancestrally Republican areas of the South.
The large African American turnout was widely attributed to the narrow margin by which McCain carried the state. However, Obama was unable to improve his percentage amongst white voters.[22] According to exit polls, 77% of white voters supported the Republican candidate - the same as in 2004. This effectively eliminated Obama's chances of winning the state.
Of the several independent and third-party candidates who ran for president in 2008, two of them were from Georgia (those being former Republican Representative Bob Barr (L) (who placed third overall in the popular vote in Georgia) and former Democratic Representative Cynthia McKinney (G)).
During the same election, incumbent Republican U.S. Senator Saxby Chambliss was held below 50% of the popular vote in a contentious U.S. Senate race against Democrat Jim Martin and Libertarian Allen Buckley. Abiding by Georgia law, this led to a runoff election in December between Chambliss and Martin. Chambliss brought in 2008 vice presidential nominee Governor Sarah Palin of Alaska to campaign for him and rally the base of the GOP. Former President Bill Clinton campaigned on behalf of Martin. Turnout was lower than in the general election and African Americans didn't turn out as largely as they did in November for Obama, all factors that led up to Chambliss's victory. The incumbent was reelected with 57.44% of the vote while Martin received 42.56%.
During the 2008 U.S. house elections, incumbent Democratic Representatives Jim Marshall (GA-8) and John Barrow (GA-12), each of whom was narrowly re-elected by one percentage point or less in 2006 despite the pro-Democratic political environment that year, were both re-elected by unexpectedly wide margins despite efforts by Republicans to win both of the districts.
At the state level, during the same election, Republicans picked up four seats in the Georgia House of Representatives.
Results
| United States presidential election in Georgia, 2008[23] | ||||||
|---|---|---|---|---|---|---|
| Party | Candidate | Running mate | Votes | Percentage | Electoral votes | |
| Republican | John McCain | Sarah Palin | 2,048,759 | 52.10% | 15 | |
| Democratic | Barack Obama | Joe Biden | 1,844,123 | 46.90% | 0 | |
| Libertarian | Bob Barr | Wayne Allyn Root | 28,731 | 0.73% | 0 | |
| Write-ins | Write-ins | 6,998 | 0.18% | 0 | ||
| Constitution | Chuck Baldwin (write-in) | Darrell Castle | 1,404 | 0.04% | 0 | |
| Independent | Ralph Nader (write-in) | Matt Gonzalez | 1,165 | 0.03% | 0 | |
| Independent | Ron Paul (write-in) | 695 | 0.02% | 0 | ||
| Green | Cynthia McKinney (write-in) | Rosa Clemente | 250 | 0.01% | 0 | |
| Socialist Workers | James Harris (write-in) | Alyson Kennedy | 24 | 0.00% | 0 | |
| Constitution | Michael Peroutka* (write-in) | n/a | 23 | 0.00% | 0 | |
| HeartQuake '08 | Jonathan Allen (write-in) | Jeffrey Stath | 9 | 0.00% | 0 | |
| Independent | Frank Moore (write-in) | Susan Block | 6 | 0.00% | 0 | |
| Write-in | David C. Byrne | n/a | 4 | 0.00% | 0 | |
| Write-in | Brian R. Brown | n/a | 2 | 0.00% | 0 | |
| Write-in | Bryan A. Schivera | n/a | 2 | 0.00% | 0 | |
| Totals | 3,932,193 | 100.00% | 15 | |||
| Voter turnout | 75.7% | |||||
(*Peroutka was not the Constitution Party's nominee in 2008)
Results breakdown
By county
| County | Obama% | Obama# | McCain% | McCain# | Others% | Others# |
|---|---|---|---|---|---|---|
| Appling | 26.4% | 1,846 | 72.6% | 5,085 | 1.0% | 71 |
| Atkinson | 32.3% | 938 | 66.8% | 1,941 | 1.0% | 28 |
| Bacon | 20.7% | 817 | 78.4% | 3,089 | 0.9% | 36 |
| Baker | 50.1% | 846 | 49.0% | 828 | 0.9% | 15 |
| Baldwin | 51.8% | 8,587 | 47.2% | 7,823 | 0.9% | 154 |
| Banks | 16.4% | 1,027 | 81.9% | 5,120 | 1.6% | 102 |
| Barrow | 27.0% | 6,657 | 71.6% | 17,625 | 1.4% | 351 |
| Bartow | 26.7% | 9,962 | 71.8% | 25,976 | 1.5% | 537 |
| Ben Hill | 42.8% | 2,590 | 56.5% | 3,417 | 0.7% | 45 |
| Berrien | 22.8% | 1,471 | 75.9% | 4,901 | 1.3% | 81 |
| Bibb | 58.7% | 38,987 | 40.7% | 27,037 | 0.6% | 424 |
| Bleckley | 27.1% | 1,380 | 71.9% | 3,657 | 0.9% | 47 |
| Brantley | 17.8% | 1,119 | 80.8% | 5,080 | 1.4% | 89 |
| Brooks | 43.0% | 2,669 | 56.5% | 3,507 | 0.5% | 29 |
| Bryan | 28.3% | 3,636 | 70.8% | 9,112 | 0.9% | 119 |
| Bulloch | 40.0% | 9,586 | 59.1% | 14,174 | 0.9% | 216 |
| Burke | 54.3% | 5,233 | 45.1% | 4,344 | 0.6% | 60 |
| Butts | 33.7% | 3,065 | 65.3% | 5,947 | 1.0% | 92 |
| Calhoun | 60.7% | 1,342 | 39.0% | 862 | 0.4% | 8 |
| Camden | 37.9% | 6,482 | 61.4% | 10,502 | 0.7% | 124 |
| Candler | 34.3% | 1,209 | 64.9% | 2,286 | 0.8% | 27 |
| Carroll | 33.0% | 14,334 | 66.0% | 28,661 | 1.0% | 448 |
| Catoosa | 24.5% | 6,025 | 74.0% | 18,218 | 1.5% | 362 |
| Charlton | 32.4% | 1,197 | 66.7% | 2,466 | 0.9% | 34 |
| Chatham | 56.8% | 62,755 | 42.4% | 46,829 | 0.8% | 858 |
| Chattahoochee | 50.1% | 830 | 49.0% | 811 | 0.9% | 15 |
| Chattooga | 31.1% | 2,596 | 66.8% | 5,572 | 2.0% | 169 |
| Cherokee | 23.8% | 22,350 | 74.8% | 70,279 | 1.4% | 1,349 |
| Clarke | 64.8% | 29,591 | 33.6% | 15,333 | 1.6% | 742 |
| Clay | 61.0% | 879 | 38.8% | 558 | 0.2% | 3 |
| Clayton | 82.9% | 82,527 | 16.6% | 16,506 | 0.5% | 481 |
| Clinch | 36.6% | 989 | 62.1% | 1,678 | 1.3% | 35 |
| Cobb | 44.7% | 141,216 | 54.1% | 170,957 | 1.2% | 3,951 |
| Coffee | 35.0% | 4,811 | 64.5% | 8,872 | 0.5% | 75 |
| Colquitt | 30.8% | 4,139 | 68.3% | 9,185 | 1.9% | 130 |
| Columbia | 28.3% | 15,703 | 70.9% | 39,322 | 0.8% | 441 |
| Cook | 35.1% | 2,075 | 63.6% | 3,782 | 0.5% | 52 |
| Coweta | 28.9% | 15,521 | 70.0% | 37,571 | 1.0% | 543 |
| Crawford | 34.9% | 1,832 | 64.0% | 3,358 | 1.1% | 58 |
| Crisp | 40.8% | 3,085 | 58.6% | 4,424 | 0.6% | 45 |
| Dade | 25.0% | 1,612 | 73.0% | 4,703 | 2.0% | 127 |
| Dawson | 16.3% | 1,632 | 82.5% | 8,242 | 1.1% | 112 |
| Decatur | 42.6% | 4,424 | 56.7% | 5,890 | 0.7% | 71 |
| DeKalb | 78.9% | 254,594 | 20.3% | 65,581 | 0.8% | 2,671 |
| Dodge | 31.6% | 2,595 | 67.4% | 5,543 | 1.0% | 86 |
| Dooly | 51.4% | 2,138 | 47.8% | 1,991 | 0.8% | 32 |
| Dougherty | 67.2% | 26,135 | 32.3% | 12,547 | 0.5% | 204 |
| Douglas | 50.4% | 27,825 | 48.6% | 26,812 | 1.0% | 560 |
| Early | 48.7% | 2,603 | 50.7% | 2,711 | 0.5% | 29 |
| Echols | 16.9% | 201 | 82.6% | 981 | 0.5% | 6 |
| Effingham | 24.3% | 4,936 | 74.9% | 15,230 | 0.9% | 175 |
| Elbert | 40.4% | 3,366 | 58.4% | 4,868 | 1.2% | 98 |
| Emanuel | 37.2% | 3,068 | 61.9% | 5,110 | 0.9% | 74 |
| Evans | 35.6% | 1,374 | 63.8% | 2,462 | 0.5% | 20 |
| Fannin | 24.5% | 2,611 | 73.4% | 7,807 | 2.1% | 225 |
| Fayette | 34.2% | 20,313 | 64.8% | 38,501 | 1.1% | 627 |
| Floyd | 31.1% | 10,691 | 67.4% | 23,132 | 1.5% | 499 |
| Forsyth | 20.4% | 15,406 | 78.4% | 59,166 | 1.2% | 931 |
| Franklin | 23.6% | 1,914 | 74.9% | 6,069 | 1.5% | 120 |
| Fulton | 67.1% | 272,000 | 32.1% | 130,136 | 0.9% | 3,489 |
| Gilmer | 23.4% | 2,614 | 75.2% | 8,408 | 1.5% | 164 |
| Glascock | 14.7% | 210 | 84.2% | 1,202 | 1.1% | 16 |
| Glynn | 37.9% | 12,676 | 61.3% | 20,479 | 0.7% | 248 |
| Gordon | 24.2% | 4,268 | 74.3% | 13,113 | 1.6% | 274 |
| Grady | 37.8% | 3,539 | 61.6% | 5,775 | 0.6% | 57 |
| Greene | 42.2% | 3,339 | 57.2% | 4,532 | 0.6% | 50 |
| Gwinnett | 44.3% | 129,025 | 54.6% | 158,746 | 1.1% | 3,167 |
| Habersham | 19.5% | 2,900 | 79.2% | 11,766 | 1.3% | 193 |
| Hall | 24.0% | 14,457 | 74.8% | 44,962 | 1.2% | 711 |
| Hancock | 81.3% | 3,535 | 18.3% | 795 | 0.4% | 18 |
| Haralson | 20.2% | 2,248 | 77.8% | 8,658 | 2.0% | 224 |
| Harris | 28.0% | 4,184 | 71.2% | 10,648 | 0.8% | 113 |
| Hart | 33.6% | 3,365 | 65.2% | 6,537 | 1.2% | 122 |
| Heard | 24.6% | 1,042 | 74.0% | 3,133 | 1.3% | 56 |
| Henry | 45.8% | 40,527 | 53.3% | 47,115 | 0.9% | 762 |
| Houston | 39.4% | 22,094 | 59.6% | 33,392 | 1.0% | 548 |
| Irwin | 31.2% | 1,197 | 67.8% | 2,605 | 1.0% | 38 |
| Jackson | 21.5% | 4,950 | 77.2% | 17,776 | 1.3% | 290 |
| Jasper | 32.7% | 1,935 | 66.2% | 3,916 | 1.0% | 60 |
| Jeff Davis | 25.7% | 1,356 | 73.2% | 3,867 | 1.2% | 63 |
| Jefferson | 57.3% | 4,149 | 42.3% | 3,061 | 0.3% | 25 |
| Jenkins | 43.1% | 1,482 | 56.2% | 1,936 | 0.7% | 24 |
| Johnson | 32.8% | 1,198 | 66.5% | 2,426 | 0.7% | 26 |
| Jones | 36.7% | 4,572 | 62.5% | 7,782 | 0.9% | 106 |
| Lamar | 35.7% | 2,752 | 63.2% | 4,873 | 1.0% | 80 |
| Lanier | 36.9% | 1,062 | 62.0% | 1,787 | 1.1% | 31 |
| Laurens | 38.9% | 7,769 | 60.4% | 12,052 | 0.7% | 142 |
| Lee | 23.6% | 3,100 | 75.7% | 9,925 | 0.7% | 87 |
| Liberty | 63.9% | 10,474 | 35.5% | 5,828 | 0.6% | 98 |
| Lincoln | 37.3% | 1,650 | 61.7% | 2,731 | 1.0% | 43 |
| Long | 37.2% | 1,288 | 61.2% | 2,119 | 1.5% | 53 |
| Lowndes | 44.8% | 17,651 | 54.0% | 21,296 | 1.2% | 465 |
| Lumpkin | 23.3% | 2,586 | 75.0% | 8,326 | 1.8% | 196 |
| McDuffie | 42.2% | 3,989 | 57.1% | 5,400 | 0.7% | 66 |
| McIntosh | 46.6% | 2,905 | 52.6% | 3,282 | 0.8% | 49 |
| Macon | 65.2% | 3,251 | 34.3% | 1,712 | 0.4% | 21 |
| Madison | 26.1% | 2,965 | 72.4% | 8,226 | 1.5% | 174 |
| Marion | 43.3% | 1,381 | 55.6% | 1,772 | 1.1% | 35 |
| Meriwether | 46.9% | 4,465 | 52.3% | 4,982 | 0.7% | 71 |
| Miller | 29.9% | 818 | 69.3% | 1,899 | 0.8% | 23 |
| Mitchell | 47.6% | 3,872 | 51.7% | 4,201 | 0.7% | 59 |
| Monroe | 33.8% | 4,106 | 65.3% | 7,933 | 0.9% | 108 |
| Montgomery | 29.1% | 1,045 | 70.2% | 2,521 | 0.8% | 27 |
| Morgan | 33.7% | 3,091 | 65.3% | 5,987 | 0.9% | 87 |
| Murray | 26.4% | 3,026 | 71.5% | 8,180 | 2.1% | 241 |
| Muscogee | 59.5% | 44,158 | 39.9% | 29,568 | 0.6% | 436 |
| Newton | 50.2% | 20,827 | 49.0% | 20,337 | 0.8% | 318 |
| Oconee | 28.1% | 4,825 | 70.6% | 12,120 | 1.3% | 229 |
| Oglethorpe | 34.5% | 2,232 | 64.1% | 4,144 | 1.3% | 87 |
| Paulding | 30.2% | 17,229 | 68.7% | 39,192 | 1.1% | 655 |
| Peach | 52.9% | 5,927 | 46.2% | 5,173 | 0.9% | 96 |
| Pickens | 20.3% | 2,595 | 78.1% | 10,004 | 1.7% | 214 |
| Pierce | 18.4% | 1,253 | 80.9% | 5,500 | 0.6% | 44 |
| Pike | 19.2% | 1,575 | 79.6% | 6,547 | 1.2% | 99 |
| Polk | 28.6% | 4,052 | 69.6% | 9,850 | 1.8% | 251 |
| Pulaski | 34.8% | 1,377 | 64.4% | 2,553 | 0.8% | 32 |
| Putnam | 33.9% | 3,102 | 65.3% | 5,966 | 0.8% | 71 |
| Quitman | 53.5% | 597 | 45.6% | 509 | 0.9% | 10 |
| Rabun | 26.2% | 2,001 | 71.9% | 5,487 | 1.9% | 145 |
| Randolph | 57.0% | 1,833 | 42.6% | 1,370 | 0.4% | 14 |
| Richmond | 65.6% | 52,100 | 33.8% | 26,842 | 0.6% | 480 |
| Rockdale | 54.3% | 20,526 | 44.8% | 16,921 | 0.9% | 337 |
| Schley | 27.5% | 479 | 72.0% | 1,252 | 0.5% | 8 |
| Screven | 46.6% | 3,024 | 52.8% | 3,423 | 0.6% | 40 |
| Seminole | 41.4% | 1,660 | 57.8% | 2,315 | 0.8% | 32 |
| Spalding | 40.1% | 10,141 | 58.8% | 14,885 | 1.1% | 269 |
| Stephens | 25.6% | 2,705 | 72.9% | 7,689 | 1.5% | 158 |
| Stewart | 61.9% | 1,305 | 37.1% | 783 | 1.0% | 21 |
| Sumter | 52.7% | 6,454 | 46.7% | 5,717 | 0.7% | 84 |
| Talbot | 64.0% | 2,369 | 35.2% | 1,301 | 0.8% | 31 |
| Taliaferro | 64.9% | 643 | 34.2% | 339 | 0.8% | 8 |
| Tattnall | 28.7% | 1,932 | 70.3% | 4,730 | 1.0% | 64 |
| Taylor | 42.8% | 1,536 | 56.3% | 2,021 | 0.8% | 30 |
| Telfair | 42.6% | 1,862 | 56.8% | 2,486 | 0.6% | 28 |
| Terrell | 56.6% | 2,501 | 42.8% | 1,890 | 0.7% | 30 |
| Thomas | 41.7% | 7,720 | 57.5% | 10,642 | 0.7% | 132 |
| Tift | 33.3% | 4,749 | 66.1% | 9,431 | 0.6% | 89 |
| Toombs | 30.5% | 2,964 | 68.6% | 6,658 | 0.8% | 82 |
| Towns | 24.1% | 1,391 | 74.5% | 4,292 | 1.4% | 81 |
| Treutlen | 37.5% | 1,112 | 61.6% | 1,826 | 0.8% | 24 |
| Troup | 40.1% | 10,455 | 59.0% | 15,391 | 0.9% | 222 |
| Turner | 40.1% | 1,427 | 58.9% | 2,096 | 0.9% | 33 |
| Twiggs | 53.1% | 2,402 | 46.2% | 2,087 | 0.7% | 33 |
| Union | 23.3% | 2,486 | 75.0% | 8,013 | 1.8% | 191 |
| Upson | 35.5% | 4,061 | 63.8% | 7,291 | 0.7% | 82 |
| Walker | 25.8% | 6,095 | 72.3% | 17,110 | 1.9% | 449 |
| Walton | 23.5% | 8,469 | 75.5% | 27,253 | 1.0% | 357 |
| Ware | 32.4% | 4,034 | 66.8% | 8,311 | 0.7% | 91 |
| Warren | 58.4% | 1,554 | 40.8% | 1,087 | 0.8% | 21 |
| Washington | 51.9% | 4,607 | 47.5% | 4,216 | 0.6% | 55 |
| Wayne | 27.0% | 2,858 | 71.9% | 7,601 | 1.1% | 116 |
| Webster | 46.4% | 515 | 52.9% | 588 | 0.7% | 8 |
| Wheeler | 35.9% | 794 | 63.6% | 1,408 | 0.5% | 12 |
| White | 20.1% | 2,174 | 78.4% | 8,467 | 1.5% | 158 |
| Whitfield | 29.4% | 8,167 | 69.2% | 19,230 | 1.4% | 394 |
| Wilcox | 30.9% | 978 | 68.2% | 2,159 | 0.9% | 27 |
| Wilkes | 45.8% | 2,315 | 53.5% | 2,705 | 0.8% | 40 |
| Wilkinson | 49.1% | 2,298 | 50.2% | 2,349 | 0.7% | 31 |
| Worth | 30.3% | 2,542 | 69.0% | 5,780 | 0.7% | 60 |
By congressional district
John McCain carried eight congressional districts in Georgia, including all seven held by Republicans and one district held by a Democrat.
| District | McCain | Obama | Representative |
|---|---|---|---|
| 1st | 62.81% | 36.39% | Jack Kingston |
| 2nd | 45.91% | 53.55% | Sanford D. Bishop, Jr. |
| 3rd | 63.87% | 35.27% | Lynn Westmoreland |
| 4th | 20.65% | 78.61% | Hank Johnson |
| 5th | 20.01% | 79.12% | John Lewis |
| 6th | 62.26% | 36.56% | Tom Price |
| 7th | 59.68% | 39.28% | John Linder |
| 8th | 56.34% | 42.98% | Jim Marshall |
| 9th | 75.33% | 23.46% | Nathan Deal |
| 10th | 61.12% | 37.96% | Paul Broun |
| 11th | 65.60% | 33.12% | Phil Gingrey |
| 12th | 45.25% | 54.09% | John Barrow |
| 13th | 28.38% | 70.85% | David Scott |
Electors
Technically the voters of Georgia cast their ballots for electors: representatives to the Electoral College. Georgia is allocated 15 electors because it has 13 congressional districts and 2 senators. All candidates who appear on the ballot or qualify to receive write-in votes must submit a list of 15 electors, who pledge to vote for their candidate and his or her running mate. Whoever wins the majority of votes in the state is awarded all 15 electoral votes. Their chosen electors then vote for President and Vice President. Although electors are pledged to their candidate and running mate, they are not obligated to vote for them. An elector who votes for someone other than his or her candidate is known as a faithless elector.
The electors of each state and the District of Columbia met on December 15, 2008 to cast their votes for President and Vice President. The Electoral College itself never meets as one body. Instead the electors from each state and the District of Columbia met in their respective capitols.
The following were the members of the Electoral College from the state. All 15 were pledged to John McCain and Sarah Palin:[24]
- Esther Clark
- Dennis Coxwell
- Norma Edenfield
- Randy Evans
- Sue P. Everhart
- Leigh Ann Gillis
- Judy Goddard
- Linda Herren
- Rufus Montgomery
- Clint Murphy
- Sunny Park
- Alec Poitevint
- John Sours
- Allan Vigil
- John White
References
- ↑ Mark Preston; Alexander Marquardt; Kristi Keck (2008-07-09). "Obama Looks to Turn Georgia Blue". CNN. Retrieved 2009-06-21.
- ↑ Jay Cost. "Georgia: McCain vs. Obama - Polling Averages". RealClearPolitics. Retrieved 2009-06-21.
- ↑ Maya Curry; Marti Covington; Michael Scherer (2008-09-23). "Obama Scales Back His 50-State Strategy". Time Magazine. Retrieved 2009-06-21.
- ↑ D.C.'s Political Report: The complete source for campaign summaries
- ↑ Presidential | The Cook Political Report Archived May 5, 2015, at the Wayback Machine.
- ↑ Adnaan (2008-09-20). "Track the Electoral College vote predictions". The Takeaway. Archived from the original on April 22, 2009. Retrieved 2009-11-14.
- ↑ Election Projection: 2008 Elections - Polls, Projections, Results
- ↑ Electoral-vote.com: President, Senate, House Updated Daily
- 1 2 3 4 Based on Takeaway
- ↑ POLITICO's 2008 Swing State Map - POLITICO.com
- ↑ RealClearPolitics - Electoral Map
- ↑ CQ Politics | CQ Presidential Election Maps, 2008 Archived June 14, 2009, at the Wayback Machine.
- ↑ "Electoral College Map". The New York Times. Retrieved 2010-05-26.
- ↑ "October – 2008 – CNN Political Ticker - CNN.com Blogs". CNN. Retrieved 2010-05-26.
- ↑ "Winning the Electoral College". Fox News. 2010-04-27.
- ↑ roadto270
- ↑ Election 2008: Electoral College Update - Rasmussen Reports™
- ↑ Election 2008 Polls - Dave Leip's Atlas of U.S. Presidential Elections
- ↑ Presidential Campaign Finance
- ↑ "Map: Campaign Ad Spending - Election Center 2008 from CNN.com". CNN. Retrieved 2010-05-26.
- ↑ "Map: Campaign Candidate Visits - Election Center 2008 from CNN.com". CNN. Retrieved 2010-05-26.
- ↑ Jay Cost; Sean Trende. "Election Review, Part 2: The South Atlantic". RealClearPolitics. Retrieved 2009-06-21.
- ↑ "Atlas of U.S. Presidential Elections". Retrieved 2013-01-13.
- ↑ Presidential Electors for the November 2, 2010 General Election