United States presidential election in New York, 2008
| | ||||||||||||||||||||||||||||||||
| ||||||||||||||||||||||||||||||||
| ||||||||||||||||||||||||||||||||
|
| ||||||||||||||||||||||||||||||||
| County Results
Obama—80-90%
Obama—70-80%
Obama—60-70%
Obama—50-60%
Obama—<50%
McCain—<50%
McCain—50-60%
McCain—60-70% | ||||||||||||||||||||||||||||||||
| ||||||||||||||||||||||||||||||||


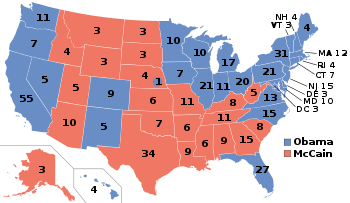
The 2008 United States presidential election in New York took place on November 4, 2008 throughout all 50 states and D.C., which was part of the 2008 United States presidential election. Voters chose 31 representatives, or electors to the Electoral College, who voted for President and Vice President.
New York was won by Democratic nominee Barack Obama with a 26.9% margin of victory. Obama took 62.88% of the vote to McCain's 36.03%. At the time this was the highest Democratic vote share in New York State since 1964, although Obama would outperform his 2008 showing in New York just four years later in 2012. Prior to the election, all 17 news organizations considered this a state Obama would win, or otherwise considered as a safe blue state. Located in the Northeast, a region of the country that is trending heavily towards the Democrats, elections in the Empire State are dominated by the presence of the heavily populated, heavily diverse, liberal bastion of New York City where Democrats are always favored to win. Despite the fact that Hillary Rodham Clinton, the former junior U.S. Senator from New York, did not receive the Democratic presidential nomination, there appeared to be no hard feelings in the state among her constituents as the state swung even more into the Democratic column in 2008 as New York's 31 electoral college votes went to Barack Obama.
Primaries
Campaign
Predictions
There were 17 news organizations who made state by state predictions of the election. Here are their last predictions before election day:
- D.C. Political Report: Democrat[1]
- Cook Political Report: Solid Democrat[2]
- Takeaway: Solid Obama[3]
- Election Projection: Solid Obama[4]
- Electoral-vote.com: Strong Democrat[5]
- Washington Post: Solid Obama[6]
- Politico: Solid Obama[7]
- Real Clear Politics: Solid Obama[8]
- FiveThirtyEight.com: Solid Obama[6]
- CQ Politics: Safe Democrat[9]
- New York Times: Solid Democrat[10]
- CNN: Safe Democrat[11]
- NPR: Solid Obama[6]
- MSNBC: Solid Obama[6]
- Fox News: Democrat[12]
- Associated Press: Democrat[13]
- Rasmussen Reports: Safe Democrat[14]
Polling
Obama won all but one pre-election poll. Since September 15, Obama won each poll with a double digit margin of victory and each with at least 55% of the vote. He won the final Marist poll with a 36-point spread. The final 3 polls averaged Obama leading 63% to 31%.[15]
Fundraising
John McCain raised a total of $12,582,856 in the state. Barack Obama raised $58,161,743.[16]
Advertising and visits
Obama and his interest groups spent $1,148,016. McCain and his interest groups spent just $7,310.[17] The Republican visited the state 11 times and the Democratic ticket visited the state 4 times.[18]
Analysis
New York was once reckoned as a powerful swing state with a slight Democratic lean. However, the last time the state went Republican was for Ronald Reagan in 1984. Michael Dukakis narrowly won it in 1988, but the state has not been seriously contested since then. It is now considered an uncontested blue state, and was heavily favored to vote for Obama by a significant margin.
Elections in the Empire State are dominated by the presence of New York City, a Democratic stronghold for more than a century and a half. It is made up mostly of white liberals as well as ethnic and religious minorities—all voting blocs that strongly vote Democratic. Obama won Manhattan, Brooklyn, and the Bronx by margins of 5-to-1 or more and carried Queens by a 3-to-1 margin. The only borough McCain carried was Staten Island, traditionally the most conservative area of the city. Obama's combined million-vote margin in the Five Boroughs would have been enough by itself to carry the state.
However, Obama also dominated heavily Democratic Western New York, including Buffalo and Rochester, and the Capital District (Albany, Schenectady and Troy), as well as the increasingly Democratic Long Island and Syracuse areas. Even when New York was considered a swing state, a Republican had to carry Long Island and do reasonably well in either Western New York, the Capital District or Syracuse to make up for the massive Democratic margins in New York City. Obama also won a number of traditionally Republican-leaning counties in Upstate New York and became the first Democrat since Lyndon B. Johnson to win an outright majority of votes in the Upstate (although Democratic candidates had been consistently winning pluralities of the vote since 1992).
At the same time, Democrats in New York picked up three seats in the U.S. House of Representatives in 2008. In the 13th district, which consists of Staten Island and part of Brooklyn, Democrats picked up an open seat that was vacated by former Republican Vito Fossella who resigned after he was arrested for getting a DUI. Democrat Michael McMahon solidly defeated Republican Robert Staniere by a two-to-one margin, 60.79-33.26%. His victory made the city's delegation entirely Democratic for the first time in over 70 years. In the 25th district, centered around Syracuse, Democrat Dan Maffei handily defeated Republican Dale Sweetland 55% to 42% for the open seat vacated by Republican Jim Walsh. In New York's 29th congressional district, which includes Canandaigua, Democrat Eric Massa narrowly defeated incumbent Republican Randy Kuhl by 1.7 points. This reduced the Republicans to only three of the state's 29 seats in the House—the fewest the GOP has ever won in an election. At the state level, Democrats picked up a seat in the New York State Assembly and two seats in the New York State Senate which gave Democrats control of the Senate and ultimately both chambers of the New York Legislature for the first time since 1965. This gave the Democrats complete control of New York's state government for the first time since 1936.
Results
| United States presidential election in New York, 2008 | ||||||
|---|---|---|---|---|---|---|
| Party | Candidate | Running mate | Votes | Percentage | Electoral votes | |
| Democratic | Barack Obama | 4,645,332 | 60.80% | |||
| Working Families | Barack Obama | 159,613 | 2.09% | |||
| Total | Barack Obama | Joe Biden | 4,804,945 | 62.88% | 31 | |
| Republican | John McCain | 2,418,323 | 31.65% | |||
| Conservative | John McCain | 170,475 | 2.23% | |||
| Independence | John McCain | 163,973 | 2.15% | |||
| Total | John McCain | Sarah Palin | 2,752,771 | 36.03% | 0 | |
| Populist | Ralph Nader | Matt Gonzalez | 41,249 | 0.54% | 0 | |
| Libertarian | Bob Barr | Wayne Allyn Root | 19,596 | 0.26% | 0 | |
| Green | Cynthia McKinney | Rosa Clemente | 12,801 | 0.17% | 0 | |
| Socialist Workers | James Harris | Alyson Kennedy | 3,615 | 0.05% | 0 | |
| Write-ins | Write-ins | 3,272 | 0.04% | 0 | ||
| Socialism and Liberation | Gloria La Riva | Eugene Puryear | 1,639 | 0.02% | 0 | |
| Constitution (Write-in) | Chuck Baldwin | Darrell Castle | 646 | 0.01% | 0 | |
| Independent (Write-in) | Ron Paul | 341 | >0.01% | 0 | ||
| America's Independent (Write-in) | Alan Keyes | Brian Rohrbough | 35 | >0.01% | 0 | |
| Socialist Equality (Write-in) | Jerry White | Bill Van Auken | 18 | >0.01% | 0 | |
| Socialist (Write-in) | Brian Moore | Stewart Alexander | 10 | >0.01% | 0 | |
| Independent (Write-In) | Lanakila Washington | 3 | >0.01% | 0 | ||
| Heartquake '08 (Write-In) | Jonathan E. Allen | 1 | >0.01% | 0 | ||
| Independent (Write-In) | Michael Skok | 1 | >0.01% | 0 | ||
| Totals | 7,640,948 | 100.00% | 31 | |||
| Voter turnout (Voting age population) | 52.1% | |||||
Results breakdown
Geographic Breakdown
Barack Obama dominated in fiercely Democratic New York City, taking 2,074,159 votes to John McCain's 524,787, giving Obama a 79.29% - 20.06% landslide victory citywide.
Excluding the votes of New York City, Obama still would have carried New York State, but by a smaller margin. Obama would have received 2,730,786 votes to McCain's 2,227,984, giving Obama a 55.06% - 44.93% victory.
By county
| County | Obama% | Obama# | McCain% | McCain# | Others% | Others# |
|---|---|---|---|---|---|---|
| Bronx | 88.7% | 338,261 | 10.9% | 41,683 | 0.4% | 1,378 |
| New York (Manhattan) | 85.7% | 572,126 | 13.5% | 89,906 | 0.8% | 5,562 |
| Kings (Brooklyn) | 79.4% | 603,525 | 20.0% | 151,872 | 0.6% | 4,451 |
| Queens | 75.1% | 480,692 | 24.3% | 155,221 | 0.6% | 4,076 |
| Tompkins | 70.1% | 29,826 | 28.0% | 11,927 | 1.9% | 799 |
| Albany | 63.8% | 93,937 | 34.4% | 50,586 | 1.9% | 2,743 |
| Westchester | 63.4% | 261,810 | 35.8% | 147,824 | 0.8% | 3,410 |
| Ulster | 60.7% | 52,539 | 37.6% | 32,527 | 1.7% | 1,476 |
| Clinton | 60.6% | 20,216 | 37.7% | 12,579 | 1.6% | 542 |
| Franklin | 60.3% | 10,571 | 38.1% | 6,676 | 1.6% | 273 |
| Onondaga | 59.3% | 129,317 | 38.9% | 84,972 | 1.8% | 3,950 |
| Monroe | 58.2% | 207,225 | 40.5% | 144,153 | 1.3% | 4,781 |
| Erie | 58.0% | 256,299 | 40.5% | 178,815 | 1.6% | 6,871 |
| St. Lawrence | 57.4% | 23,706 | 41.0% | 16,956 | 1.6% | 664 |
| Essex | 55.9% | 10,390 | 42.6% | 7,913 | 1.6% | 292 |
| Columbia | 55.9% | 17,556 | 42.4% | 13,337 | 1.7% | 540 |
| Schenectady | 55.3% | 38,611 | 42.6% | 29,758 | 2.1% | 1,473 |
| Cortland | 54.1% | 11,861 | 44.2% | 9,678 | 1.7% | 381 |
| Sullivan | 54.0% | 16,850 | 44.6% | 13,900 | 1.4% | 433 |
| Nassau | 53.8% | 342,067 | 45.4% | 288,758 | 0.7% | 4,657 |
| Rensselaer | 53.7% | 39,753 | 44.4% | 32,840 | 1.9% | 1,393 |
| Dutchess | 53.7% | 71,060 | 45.1% | 59,628 | 1.2% | 1,614 |
| Cayuga | 53.3% | 18,128 | 44.8% | 15,243 | 1.9% | 651 |
| Broome | 53.1% | 47,204 | 45.1% | 40,077 | 1.8% | 1,556 |
| Rockland | 52.6% | 69,543 | 46.7% | 61,752 | 0.7% | 898 |
| Suffolk | 52.5% | 346,379 | 46.5% | 306,815 | 0.9% | 6,209 |
| Otsego | 52.0% | 13,570 | 46.0% | 12,026 | 2.0% | 525 |
| Orange | 51.5% | 78,326 | 47.4% | 72,042 | 1.1% | 1,614 |
| Saratoga | 50.9% | 56,645 | 47.5% | 52,855 | 1.7% | 1,887 |
| Warren | 50.5% | 16,281 | 47.8% | 15,429 | 1.7% | 535 |
| Seneca | 50.3% | 7,422 | 47.7% | 7,038 | 1.9% | 281 |
| Oswego | 50.2% | 24,777 | 47.8% | 23,571 | 2.0% | 1,001 |
| Niagara | 49.7% | 47,303 | 48.6% | 46,348 | 1.7% | 1,621 |
| Chautauqua | 49.5% | 29,129 | 48.6% | 28,579 | 1.9% | 1,074 |
| Washington | 49.5% | 12,741 | 48.7% | 12,533 | 1.8% | 456 |
| Madison | 49.3% | 14,692 | 48.4% | 14,434 | 2.3% | 676 |
| Ontario | 49.2% | 25,103 | 49.3% | 25,171 | 1.5% | 746 |
| Chemung | 48.8% | 18,888 | 50.0% | 19,364 | 1.1% | 443 |
| Chenango | 48.4% | 10,100 | 49.6% | 10,337 | 2.0% | 410 |
| Richmond (Staten Island) | 47.6% | 79,311 | 51.7% | 86,062 | 0.7% | 1,205 |
| Yates | 47.6% | 4,890 | 51.3% | 5,269 | 1.2% | 121 |
| Jefferson | 46.7% | 18,166 | 52.0% | 20,219 | 1.3% | 500 |
| Delaware | 46.4% | 9,462 | 51.6% | 10,524 | 2.0% | 403 |
| Oneida | 46.1% | 43,506 | 52.2% | 49,256 | 1.7% | 1,603 |
| Putnam | 45.7% | 21,613 | 53.2% | 25,145 | 1.0% | 486 |
| Schuyler | 45.7% | 3,933 | 52.8% | 4,542 | 1.5% | 125 |
| Livingston | 45.3% | 13,655 | 53.2% | 16,030 | 1.5% | 464 |
| Montgomery | 45.0% | 9,080 | 53.1% | 10,711 | 1.9% | 384 |
| Lewis | 44.8% | 4,986 | 53.6% | 5,969 | 1.6% | 183 |
| Herkimer | 44.5% | 12,094 | 53.8% | 14,619 | 1.7% | 471 |
| Fulton | 44.4% | 9,695 | 53.7% | 11,709 | 1.9% | 420 |
| Wayne | 44.3% | 18,184 | 54.2% | 22,239 | 1.5% | 622 |
| Greene | 44.1% | 9,850 | 54.0% | 12,059 | 1.9% | 426 |
| Tioga | 44.0% | 10,172 | 54.2% | 12,536 | 1.8% | 423 |
| Cattaraugus | 43.9% | 14,307 | 54.5% | 17,770 | 1.7% | 540 |
| Schoharie | 41.7% | 6,009 | 56.0% | 8,071 | 2.2% | 322 |
| Steuben | 40.9% | 17,148 | 57.7% | 24,203 | 1.3% | 560 |
| Genesee | 40.0% | 10,762 | 58.4% | 15,705 | 1.5% | 406 |
| Orleans | 39.9% | 6,614 | 58.5% | 9,708 | 1.6% | 262 |
| Allegany | 38.1% | 7,016 | 59.8% | 11,013 | 2.0% | 377 |
| Wyoming | 36.1% | 6,379 | 62.3% | 10,998 | 1.6% | 290 |
| Hamilton | 35.9% | 1,225 | 62.8% | 2,141 | 1.3% | 45 |
By congressional district
Barack Obama swept 25 of the state’s 29 congressional districts in New York, including one district held by a Republican. John McCain carried four districts, including two districts that simultaneously elected a Democrat to the U.S. House.
| District | McCain | Obama | Representative |
|---|---|---|---|
| 1st | 47.62% | 51.44% | Tim Bishop |
| 2nd | 43.09% | 56.13% | Steve Israel |
| 3rd | 51.90% | 47.27% | Peter T. King |
| 4th | 41.35% | 57.99% | Carolyn McCarthy |
| 5th | 36.06% | 63.24% | Gary Ackerman |
| 6th | 10.68% | 89.03% | Gregory W. Meeks |
| 7th | 20.37% | 79.12% | Joseph Crowley |
| 8th | 25.45% | 73.70% | Jerrold Nadler |
| 9th | 43.92% | 55.32% | Anthony D. Weiner |
| 10th | 8.70% | 91.03% | Edolphus Towns |
| 11th | 9.07% | 90.49% | Yvette D. Clark |
| 12th | 13.12% | 86.17% | Nydia Velasquez |
| 13th | 50.56% | 48.74% | Vito Fossella (110th Congress) |
| Michael McMahon (111th Congress) | |||
| 14th | 20.92% | 78.19% | Carolyn B. Maloney |
| 15th | 6.17% | 93.21% | Charlie Rangel |
| 16th | 5.04% | 94.76% | Jose Serrano |
| 17th | 27.53% | 71.92% | Eliot L. Engel |
| 18th | 37.57% | 61.66% | Nita Lowey |
| 19th | 48.37% | 50.65% | John Hall |
| 20th | 47.70% | 50.70% | Kirsten Gillibrand (110th Congress) |
| Scott Murphy (111th Congress) | |||
| 21st | 40.00% | 58.14% | Paul Tonko |
| 22nd | 39.31% | 59.23% | Maurice Hinchey |
| 23rd | 46.59% | 51.81% | John M. McHugh |
| 24th | 47.97% | 50.33% | Mike Arcuri |
| 25th | 42.62% | 55.74% | James T. Walsh (110th Congress) |
| Dan Maffei (111th Congress) | |||
| 26th | 52.15% | 46.43% | Thomas M. Reynolds (110th Congress) |
| Christopher Lee (111th Congress) | |||
| 27th | 44.03% | 54.19% | Brian Higgins |
| 28th | 30.29% | 68.47% | Louise Slaughter |
| 29th | 50.46% | 48.24% | Randy Kuhl (110th Congress) |
| Eric Massa (111th Congress) |
Electors
Technically the voters of NY cast their ballots for electors: representatives to the Electoral College. NY is allocated 31 electors because it has 29 congressional districts and 2 senators. All candidates who appear on the ballot or qualify to receive write-in votes must submit a list of 31 electors, who pledge to vote for their candidate and his or her running mate. Whoever wins the majority of votes in the state is awarded all 31 electoral votes. Their chosen electors then vote for President and Vice President. Although electors are pledged to their candidate and running mate, they are not obligated to vote for them.[19] An elector who votes for someone other than his or her candidate is known as a faithless elector.
The electors of each state and the District of Columbia met on December 15, 2008 to cast their votes for President and Vice President. The Electoral College itself never meets as one body. Instead the electors from each state and the District of Columbia met in their respective capitols.
The following were the members of the Electoral College from the state. All 31 electors were pledged to Barack Obama and Joe Biden:[20]
- Velda Jeffrey
- June O'Neill
- Dennis Mehiel
- David Paterson
- Andrew Cuomo
- Thomas DiNapoli
- Sheldon Silver
- Malcolm Smith
- Maria Luna
- Robert Master
- Pamela Green-Perkins
- Helen D. Foster
- Jon Cooper
- Hakeem Jeffries
- Richard Fife
- Deborah Slott
- Terrence Yang
- George Arthur
- George Gresham
- Alan Van Capelle
- Inez Dickens
- Suzy Ballantyne
- Alan Lubin
- Bethaida Gonzalez
- Christine Quinn
- William Thompson
- Stuart Applebaum
- Maritza Davila
- Ivan Young
- Barbara J. Fiala
- Frank A. Bolz
References
- ↑ D.C.'s Political Report: The complete source for campaign summaries
- ↑ Presidential | The Cook Political Report Archived May 5, 2015, at the Wayback Machine.
- ↑ Adnaan (2008-09-20). "Track the Electoral College vote predictions". The Takeaway. Archived from the original on April 22, 2009. Retrieved 2009-11-14.
- ↑ Election Projection: 2008 Elections - Polls, Projections, Results
- ↑ Electoral-vote.com: President, Senate, House Updated Daily
- 1 2 3 4 Based on Takeaway
- ↑ POLITICO's 2008 Swing State Map - POLITICO.com
- ↑ RealClearPolitics - Electoral Map
- ↑ CQ Politics | CQ Presidential Election Maps, 2008 Archived October 29, 2008, at the Wayback Machine.
- ↑ "Electoral College Map". The New York Times. Retrieved May 26, 2010.
- ↑ "October – 2008 – CNN Political Ticker - CNN.com Blogs". CNN. Retrieved May 26, 2010.
- ↑ "Winning the Electoral College". Fox News. April 27, 2010.
- ↑ roadto270
- ↑ Election 2008: Electoral College Update - Rasmussen Reports™
- ↑ Election 2008 Polls - Dave Leip's Atlas of U.S. Presidential Elections
- ↑ Presidential Campaign Finance
- ↑ "Map: Campaign Ad Spending - Election Center 2008 from CNN.com". CNN. Retrieved May 26, 2010.
- ↑ "Map: Campaign Candidate Visits - Election Center 2008 from CNN.com". CNN. Retrieved May 26, 2010.
- ↑ "Electoral College". California Secretary of State. Archived from the original on October 30, 2008. Retrieved 2008-11-01.
- ↑ U. S. Electoral College 2008 Election - Certificates
State results of the United States presidential election, 2008 | ||
|---|---|---|
|  | |