United States presidential election in Indiana, 2008
| | ||||||||||||||||||||||||||||||||
| ||||||||||||||||||||||||||||||||
| ||||||||||||||||||||||||||||||||
|
| ||||||||||||||||||||||||||||||||
County Results
| ||||||||||||||||||||||||||||||||
| ||||||||||||||||||||||||||||||||

| Elections in Indiana | ||||||||||
|---|---|---|---|---|---|---|---|---|---|---|
 | ||||||||||
|
||||||||||
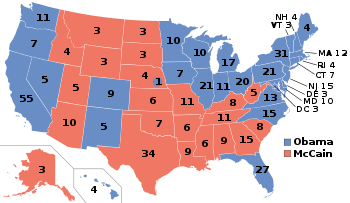
The 2008 United States presidential election in Indiana took place on November 4, 2008 throughout all 50 states and D.C., which was part of the 2008 United States presidential election. Voters chose 11 representatives, or electors to the Electoral College, who voted for President and Vice President.
Indiana was won by Democratic nominee Barack Obama by a 1.03% margin of victory. Prior to the election, news organizations were split as some considered it as leaning McCain, or a red state, and the others simply considered the election as a toss-up, or swing state. None of the major news/ political organizations listed here actually made the correct prediction, an Obama win. On election day, Obama narrowly carried Indiana, which marked the first time a Democratic presidential nominee won Indiana since Lyndon B. Johnson in 1964.
Primaries
On May 6, 2008 Indiana held its Presidential primaries:
Campaign
Predictions
There were 17 news organizations who made state by state predictions of the election. Here are their last predictions before election day:
- D.C. Political Report: Republican[1]
- Cook Political Report: Toss-Up[2]
- Takeaway: Leaning McCain[3]
- Election Projection: Leaning McCain[4]
- Electoral-vote.com: Leaning McCain[5]
- The Washington Post: Leaning McCain[6]
- The Politico: Leaning McCain[7]
- RealClearPolitics: Toss-Up[8]
- FiveThirtyEight.com: Leaning McCain[6]
- CQ Politics: Toss-Up[9]
- The New York Times: Toss-Up[10]
- CNN: Toss-Up[11]
- NPR: Leaning McCain[6]
- MSNBC: Toss-Up[6]
- Fox News: Toss-Up[12]
- Associated Press: Toss-Up[13]
- Rasmussen Reports: Toss-Up[14]
Polling
Pre-election polling was always tight, although McCain generally had a slight lead in 3 poll averages throughout the entire general election, including the final weeks of the election. Rasmussen Reports never had Obama winning a state poll. In the last opinion polling before the election, conducted by Public Policy Polling (October 31-November 2, 2008), Barack Obama led John McCain 49% to 48%. The final 3 poll average gave McCain the lead 49% to 46%, with undecided voters deciding the election.[15]
Fundraising
John McCain raised a total of $1,758,471 in the state. Barack Obama raised $3,400,475.[16]
Advertising and visits
Obama massively outspent McCain in this state. Obama and his interest groups spent $17,796,704. McCain and his interest groups spent $3,160,264.[17] The Democratic ticket visited this state 8 times. The Republican ticket visited 5 times.[18]
Analysis
Historically, Indiana has been the most Republican state in the Great Lakes region. However, polling in September and October showed that Indiana was possibly turning into a swing state in 2008. George W. Bush easily captured Indiana's 11 electoral votes in 2004, defeating Democrat John Kerry by more than 20%. In contrast, most polls from the summer of 2008 onward showed only single-digit margins.
The race was as close as expected. Indiana's polls closed at 6 p.m. local time. The state has often been among the first to be called for the Republican candidate; in 2004, for instance, the state was called for Bush almost as soon as the polls in the Central Time Zone portion of the state closed.[19] However, the race for the state was too close to call at 6pm, sending an early signal of potential upset to voters throughout the rest of the country. Indiana still had not been decided when most media outlets declared Obama president-elect at 11 p.m. Eastern time. Indiana was finally called for Senator Obama at around 6 a.m. Eastern on November 5. Ultimately, Obama ended up carrying Indiana by 1,374,039 votes to John McCain's 1,345,648 votes, a difference of 28,391 votes (approximately 1.03% of the total votes cast). The Libertarian candidate polled 29,257 votes - more than the margin of Obama's win.
At the same time as Obama captured Indiana's 11 electoral votes, incumbent Republican Governor Mitch Daniels was reelected to a second term with 57.84% of the vote over Democrat Jill Long Thompson who received 40.04%. Libertarian Andy Horning received 2.12%. At the state level, Democrats picked up one seat in the Indiana House of Representatives.
Results
| Party | Candidate | Votes | % | ± | |
|---|---|---|---|---|---|
| Democratic | Barack Obama | 1,374,039 | 49.85% | +10.59% | |
| Republican | John McCain | 1,345,648 | 48.82% | -11.13% | |
| Libertarian | Bob Barr | 29,257 | 1.06% | +0.36% | |
| No party | Others | 7,396 | 0.27% | — | |
| Plurality | 28,391 | 1.03% | |||
| Turnout | 2,756,340 | 58.8% | |||
Results breakdown
By county
Obama won only 15 of Indiana's counties compared to 77 for McCain.[21] However those 15 counties make up 44% of the state's population. Obama carried the state largely by trouncing McCain in Marion County, home to increasingly Democratic Indianapolis, by over 106,000 votes. Kerry narrowly won Marion County in 2004; prior to that it last supported a Democrat in 1964. Obama also won in Vigo County, home to Terre Haute and a noted bellwether; it has voted for the winner of every presidential election all but twice since 1892.[22] Not a single county voted more Republican in the 2008 election than in 2004.
Obama also dominated Gary and northwestern Indiana, traditionally the most Democratic region of the state. Many of the voters in this area already knew Obama, as this region makes up most of the Indiana side of the Chicago metropolitan area and the Chicago media market; Obama is from Chicago and has aired ads here for over a decade (dating to his tenure in the Illinois Senate). He also did very well in counties where colleges and universities are located, including St. Joseph (home to South Bend and Notre Dame), Vigo (home to Terre Haute and Indiana State University, Rose–Hulman Institute of Technology, and Saint Mary-of-the-Woods College) Monroe (home to Bloomington and IU), Delaware (home to Muncie and Ball State), Tippecanoe (home to West Lafayette and Purdue), and Porter (home to Valparaiso and Valparaiso University).[23]
McCain dominated Indianapolis's traditionally heavily Republican suburbs, although Obama reduced the Republican margin from past presidential elections.[24] McCain also did well in Southern Indiana. Obama only managed to win three counties in this region, one of which was Vanderburgh County, where the city of Evansville is located.
| County | Obama | Votes | McCain | Votes | Others | Votes | Total |
|---|---|---|---|---|---|---|---|
| Adams | 36.5% | 4,928 | 62.2% | 8,404 | 1.3% | 181 | 13,513 |
| Allen | 47.3% | 71,263 | 51.7% | 77,793 | 1.0% | 1,491 | 150,324 |
| Bartholomew | 43.7% | 13,567 | 55.0% | 17,067 | 1.3% | 409 | 31,043 |
| Benton | 41.0% | 1,563 | 57.2% | 2,183 | 1.8% | 68 | 3,814 |
| Blackford | 49.2% | 2,677 | 49.4% | 2,690 | 1.4% | 74 | 5,441 |
| Boone | 36.6% | 9,752 | 62.4% | 16,622 | 1.0% | 273 | 26,647 |
| Brown | 47.8% | 3,854 | 50.4% | 4,060 | 1.8% | 141 | 8,055 |
| Carroll | 42.8% | 3,736 | 55.6% | 4,858 | 1.6% | 142 | 8,736 |
| Cass | 44.8% | 7,011 | 53.3% | 8,346 | 1.9% | 296 | 15,653 |
| Clark | 46.0% | 21,953 | 53.1% | 25,326 | 0.9% | 446 | 47,725 |
| Clay | 43.5% | 4,954 | 55.0% | 6,267 | 1.5% | 174 | 11,395 |
| Clinton | 47.9% | 5,307 | 55.8% | 6,919 | 1.3% | 166 | 12,392 |
| Crawford | 48.2% | 2,286 | 50.4% | 2,393 | 1.4% | 65 | 4,744 |
| Daviess | 31.8% | 3,370 | 67.1% | 7,098 | 1.1% | 118 | 10,586 |
| Dearborn | 32.1% | 7,123 | 67.0% | 14,886 | 0.9% | 208 | 22,217 |
| Decatur | 37.1% | 3,892 | 61.5% | 6,449 | 1.4% | 147 | 10,488 |
| DeKalb | 41.9% | 7,175 | 57.0% | 9,780 | 1.1% | 194 | 17,149 |
| Delaware | 57.0% | 28,384 | 41.9% | 20,916 | 1.1% | 563 | 49,863 |
| Dubois | 47.1% | 8,748 | 51.3% | 9,526 | 1.6% | 291 | 18,565 |
| Elkhart | 44.0% | 31,398 | 55.1% | 39,396 | 0.9% | 664 | 71,458 |
| Fayette | 46.4% | 4,389 | 52.0% | 4,917 | 1.6% | 156 | 9,462 |
| Floyd | 44.5% | 16,263 | 54.6% | 19,957 | 0.9% | 317 | 36,537 |
| Fountain | 41.8% | 3,094 | 56.1% | 4,158 | 2.1% | 158 | 7,410 |
| Franklin | 32.1% | 3,404 | 66.1% | 7,018 | 1.8% | 188 | 10,610 |
| Fulton | 41.1% | 3,702 | 57.2% | 5,147 | 1.7% | 157 | 9,006 |
| Gibson | 42.8% | 6,455 | 55.9% | 8,449 | 1.3% | 191 | 15,095 |
| Grant | 43.0% | 11,293 | 56.0% | 14,734 | 1.0% | 272 | 26,299 |
| Greene | 41.9% | 5,709 | 56.4% | 7,691 | 1.7% | 229 | 13,629 |
| Hamilton | 38.6% | 49,704 | 60.7% | 78,401 | 0.7% | 959 | 129,064 |
| Hancock | 34.7% | 11,874 | 64.2% | 22,008 | 1.1% | 371 | 34,253 |
| Harrison | 40.3% | 7,288 | 58.3% | 10,551 | 1.4% | 252 | 18,091 |
| Hendricks | 37.8% | 24,548 | 61.2% | 39,728 | 1.0% | 679 | 64,955 |
| Henry | 47.2% | 10,059 | 51.1% | 10,896 | 1.7% | 364 | 21,319 |
| Howard | 46.3% | 17,871 | 52.4% | 20,248 | 1.3% | 505 | 38,624 |
| Huntington | 35.8% | 5,843 | 63.0% | 10,291 | 1.2% | 194 | 16,328 |
| Jackson | 42.3% | 7,354 | 56.0% | 9,726 | 1.7% | 294 | 17,374 |
| Jasper | 39.2% | 5,044 | 59.8% | 7,669 | 1.3% | 162 | 12,875 |
| Jay | 45.1% | 3,748 | 52.9% | 4,401 | 2.0% | 166 | 8,315 |
| Jefferson | 46.4% | 6,255 | 52.3% | 7,053 | 1.3% | 182 | 13,490 |
| Jennings | 44.9% | 5,312 | 52.9% | 6,261 | 2.2% | 266 | 11,839 |
| Johnson | 36.8% | 21,553 | 62.2% | 36,487 | 1.0% | 604 | 58,644 |
| Knox | 46.1% | 7,569 | 52.6% | 8,639 | 1.3% | 216 | 16,424 |
| Kosciusko | 30.6% | 9,236 | 68.0% | 20,488 | 1.4% | 410 | 30,134 |
| LaGrange | 38.6% | 3,663 | 60.1% | 5,702 | 1.3% | 126 | 9,491 |
| Lake | 66.7% | 139,301 | 32.5% | 67,742 | 0.8% | 1,714 | 208,757 |
| LaPorte | 60.2% | 28,258 | 38.2% | 17,918 | 1.6% | 743 | 46,919 |
| Lawrence | 38.9% | 7,208 | 59.4% | 11,018 | 1.7% | 308 | 18,534 |
| Madison | 52.6% | 30,152 | 46.0% | 26,403 | 1.4% | 785 | 57,340 |
| Marion | 63.8% | 241,987 | 35.4% | 134,313 | 0.8% | 3,062 | 379,362 |
| Marshall | 42.5% | 7,889 | 56.1% | 10,406 | 1.4% | 255 | 18,550 |
| Martin | 34.8% | 1,706 | 63.7% | 3,122 | 1.5% | 75 | 4,903 |
| Miami | 39.4% | 5,564 | 58.9% | 8,312 | 1.7% | 237 | 14,113 |
| Monroe | 65.6% | 41,450 | 33.4% | 21,118 | 1.0% | 647 | 63,215 |
| Montgomery | 39.3% | 6,013 | 59.3% | 9,060 | 1.4% | 212 | 15,285 |
| Morgan | 35.9% | 10,330 | 62.9% | 18,129 | 1.2% | 352 | 28,811 |
| Newton | 43.4% | 2,625 | 54.6% | 3,301 | 2.0% | 119 | 6,045 |
| Noble | 41.6% | 7,064 | 57.0% | 9,673 | 1.4% | 237 | 16,974 |
| Ohio | 39.7% | 1,158 | 58.7% | 1,713 | 1.6% | 47 | 2,918 |
| Orange | 41.9% | 3,390 | 56.1% | 4,536 | 2.0% | 160 | 8,086 |
| Owen | 43.7% | 3,570 | 54.0% | 4,415 | 2.3% | 185 | 8,170 |
| Parke | 42.0% | 2,924 | 56.1% | 3,909 | 1.9% | 131 | 6,964 |
| Perry | 60.6% | 5,141 | 37.7% | 3,202 | 1.7% | 147 | 8,490 |
| Pike | 44.8% | 2,700 | 53.4% | 3,221 | 1.8% | 107 | 6,028 |
| Porter | 53.0% | 39,178 | 45.8% | 33,857 | 1.2% | 881 | 73,916 |
| Posey | 45.6% | 5,828 | 53.3% | 6,804 | 1.1% | 139 | 12,771 |
| Pulaski | 41.3% | 2,466 | 56.8% | 3,388 | 1.8% | 110 | 5,964 |
| Putnam | 43.3% | 6,334 | 55.2% | 8,086 | 1.5% | 226 | 14,646 |
| Randolph | 44.8% | 4,839 | 53.5% | 5,788 | 1.7% | 181 | 10,808 |
| Ripley | 34.4% | 4,187 | 63.9% | 7,794 | 1.7% | 207 | 12,188 |
| Rush | 42.3% | 3,229 | 56.0% | 4,271 | 1.7% | 129 | 7,629 |
| St. Joseph | 58.0% | 68,710 | 41.0% | 48,510 | 1.0% | 1,169 | 118,389 |
| Scott | 48.1% | 4,271 | 50.1% | 4,445 | 1.8% | 161 | 8,877 |
| Shelby | 39.8% | 6,987 | 58.8% | 10,333 | 1.4% | 254 | 17,574 |
| Spencer | 49.5% | 5,039 | 49.1% | 5,001 | 1.4% | 141 | 10,181 |
| Starke | 50.5% | 4,778 | 47.2% | 4,473 | 2.3% | 215 | 9,466 |
| Steuben | 44.5% | 6,284 | 54.2% | 7,674 | 1.3% | 188 | 14,146 |
| Sullivan | 48.8% | 4,284 | 49.4% | 4,343 | 1.8% | 155 | 8,782 |
| Switzerland | 45.0% | 1,638 | 53.3% | 1,940 | 1.7% | 62 | 3,640 |
| Tippecanoe | 55.2% | 37,781 | 43.6% | 29,822 | 1.2% | 833 | 68,436 |
| Tipton | 41.5% | 3,250 | 56.9% | 4,452 | 1.6% | 125 | 7,827 |
| Union | 36.6% | 1,224 | 61.5% | 2,061 | 1.9% | 63 | 3,348 |
| Vanderburgh | 50.8% | 39,423 | 48.3% | 37,512 | 0.9% | 721 | 77,656 |
| Vermillion | 56.1% | 4,003 | 42.2% | 3,010 | 1.7% | 122 | 7,135 |
| Vigo | 57.3% | 25,040 | 41.5% | 18,121 | 1.2% | 545 | 43,706 |
| Wabash | 39.3% | 5,456 | 59.4% | 8,238 | 1.3% | 177 | 13,871 |
| Warren | 43.9% | 1,755 | 54.2% | 2,166 | 1.9% | 77 | 3,998 |
| Warrick | 43.0% | 12,329 | 55.9% | 16,013 | 1.1% | 323 | 28,665 |
| Washington | 40.4% | 4,562 | 57.6% | 6,519 | 2.0% | 224 | 11,305 |
| Wayne | 47.1% | 13,459 | 51.0% | 14,558 | 1.9% | 545 | 28,562 |
| Wells | 33.7% | 4,403 | 65.0% | 8,504 | 1.3% | 166 | 13,073 |
| White | 45.0% | 4,839 | 53.2% | 5,731 | 1.8% | 197 | 10,767 |
| Whitley | 38.6% | 5,862 | 60.1% | 9,124 | 1.3% | 202 | 15,188 |
By congressional district
Despite the fact that Barack Obama won the popular vote and carried the state’s 11 electoral votes, John McCain carried six congressional districts in Indiana, including all four held by Republicans and two held by Democrats.
| District | McCain | Obama | Representative |
|---|---|---|---|
| 1st | 37.38% | 61.76% | Pete Visclosky |
| 2nd | 44.72% | 54.10% | Joe Donnelly |
| 3rd | 56.22% | 42.84% | Mark Souder |
| 4th | 55.90% | 43.03% | Steve Buyer |
| 5th | 58.90% | 39.79% | Dan Burton |
| 6th | 52.46% | 46.18% | Mike Pence |
| 7th | 28.35% | 70.89% | André Carson |
| 8th | 51.30% | 47.41% | Brad Ellsworth |
| 9th | 49.70% | 49.06% | Baron Hill |
Electors
Technically the voters of Indiana cast their ballots for electors: representatives to the Electoral College. Indiana is allocated 11 electors because it has 9 congressional districts and 2 senators. All candidates who appear on the ballot or qualify to receive write-in votes must submit a list of 11 electors, who pledge to vote for their candidate and his or her running mate. Whoever wins the majority of votes in the state is awarded all 11 electoral votes. Their chosen electors then vote for President and Vice President. Although electors are pledged to their candidate and running mate, they are not obligated to vote for them.[25] An elector who votes for someone other than his or her candidate is known as a faithless elector.
The electors of each state and the District of Columbia met on December 15, 2008 to cast their votes for President and Vice President. The Electoral College itself never meets as one body. Instead the electors from each state and the District of Columbia met in their respective capitols.
The following were the members of the Electoral College from the state. All 11 were pledged to Barack Obama and Joe Biden:[26]
- Jeffrey L. Chidester
- Butch Morgan
- Michelle Boxell
- Charlotte Martin
- Jerry J. Lux
- Connie Southworth
- Alan P. Hogan
- Myrna E. Brown
- Clarence Benjamin Leatherbury
- Daniel J. Parker
- Cordelia Lewis Burks
References
- ↑ D.C.'s Political Report: The complete source for campaign summaries
- ↑ Presidential | The Cook Political Report Archived May 5, 2015, at the Wayback Machine.
- ↑ Adnaan (2008-09-20). "Track the Electoral College vote predictions". The Takeaway. Archived from the original on April 22, 2009. Retrieved 2009-11-14.
- ↑ Election Projection: 2008 Elections - Polls, Projections, Results
- ↑ Electoral-vote.com: President, Senate, House Updated Daily
- 1 2 3 4 Based on Takeaway
- ↑ POLITICO's 2008 Swing State Map - POLITICO.com
- ↑ RealClearPolitics - Electoral Map
- ↑ CQ Politics | CQ Presidential Election Maps, 2008 Archived June 14, 2009, at the Wayback Machine.
- ↑ "Electoral College Map". The New York Times. Retrieved 2010-05-26.
- ↑ "October – 2008 – CNN Political Ticker - CNN.com Blogs". CNN. Retrieved 2010-05-26.
- ↑ "Winning the Electoral College". Fox News. 2010-04-27.
- ↑ roadto270
- ↑ Election 2008: Electoral College Update - Rasmussen Reports™
- ↑ Election 2008 Polls - Dave Leip's Atlas of U.S. Presidential Elections
- ↑ Presidential Campaign Finance
- ↑ "Map: Campaign Ad Spending - Election Center 2008 from CNN.com". CNN. Retrieved 2010-05-26.
- ↑ "Map: Campaign Candidate Visits - Election Center 2008 from CNN.com". CNN. Retrieved 2010-05-26.
- ↑ 2004 election night timeline from Dave Leip's Presidential election atlas
- ↑ "Indiana General Election November 4, 2008, Statewide". Indiana Secretary of State. 2008-11-04. Retrieved 2008-11-07.
- ↑ "Indiana General Election November 4, 2008, by County". Indiana Secretary of State. 2008-11-04. Retrieved 2008-11-07.
- ↑ "Obama leads in bellwether Vigo Co.". Indianapolis Star. 2008-11-04. Retrieved 2008-11-12.
- ↑ "'At this defining moment, change has come to America'". Indianapolis Star. 2008-11-05. Retrieved 2008-11-05.
- ↑ "Obama gains in fast-growing counties". Politico. 2008-11-09. Retrieved 2008-11-10.
- ↑ "Electoral College". California Secretary of State. Archived from the original on October 30, 2008. Retrieved 2008-11-01.
- ↑ "Electoral College Information". Indiana Secretary of State Todd Rokita. Archived from the original on 2008-07-30. Retrieved 2008-12-15.