Tunbridge Wells (UK Parliament constituency)
| Tunbridge Wells | |
|---|---|
|
County constituency for the House of Commons | |
|
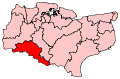
Boundary of Tunbridge Wells in Kent. | |
|
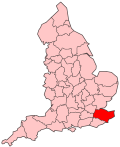
Location of Kent within England. | |
| County | Kent |
| Electorate | 73,028 (December 2010)[1] |
| Major settlements | Tunbridge Wells and Paddock Wood |
| Current constituency | |
| Created | 1974 |
| Member of parliament | Greg Clark (Conservative) |
| Number of members | One |
| Created from | Tonbridge and Ashford |
| Overlaps | |
| European Parliament constituency | South East England |
Tunbridge Wells is a constituency[n 1] represented in the House of Commons of the UK Parliament since 2005 by Greg Clark, a Conservative who has served as Secretary of State for Business, Energy and Industrial Strategy since 14 July 2016.[n 2]
Boundaries
1974-1983: The Municipal Borough of Royal Tunbridge Wells, the Urban District of Southborough, the Rural District of Cranbrook, and in the Rural District of Tonbridge the civil parishes of Bidborough, Brenchley, Capel, Horsmonden, Lamberhurst, Paddock Wood, Pembury, and Speldhurst.
1983-1997: The Borough of Tunbridge Wells.
1997-2010: The Borough of Tunbridge Wells wards of Brenchley, Capel, Culverdon, Goudhurst, Horsmonden, Lamberhurst, Paddock Wood, Pantiles, Park, Pembury, Rusthall, St James', St John's, St Mark's, Sherwood, Southborough East, Southborough North, Southborough West, and Speldhurst and Bidborough.
2010-present: The Borough of Tunbridge Wells wards of Brenchley and Horsmonden, Broadwater, Capel, Culverden, Goudhurst and Lamberhurst, Hawkhurst and Sandhurst, Paddock Wood East, Paddock Wood West, Pantiles and St Mark’s, Park, Pembury, Rusthall, St James', St John's, Sherwood, Southborough and High Brooms, Southborough North, and Speldhurst and Bidborough.
The constituency occupies rural and two largely spacious urban towns in Kent in south eastern England, covering the area of the Borough of Tunbridge Wells, the main town of which is also known as Royal Tunbridge Wells.
History
The constituency was created in 1974, and was originally named "Royal Tunbridge Wells". Except for Cranbrook Rural District (previously part of the Ashford constituency) the area had formed part of the constituency of Tonbridge prior to 1974. In 1983 the "Royal" prefix was removed from the seat's name.
- Political history
The seat's results since its 1974 creation indicate a Conservative safe seat. In 1994 the Conservative group on the council lost control but regained it in 1998.
- Prominent frontbenchers
In succession from 1983 until 1997 Patrick Mayhew reached three leading positions: Solicitor General for England and Wales, Attorney General for England and Wales and for Northern Ireland (simultaneously) and Secretary of State for Northern Ireland.
Archie Norman was the Shadow Secretary of State for Environment, Transport and the Regions (2002-2005).
The present member, Greg Clark, was Minister for Decentralisation from the start of the Cameron ministry and then two years later became Financial Secretary to the Treasury.
Constituency profile
The area is still largely rural in character and landscape, enjoying a gently elevated position which is traversed by the High Weald Landscape Trail. The area has local service sector and financial sector employers, light engineering combined with being substantially a commuter belt town for London and to an extent businesses on the southern side of the M25, such as in the Gatwick Diamond.
Workless claimants, registered jobseekers, were in November 2012 significantly lower than the national average of 3.8%, at 1.7% of the population based on a statistical compilation by The Guardian.[2]
Members of Parliament
| Election | Member[3] | Party | |
|---|---|---|---|
| Feb 1974 | Patrick Mayhew | Conservative | |
| 1997 | Archie Norman | Conservative | |
| 2005 | Greg Clark | Conservative | |
Elections
Elections in the 2010s
| Party | Candidate | Votes | % | ± | |
|---|---|---|---|---|---|
| Conservative | Greg Clark | 30,181 | 58.7 | +2.4 | |
| Labour | Kevin Kerrigan | 7,307 | 14.2 | +3.4 | |
| UKIP | Colin Nicholson[6] | 6,481 | 12.6 | +8.5 | |
| Liberal Democrat | James McCleary[7] (James MacCleary[8]) | 4,342 | 8.4 | −16.8 | |
| Green | Marie Jones | 2,659 | 5.2 | +3.4 | |
| Independent | Graham Naismith[9] | 458 | 0.9 | +0.9 | |
| Majority | 22,874 | 44.5 | |||
| Turnout | 51,428 | 70.0 | +0.2 | ||
| Conservative hold | Swing | -2.9 | |||
| Party | Candidate | Votes | % | ± | |
|---|---|---|---|---|---|
| Conservative | Greg Clark | 28,302 | 56.2 | +5.5 | |
| Liberal Democrat | David Hallas | 12,726 | 25.3 | +0 | |
| Labour | Gary Heather | 5,448 | 10.8 | −9.6 | |
| UKIP | Victor Webb | 2,054 | 4.1 | +0.6 | |
| Green | Hazel Dawe | 914 | 1.8 | +1.8 | |
| BNP | Andrew McBride[11] | 704 | 1.4 | +1.4 | |
| Independent | Farel Bradbury | 172 | 0.3 | +0.3 | |
| Majority | 15,576 | 31.0 | |||
| Turnout | 50,320 | 69.8 | +3.9 | ||
| Conservative hold | Swing | +2.8 | |||
Elections in the 2000s
| Party | Candidate | Votes | % | ± | |
|---|---|---|---|---|---|
| Conservative | Greg Clark | 21,083 | 49.6 | +0.7 | |
| Liberal Democrat | Laura Murphy | 11,095 | 26.1 | +1.4 | |
| Labour | Jacqui Jedrzejewski | 8,736 | 20.6 | −2.6 | |
| UKIP | Victor Webb | 1,568 | 3.7 | +0.4 | |
| Majority | 9,988 | 23.5 | |||
| Turnout | 42,482 | 65.7 | 3.4 | ||
| Conservative hold | Swing | +0.3 | |||
| Party | Candidate | Votes | % | ± | |
|---|---|---|---|---|---|
| Conservative | Archie Norman | 19,643 | 48.9 | +3.7 | |
| Liberal Democrat | Keith Brown | 9,913 | 24.7 | −5.0 | |
| Labour | Ian Carvell | 9,332 | 23.2 | +2.8 | |
| UKIP | Victor Webb | 1,313 | 3.3 | +2.7 | |
| Majority | 9,730 | 24.2 | |||
| Turnout | 40,201 | 62.3 | −11.8 | ||
| Conservative hold | Swing | ||||
Elections in the 1990s
| Party | Candidate | Votes | % | ± | |
|---|---|---|---|---|---|
| Conservative | Archie Norman | 21,853 | 45.19 | ||
| Liberal Democrat | Anthony S Clayton | 14,347 | 29.67 | ||
| Labour | Peter Warner | 9,879 | 20.43 | ||
| Referendum | Tim Macpherson | 1,858 | 3.84 | ||
| UKIP | M Smart | 264 | 0.55 | ||
| Natural Law | Paul Levy | 153 | 0.32 | ||
| Majority | 7,506 | 15.52 | |||
| Turnout | 74.10 | ||||
| Conservative hold | Swing | ||||
| Party | Candidate | Votes | % | ± | |
|---|---|---|---|---|---|
| Conservative | Sir Patrick Mayhew | 34,162 | 56.9 | −1.5 | |
| Liberal Democrat | AS Clayton | 17,030 | 28.4 | −1.6 | |
| Labour | EAC Goodman | 8,300 | 13.8 | +2.3 | |
| Natural Law | EW Fenna | 267 | 0.4 | N/A | |
| Independent | R Edey | 236 | 0.4 | N/A | |
| Majority | 17,132 | 28.6 | +0.1 | ||
| Turnout | 59,995 | 78.1 | +3.8 | ||
| Conservative hold | Swing | +0.0 | |||
Elections in the 1980s
| Party | Candidate | Votes | % | ± | |
|---|---|---|---|---|---|
| Conservative | Sir Patrick Mayhew | 33,111 | 58.44 | ||
| Liberal | DA Buckrell | 16,989 | 29,99 | ||
| Labour | PL Sloman | 6,555 | 11.57 | ||
| Majority | 16,122 | 28.46 | |||
| Turnout | 74.26 | ||||
| Conservative hold | Swing | ||||
| Party | Candidate | Votes | % | ± | |
|---|---|---|---|---|---|
| Conservative | Sir Patrick Mayhew | 31,199 | 58.26 | ||
| Liberal | P Blaine | 16,073 | 30.01 | ||
| Labour | SJ Casely | 6,042 | 11.28 | ||
| National Front | D Smith | 236 | 0.44 | ||
| Majority | 15,126 | 28.25 | |||
| Turnout | 72.66 | ||||
| Conservative hold | Swing | ||||
Elections in the 1970s
| Party | Candidate | Votes | % | ± | |
|---|---|---|---|---|---|
| Conservative | Sir Patrick Mayhew | 31,928 | 59.54 | ||
| Labour | AAJ Bartlett | 11,392 | 21.24 | ||
| Liberal | R Baker | 9,797 | 18.27 | ||
| National Front | W Standen | 509 | 0.95 | ||
| Majority | 20,536 | 38.29 | |||
| Turnout | 74.66 | ||||
| Conservative hold | Swing | ||||
| Party | Candidate | Votes | % | ± | |
|---|---|---|---|---|---|
| Conservative | Sir Patrick Mayhew | 24,829 | 49.53 | ||
| Liberal | DC Owens | 12,802 | 25.54 | ||
| Labour | RC Blackwell | 12,499 | 24.93 | ||
| Majority | 12,027 | 23.99 | |||
| Turnout | 72.51 | ||||
| Conservative hold | Swing | ||||
| Party | Candidate | Votes | % | ± | |
|---|---|---|---|---|---|
| Conservative | Sir Patrick Mayhew | 27,212 | 49.36 | ||
| Liberal | DC Owens | 16,184 | 29.36 | ||
| Labour | MF Short | 11,734 | 21.28 | ||
| Majority | 11,028 | 20.00 | |||
| Turnout | 80.38 | ||||
| Conservative hold | Swing | ||||
See also
Notes and references
- Notes
- ↑ A county constituency (for the purposes of election expenses and type of returning officer)
- ↑ As with all constituencies, the constituency elects one Member of Parliament (MP) by the first past the post system of election at least every five years.
- References
- ↑ "Electorate Figures - Boundary Commission for England". 2011 Electorate Figures. Boundary Commission for England. 4 March 2011. Retrieved 13 March 2011.
- ↑ Unemployment claimants by constituency The Guardian
- ↑ Leigh Rayment's Historical List of MPs – Constituencies beginning with "T" (part 2)
- ↑ "Election Data 2015". Electoral Calculus. Archived from the original on 17 October 2015. Retrieved 17 October 2015.
- ↑ "Tunbridge Wells". bbc.co.uk. Retrieved 13 September 2015.
- ↑ "UK Polling Report". ukpollingreport.co.uk. Retrieved 13 September 2015.
- ↑ http://www.libdems.org.uk/general_election_candidates#South East
- ↑ "James MacCleary". YourNextMP. Retrieved 13 September 2015.
- ↑ http://www.tunbridgewells.gov.uk/__data/assets/pdf_file/0006/88134/Statment-of-Persons-Nominated-Parliamentary-Election.pdf
- ↑ "Election Data 2010". Electoral Calculus. Archived from the original on 17 October 2015. Retrieved 17 October 2015.
- ↑ http://bnp.org.uk/2010/03/bnp%E2%80%99s-south-east-regional-organiser-to-contest-the-tunbridge-wells-seat/
- ↑ "Election Data 2005". Electoral Calculus. Archived from the original on 15 October 2011. Retrieved 18 October 2015.
- ↑ "Election Data 2001". Electoral Calculus. Archived from the original on 15 October 2011. Retrieved 18 October 2015.
- ↑ "Election Data 1997". Electoral Calculus. Archived from the original on 15 October 2011. Retrieved 18 October 2015.
- ↑ "Election Data 1992". Electoral Calculus. Archived from the original on 15 October 2011. Retrieved 18 October 2015.
- ↑ "Politics Resources". Election 1992. Politics Resources. 9 April 1992. Retrieved 2010-12-06.
- ↑ "Election Data 1987". Electoral Calculus. Archived from the original on 15 October 2011. Retrieved 18 October 2015.
- ↑ "Election Data 1983". Electoral Calculus. Archived from the original on 15 October 2011. Retrieved 18 October 2015.
Coordinates: 51°7′N 0°20′E / 51.117°N 0.333°E