Mole Valley (UK Parliament constituency)
Coordinates: 51°15′58″N 0°19′41″W / 51.266°N 0.328°W
| Mole Valley | |
|---|---|
|
County constituency for the House of Commons | |
|
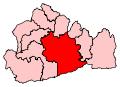
Boundary of Mole Valley in Surrey. | |
|
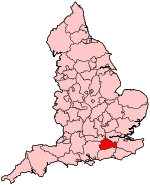
Location of Surrey within England. | |
| County | Surrey |
| Electorate | 72,568 (December 2010)[1] |
| Major settlements | Dorking, Leatherhead, Fetcham and Great Bookham |
| Current constituency | |
| Created | 1983 |
| Member of parliament | Sir Paul Beresford (Conservative) |
| Number of members | One |
| Created from | Dorking and Epsom & Ewell[2] |
| Overlaps | |
| European Parliament constituency | South East England |
Mole Valley is a constituency[n 1] represented in the House of Commons of the UK Parliament since 1997 by Sir Paul Beresford, a Conservative.[n 2]
Boundaries
1983-1997: The District of Mole Valley, and the Borough of Guildford ward of Tillingbourne.
1997-present: The District of Mole Valley wards of Beare Green, Bookham North, Bookham South, Box Hill and Headley, Brockham, Betchworth and Buckland, Capel, Leigh and Newdigate, Charlwood, Dorking North, Dorking South, Fetcham East, Fetcham West, Holmwoods, Leatherhead North, Leatherhead South, Leith Hill, Mickleham, Westhumble and Pixham, Okewood, and Westcott, and the Borough of Guildford wards of Clandon and Horsley, Effingham, Lovelace, Send, and Tillingbourne.
The constituency is larger than the Mole Valley district in Surrey as it includes five wards in the east of the Borough of Guildford, three of which are nearer to Woking than to Dorking. The largest town in the constituency is Dorking, second largest is Leatherhead and there are many rural and semi-rural villages, generally within one hour's reach of London so properly classed as part of the London Commuter Belt.
History and constituency profile
The constituency was created in 1983; much of the same area was covered by the Dorking constituency which preceded it. It is a Conservative safe seat, in particular having affluent middle-class commuter towns and villages for the vast London metropolis, it was one of a few seats to return a new candidate as Conservative MP who won a majority in excess of 10,000 in the 1997 Labour landslide; the main opposition since 1983 has been the Liberal Democrats and their largest predecessor party, the Liberal Party.
Members of Parliament
| Election | Member[3] | Party | |
|---|---|---|---|
| 1983 | Kenneth Baker | Conservative | |
| 1997 | Sir Paul Beresford | Conservative | |
Elections
Elections in the 2010s
| Party | Candidate | Votes | % | ± | |
|---|---|---|---|---|---|
| Conservative | Paul Beresford[5] | 33,434 | 60.6 | +3.1 | |
| Liberal Democrat | Paul Kennedy | 7,981 | 14.5 | −14.3 | |
| UKIP | Paul Oakley[6] | 6,181 | 11.2 | +6.1 | |
| Labour | Leonard Amos[7] | 4,565 | 8.3 | +1.3 | |
| Green | Jacquetta Fewster[8] | 2,979 | 5.4 | +3.8 | |
| Majority | 25,453 | 46.1 | |||
| Turnout | 55,329 | 74.2 | −0.6 | ||
| Conservative hold | Swing | +8.7 | |||
| Party | Candidate | Votes | % | ± | |
|---|---|---|---|---|---|
| Conservative | Paul Beresford | 31,263 | 57.5 | +2.8 | |
| Liberal Democrat | Alice Humphreys | 15,610 | 28.7 | −1.7 | |
| Labour | James Dove | 3,804 | 7.0 | −3.7 | |
| UKIP | Leigh Jones | 2,752 | 5.1 | +2.1 | |
| Green | Rob Sedgwick | 895 | 1.6 | +1.6 | |
| Majority | 15,653 | 28.8 | |||
| Turnout | 54,324 | 74.8 | +3.4 | ||
| Conservative hold | Swing | +2.3 | |||
Elections in the 2000s
| Party | Candidate | Votes | % | ± | |
|---|---|---|---|---|---|
| Conservative | Paul Beresford | 27,060 | 54.8 | +4.3 | |
| Liberal Democrat | Nasser Butt | 15,063 | 30.5 | +1.5 | |
| Labour | Farmida Bi | 5,310 | 10.7 | −5.9 | |
| UKIP | David Payne | 1,475 | 3.0 | +0.2 | |
| Veritas | Roger Meekins | 507 | 1.0 | N/A | |
| Majority | 11,997 | 24.3 | |||
| Turnout | 49,415 | 72.5 | +3.6 | ||
| Conservative hold | Swing | +1.4 | |||
| Party | Candidate | Votes | % | ± | |
|---|---|---|---|---|---|
| Conservative | Paul Beresford | 23,790 | 50.5 | +2.5 | |
| Liberal Democrat | Celia Elizabeth Savage | 13,637 | 29.0 | −0.3 | |
| Labour | Dan Redford | 7,837 | 16.6 | +1.9 | |
| UKIP | Ronald Walters | 1,333 | 2.8 | +2.0 | |
| ProLife Alliance | William Newton | 475 | 1.0 | N/A | |
| Majority | 10,153 | 21.5 | |||
| Turnout | 47,072 | 68.9 | -9.5 | ||
| Conservative hold | Swing | +1.4 | |||
Elections in the 1990s
This constituency underwent boundary changes between the 1992 and 1997 general elections and thus change in share of vote is based on a notional calculation.
| Party | Candidate | Votes | % | ± | |
|---|---|---|---|---|---|
| Conservative | Paul Beresford | 26,178 | 48.0 | −13.3 | |
| Liberal Democrat | Stephen Cooksey | 15,957 | 29.3 | +0.6 | |
| Labour | Christopher Payne | 8,057 | 14.8 | +5.4 | |
| Referendum | Nick Taber | 2,424 | 4.4 | N/A | |
| Independent Conservative | Richard Burley | 1,276 | 2.3 | N/A | |
| UKIP | Ian Cameron | 435 | 0.8 | N/A | |
| Natural Law | Judith Thomas | 197 | 0.4 | −0.4 | |
| Majority | 10,221 | 18.7 | |||
| Turnout | 54,524 | 78.4 | −3.6 | ||
| Conservative hold | Swing | −6.9 | |||
| Party | Candidate | Votes | % | ± | |
|---|---|---|---|---|---|
| Conservative | Kenneth Wilfred Baker | 32,549 | 59.3 | −1.5 | |
| Liberal Democrat | Michael Watson | 16,599 | 30.3 | +0.4 | |
| Labour | Tim Walsh | 5,291 | 9.6 | +0.3 | |
| Natural Law | Judith Thomas | 442 | 0.8 | N/A | |
| Majority | 15,950 | 29.0 | −1.9 | ||
| Turnout | 54,881 | 82.0 | +5.0 | ||
| Conservative hold | Swing | −0.9 | |||
Elections in the 1980s
| Party | Candidate | Votes | % | ± | |
|---|---|---|---|---|---|
| Conservative | Kenneth Wilfred Baker | 31,689 | 60.8 | 0.0 | |
| Liberal | Susan Petronella Thomas | 15,613 | 29.9 | −0.8 | |
| Labour | Christopher King | 4,846 | 9.3 | +0.8 | |
| Majority | 16,076 | 30.9 | |||
| Turnout | 52,148 | 77.0 | +2.0 | ||
| Conservative hold | Swing | +0.4 | |||
| Party | Candidate | Votes | % | ± | |
|---|---|---|---|---|---|
| Conservative | Kenneth Wilfred Baker | 29,691 | 60.8 | N/A | |
| Liberal | Susan Petronella Thomas | 14,973 | 30.7 | N/A | |
| Labour | Fanny Lines | 4,147 | 8.5 | N/A | |
| Majority | 14,718 | 30.1 | N/A | ||
| Turnout | 48,811 | 75.0 | N/A | ||
| Conservative win (new seat) | |||||
See also
Notes
- ↑ A county constituency (for the purposes of election expenses and type of returning officer)
- ↑ As with all constituencies, the constituency elects one Member of Parliament (MP) by the first past the post system of election at least every five years.
References
- ↑ "Electorate Figures - Boundary Commission for England". 2011 Electorate Figures. Boundary Commission for England. 4 March 2011. Retrieved 13 March 2011.
- ↑ "'Mole Valley', June 1983 up to May 1997". ElectionWeb Project. Cognitive Computing Limited. Retrieved 13 March 2016.
- ↑ Leigh Rayment's Historical List of MPs – Constituencies beginning with "M" (part 3)
- ↑ "Election Data 2015". Electoral Calculus. Archived from the original on 17 October 2015. Retrieved 17 October 2015.
- ↑ http://electionresults.blogspot.co.uk/2013/05/mole-valley-2015.html
- ↑ http://ukpollingreport.co.uk/2015guide/molevalley/
- ↑ "Leonard Amos PPC page". Labour Party (UK). Retrieved 13 February 2015.
- ↑ http://surrey.greenparty.org.uk/mole-valley-green-party/
- ↑ "Election Data 2010". Electoral Calculus. Archived from the original on 17 October 2015. Retrieved 17 October 2015.
- ↑ "Election Data 2005". Electoral Calculus. Archived from the original on 15 October 2011. Retrieved 18 October 2015.
- ↑ "Election Data 2001". Electoral Calculus. Archived from the original on 15 October 2011. Retrieved 18 October 2015.
- ↑ "Election Data 1997". Electoral Calculus. Archived from the original on 15 October 2011. Retrieved 18 October 2015.
- ↑ "Election Data 1992". Electoral Calculus. Archived from the original on 15 October 2011. Retrieved 18 October 2015.
- ↑ "Politics Resources". Election 1992. Politics Resources. 9 April 1992. Retrieved 6 Dec 2010.
- ↑ "Election Data 1987". Electoral Calculus. Archived from the original on 15 October 2011. Retrieved 18 October 2015.
- ↑ "Election Data 1983". Electoral Calculus. Archived from the original on 15 October 2011. Retrieved 18 October 2015.
Bibliography
- Election result, 2010 (BBC)
- Election result, 2005 (BBC)
- Election results, 1997 - 2001 (BBC)
- Election results, 1997 - 2001 (Election Demon)
- Election results, 1983 - 1992 (Election Demon)
- Election results, 1992 - 2010 (Guardian)
- Election result, 2010 (UKPollingReport)