Henley (UK Parliament constituency)
| Henley | |
|---|---|
|
County constituency for the House of Commons | |
|
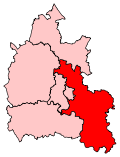
Boundary of Henley in Oxfordshire. | |
|
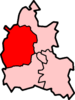
Location of Oxfordshire within England. | |
| County | Oxfordshire |
| Electorate | 73,851 (December 2010)[1] |
| Major settlements | Henley, Thame and Chinnor |
| Current constituency | |
| Created | 1885 |
| Member of parliament | John Howell (Conservative) |
| Number of members | One |
| Overlaps | |
| European Parliament constituency | South East England |

Henley is a constituency[n 1] in Oxfordshire represented in the House of Commons of the UK Parliament since 2008 by John Howell, a Conservative.[n 2]
Constituency profile
The area has since 1910 been a Conservative safe seat, making it one of the longest held seats by the party's candidates in the country.
Boundaries
1885-1918: The Municipal Borough of Henley-on-Thames, the Sessional Divisions of Henley and Wallington, part of the Sessional Division of Bullingdon, and the part of the Municipal Borough of Abingdon in the county of Oxfordshire.
1918-1950: The Municipal Borough of Henley-on-Thames, the Urban Districts of Bicester, Thame, and Wheatley, and the Rural Districts of Bicester, Crowmarsh, Culhain, Goring, Headington, Henley, and Thame.
1950-1974: The Municipal Borough of Henley-on-Thames, the Urban Districts of Bicester and Thame, the Rural Districts of Bullingdon and Henley, and part of the Rural District of Ploughley.
1974-1983: The Municipal Borough of Henley-on-Thames, the Urban District of Thame, the Rural District of Henley, and part of the Rural District of Bullingdon.
1983-1997: The District of South Oxfordshire wards of Aston Rowant, Benson, Berinsfield, Chalgrove, Chinnor, Clifton Hampden, Crowmarsh, Dorchester, Forest Hill, Garsington, Goring, Goring Heath, Great Milton, Henley, Kidmore End, Nettlebed, Rotherfield Peppard, Shiplake, Sonning Common, Thame North, Thame South, Watlington, Wheatley, and Woodcote.
1997-2010: The District of South Oxfordshire wards of Aston Rowant, Benson, Berinsfield, Chalgrove, Chinnor, Clifton Hampden, Crowmarsh, Dorchester, Forest Hill, Garsington, Goring, Goring Heath, Great Milton, Henley, Horspath, Kidmore End, Nettlebed, Rotherfield Peppard, Shiplake, Sonning Common, Thame North, Thame South, Watlington, Wheatley, and Woodcote.
2010–present: The District of South Oxfordshire wards of Aston Rowant, Benson, Berinsfield, Chalgrove, Chiltern Woods, Chinnor, Crowmarsh, Forest Hill and Holton, Garsington, Goring, Great Milton, Henley North, Henley South, Sandford, Shiplake, Sonning Common, Thame North, Thame South, Watlington, Wheatley, and Woodcote, and the District of Cherwell wards of Kirtlington and Otmoor.
The constituency covers most of the local government district of South Oxfordshire, excluding the Wallingford and Didcot areas in the west of the district. Main settlements in the South Oxfordshire part of the constituency include Henley-on-Thames itself, Thame, Chinnor and Sonning Common. The two wards of Cherwell that are included in the seat are located to the north of South Oxfordshire and are predominantly rural.
History
The best-known past Members of Parliament were Michael Heseltine and Boris Johnson.
Henley has been a safe Conservative seat for several decades. The high-profile former cabinet minister Michael Heseltine served as its MP for over 25 years. Heseltine was succeeded by the equally high-profile Boris Johnson in 2001. In May 2008, Johnson was elected as Mayor of London, and he subsequently resigned from the Commons on 4 June 2008,[2] resulting in a by-election in the constituency, which was won by John Howell. Howell was re-elected at the General Election in 2010 and again in 2015 with a massively increased majority.
Johnson returned to Parliament in 2015, as MP for the London seat of Uxbridge and South Ruislip, and since 2016 has been Foreign Secretary in the Cabinet of Prime Minister Theresa May.
Members of Parliament

| Election | Member[3] | Party | Notes | |
|---|---|---|---|---|
| 1885 | Edward William Harcourt | Conservative | ||
| 1886 | Francis Parker | Conservative | ||
| 1895 | Robert Hodge | Conservative | Became Sir Robert Hodge, Baronet in 1902, assumed surname Hermon-Hodge in 1903 | |
| 1906 | Philip Morrell | Liberal | ||
| 1910 | Valentine Fleming | Conservative | Killed in World War I, father of James Bond novelist Ian Fleming. | |
| 1917 by-election | Sir Robert Hermon-Hodge, Bt. | Conservative | ||
| 1918 | Reginald Terrell | Coalition Conservative | ||
| 1922 | Conservative | |||
| 1924 | Robert Henderson | Conservative | ||
| 1932 by-election | Gifford Fox | Conservative | ||
| 1950 | John Hay | Conservative | ||
| Feb 1974 | Michael Heseltine | Conservative | Later Baron Heseltine; Cabinet minister 1979-86 and 1990–97 | |
| 2001 | Boris Johnson | Conservative | Elected Mayor of London May 2008 | |
| 2008 by-election | John Howell | Conservative | ||
Elections
Elections in the 2010s
| Party | Candidate | Votes | % | ± | |
|---|---|---|---|---|---|
| Conservative | John Howell[5] | 32,292 | 58.5 | +2.3 | |
| Labour | Sam Juthani[6] | 6,917 | 12.5 | +1.6 | |
| Liberal Democrat | Sue Cooper[7] | 6,205 | 11.2 | -13.9 | |
| UKIP | Christopher Jones[8] | 6,007 | 10.9 | +7.5 | |
| Green | Mark Stevenson[9] | 3,815 | 6.9 | +4.4 | |
| Majority | 25,375 | 45.9 | |||
| Turnout | 55,236 | 70.9 | -0.5 | ||
| Conservative hold | Swing | +14.9 | |||
| Party | Candidate | Votes | % | ± | |
|---|---|---|---|---|---|
| Conservative | John Howell | 30,054 | 56.2 | +3.0 | |
| Liberal Democrat | Andy Crick | 13,466 | 25.2 | −0.9 | |
| Labour | Richard McKenzie | 5,835 | 10.9 | −4.1 | |
| UKIP | Laurence Hughes | 1,817 | 3.4 | +0.9 | |
| Green | Mark Stevenson | 1,328 | 2.5 | −0.8 | |
| BNP | John Bews | 1,020 | 1.9 | −1.7 | |
| Majority | 16,588 | 31.0 | |||
| Turnout | 53,520 | 71.4 | +3.6 | ||
| Conservative hold | Swing | +1.9 | |||
Elections in the 2000s
| Party | Candidate | Votes | % | ± | |
|---|---|---|---|---|---|
| Conservative | John Howell | 19,796 | 56.9 | +3.4 | |
| Liberal Democrat | Stephen Kearney | 9,680 | 27.8 | +1.8 | |
| Green | Mark Stevenson | 1,321 | 3.8 | +0.5 | |
| BNP | Tim Rait | 1,243 | 3.6 | N/A | |
| Labour | Richard McKenzie | 1,066 | 3.1 | −11.6 | |
| UKIP | Chris Adams | 843 | 2.4 | −0.1 | |
| Monster Raving Loony | Bananaman Owen | 242 | 0.7 | N/A | |
| English Democrat | Derek Allpass | 157 | 0.4 | N/A | |
| Independent | Amanda Harrington | 128 | 0.4 | N/A | |
| Common Good | Dick Rodgers | 121 | 0.3 | N/A | |
| Independent | Louise Cole | 91 | 0.3 | N/A | |
| Fur Play Party | Harry Bear | 73 | 0.2 | N/A | |
| Majority | 10,116 | 29.1 | +1.6 | ||
| Turnout | 34,761 | 50.5 | −17.4 | ||
| Conservative hold | Swing | +0.8 | |||
| Party | Candidate | Votes | % | ± | |
|---|---|---|---|---|---|
| Conservative | Boris Johnson | 24,894 | 53.5 | +7.4 | |
| Liberal Democrat | David Turner | 12,101 | 26.0 | −1.0 | |
| Labour | Kaleem Saeed | 6,862 | 14.7 | −6.4 | |
| Green | Mark Stevenson | 1,518 | 3.3 | +0.7 | |
| UKIP | Delphine Gray-Fisk | 1,162 | 2.5 | −0.7 | |
| Majority | 12,793 | 27.5 | |||
| Turnout | 46,537 | 67.9 | +3.6 | ||
| Conservative hold | Swing | +4.2 | |||
| Party | Candidate | Votes | % | ± | |
|---|---|---|---|---|---|
| Conservative | Boris Johnson | 20,466 | 46.1 | −0.3 | |
| Liberal Democrat | Catherine Bearder | 12,008 | 27.0 | +2.3 | |
| Labour | Janet Matthews | 9,367 | 21.1 | –1.6 | |
| UKIP | Philip Collings | 1,413 | 3.2 | N/A | |
| Green | Oliver Tickell | 1,147 | 2.6 | +1.6 | |
| Majority | 8,458 | 19.1 | |||
| Turnout | 44,401 | 64.3 | −13.3 | ||
| Conservative hold | Swing | −1.3 | |||
Elections in the 1990s
| Party | Candidate | Votes | % | ± | |
|---|---|---|---|---|---|
| Conservative | Michael Heseltine | 23,908 | 46.4 | −13.3 | |
| Liberal Democrat | Tim Horton | 12,741 | 24.7 | +0.6 | |
| Labour | Duncan Enright | 12,700 | 22.7 | +7.8 | |
| Referendum | Sebastian Sainsbury | 2,299 | 4.5 | N/A | |
| Green | Mrs Susan Miles | 514 | 1.0 | N/A | |
| Natural Law | Nigel Barlow | 221 | 0.4 | –0.1 | |
| Whig Party | Thomas Hibbert | 160 | 0.3 | N/A | |
| Majority | 11,167 | 21.7 | −13.9 | ||
| Turnout | 52,543 | 77.6 | −2.2 | ||
| Conservative hold | Swing | ||||
| Party | Candidate | Votes | % | ± | |
|---|---|---|---|---|---|
| Conservative | Michael Heseltine | 30,835 | 59.7 | −1.4 | |
| Liberal Democrat | David G. Turner | 12,443 | 24.1 | −2.2 | |
| Labour | Ivan J. Russell-Swinnerton | 7,676 | 14.9 | +2.3 | |
| Independent | Alan S. Plane | 431 | 0.8 | +0.8 | |
| Natural Law | Ms. Sara A. Banerji | 274 | 0.5 | +0.5 | |
| Majority | 18,392 | 35.6 | +0.8 | ||
| Turnout | 51,659 | 79.8 | +4.9 | ||
| Conservative hold | Swing | +0.4 | |||
Elections in the 1980s
| Party | Candidate | Votes | % | ± | |
|---|---|---|---|---|---|
| Conservative | Michael Heseltine | 29,978 | 61.1 | ||
| Liberal | John Madeley | 12,896 | 26.3 | ||
| Labour | Michael Bayldon Barber | 6,173 | 12.6 | ||
| Majority | 17,082 | 34.8 | |||
| Turnout | 75.0 | ||||
| Conservative hold | Swing | ||||
| Party | Candidate | Votes | % | ± | |
|---|---|---|---|---|---|
| Conservative | Michael Heseltine | 27,039 | 59.7 | ||
| Liberal | I. Brook | 13,258 | 29.3 | ||
| Labour | I. Roxburgh | 4,282 | 9.5 | ||
| Women for Life On Earth | R. Johnson | 517 | 1.1 | N/A | |
| One Nation Conservative | T. Rogers | 213 | 0.5 | N/A | |
| Majority | 13,781 | 30.4 | |||
| Turnout | 72.9 | ||||
| Conservative hold | Swing | ||||
Elections in the 1970s
| Party | Candidate | Votes | % | ± | |
|---|---|---|---|---|---|
| Conservative | Michael Heseltine | 29,982 | 58.7 | ||
| Liberal | Steve Atack | 11,693 | 22.9 | ||
| Labour | D. J. Whiting | 9,435 | 18.5 | ||
| Majority | 18,289 | 35.8 | |||
| Turnout | 77.5 | ||||
| Conservative hold | Swing | ||||
| Party | Candidate | Votes | % | ± | |
|---|---|---|---|---|---|
| Conservative | Michael Heseltine | 22,504 | 49.0 | ||
| Liberal | S. R. C. Evans | 12,288 | 26.8 | ||
| Labour | I. M. Haig | 11,141 | 24.3 | ||
| Majority | 10,216 | 22.2 | |||
| Turnout | 73.5 | ||||
| Conservative hold | Swing | ||||
| Party | Candidate | Votes | % | ± | |
|---|---|---|---|---|---|
| Conservative | Michael Heseltine | 24,367 | 48.4 | ||
| Liberal | S. R. C. Evans | 15,467 | 30.7 | ||
| Labour | A. Alexander | 10,500 | 20.9 | ||
| Majority | 8,900 | 17.7 | |||
| Turnout | 81.3 | ||||
| Conservative hold | Swing | ||||
| Party | Candidate | Votes | % | ± | |
|---|---|---|---|---|---|
| Conservative | John Albert Hay | 33,452 | 53.4 | ||
| Labour | Maeve Judith Denby | 19,310 | 30.8 | ||
| Liberal | Arthur William Giles | 8,907 | 14.2 | N/A | |
| Anti-Common Market | Daniel Brunner | 960 | 1.5 | N/A | |
| Majority | 14,142 | 22.6 | |||
| Turnout | 74.0 | ||||
| Conservative hold | Swing | ||||
Elections in the 1960s
| Party | Candidate | Votes | % | ± | |
|---|---|---|---|---|---|
| Conservative | John Albert Hay | 28,994 | 55.4 | ||
| Labour | George Cunningham | 23,320 | 44.6 | ||
| Majority | 5,674 | 10.9 | |||
| Turnout | 75.2 | ||||
| Conservative hold | Swing | ||||
| Party | Candidate | Votes | % | ± | |
|---|---|---|---|---|---|
| Conservative | John Albert Hay | 24,898 | 49.2 | ||
| Labour | Arthur Ledger | 16,614 | 32.8 | ||
| Liberal | Arthur William Giles | 9,081 | 18.0 | ||
| Majority | 8,284 | 16.4 | |||
| Turnout | 78.3 | ||||
| Conservative hold | Swing | ||||
Elections in the 1950s
| Party | Candidate | Votes | % | ± | |
|---|---|---|---|---|---|
| Conservative | John Albert Hay | 24,417 | 53.4 | ||
| Labour | Arthur Ledger | 15,014 | 32.9 | ||
| Liberal | Charles Truman | 6,261 | 13.7 | N/A | |
| Majority | 9,403 | 20.6 | |||
| Turnout | 78.4 | ||||
| Conservative hold | Swing | ||||
| Party | Candidate | Votes | % | ± | |
|---|---|---|---|---|---|
| Conservative | John Albert Hay | 24,061 | 58.6 | ||
| Labour | Miss Nora J T Wiles | 16,980 | 41.4 | ||
| Majority | 7,081 | 17.3 | |||
| Turnout | 75.4 | ||||
| Conservative hold | Swing | ||||
| Party | Candidate | Votes | % | ± | |
|---|---|---|---|---|---|
| Conservative | John Albert Hay | 23,621 | 58.0 | ||
| Labour | Constantine Gallop | 17,090 | 42.0 | ||
| Majority | 6,531 | 16.0 | |||
| Turnout | 78.3 | ||||
| Conservative hold | Swing | ||||
| Party | Candidate | Votes | % | ± | |
|---|---|---|---|---|---|
| Conservative | John Albert Hay | 20,488 | 49.4 | ||
| Labour | Alan Ernest Gwynn Hawkins | 14,709 | 35.5 | ||
| Liberal | Peter William Vincent Minoprio | 6,255 | 15.1 | ||
| Majority | 5,779 | 13.9 | |||
| Turnout | 81.7 | ||||
| Conservative hold | Swing | ||||
Elections in the 1940s
| Party | Candidate | Votes | % | ± | |
|---|---|---|---|---|---|
| Conservative | Sir Gifford Wheaton Grey Fox | 22,286 | 42.5 | ||
| Labour | James Stewart Cook | 19,457 | 37.1 | ||
| Liberal | Lionel Gordon Baliol Brett | 10,718 | 20.4 | ||
| Majority | 2,829 | 5.4 | |||
| Turnout | 66.3 | ||||
| Conservative hold | Swing | ||||
Elections in the 1930s
| Party | Candidate | Votes | % | ± | |
|---|---|---|---|---|---|
| Conservative | Sir Gifford Wheaton Grey Fox | 22,024 | 70.4 | ||
| Liberal | John Herbert May | 9,254 | 29.6 | ||
| Majority | 12,770 | 40.8 | |||
| Turnout | 31,278 | 56.9 | |||
| Conservative hold | Swing | ||||
| Party | Candidate | Votes | % | ± | |
|---|---|---|---|---|---|
| Conservative | Sir Gifford Wheaton Grey Fox | 16,553 | 69.9 | -2.3 | |
| Liberal | Richard Borlase Matthews | 7,129 | 30.1 | +13.8 | |
| Majority | 9,424 | 39.8 | -16.1 | ||
| Turnout | 23,682 | 48.9 | -19.7 | ||
| Conservative hold | Swing | ||||
| Party | Candidate | Votes | % | ± | |
|---|---|---|---|---|---|
| Conservative | Robert Ronald Henderson | 24,015 | 72.2 | ||
| Liberal | Richard Borlase Matthews | 5,411 | 16.3 | ||
| Labour | Frederick J Hembury | 3,809 | 11.5 | ||
| Majority | 18,604 | 55.9 | |||
| Turnout | 33,235 | 68.6 | |||
| Conservative hold | Swing | ||||
Elections in the 1920s
| Party | Candidate | Votes | % | ± | |
|---|---|---|---|---|---|
| Unionist | Robert Ronald Henderson | 16,943 | 51.9 | -12.9 | |
| Liberal | Sir Geoffrey Ernest Tritton | 9,786 | 29.9 | +5.3 | |
| Labour | Bernard Benjamin Gillis | 5,962 | 18.2 | n/a | |
| Majority | 7,157 | 22.0 | -18.2 | ||
| Turnout | 32,631 | 73.3 | +3.1 | ||
| Unionist hold | Swing | -9.1 | |||
| Party | Candidate | Votes | % | ± | |
|---|---|---|---|---|---|
| Conservative | Robert Ronald Henderson | 14,830 | 64.8 | ||
| Liberal | Charles Alan Bennett | 8,060 | 35.2 | ||
| Majority | 6,770 | 29.6 | |||
| Turnout | 22,890 | 70.2 | |||
| Conservative hold | Swing | ||||

| Party | Candidate | Votes | % | ± | |
|---|---|---|---|---|---|
| Unionist | Thomas Antonio Reginald Terrell | 12,092 | 51.8 | -1.3 | |
| Liberal | Sir Robert Henry Rew | 11,266 | 48.2 | +1.3 | |
| Majority | 826 | 3.6 | -2.6 | ||
| Turnout | 23,358 | 73.3 | +3.7 | ||
| Unionist hold | Swing | -1.3 | |||
| Party | Candidate | Votes | % | ± | |
|---|---|---|---|---|---|
| Unionist | Thomas Antonio Reginald Terrell | 11,545 | 53.1 | ||
| Liberal | Sir Robert Henry Rew | 10,204 | 46.9 | ||
| Majority | 1,341 | 6.2 | |||
| Turnout | 21,749 | 69.6 | |||
| Unionist hold | Swing | ||||
Elections in the 1910s
| Party | Candidate | Votes | % | ± | |
|---|---|---|---|---|---|
| Unionist | 10,757 | 67.7 | |||
| Liberal | Edmund Loftus MacNaghten | 5,138 | 32.3 | ||
| Majority | 5,619 | 35.4 | |||
| Turnout | 15,895 | 52.2 | |||
| Conservative hold | Swing | ||||
Neighbouring constituencies
 |
Banbury | | ||
| Oxford West and Abingdon Oxford East Wantage |
|
Buckingham Aylesbury Wycombe Maidenhead | ||
| ||||
| | ||||
| Reading West, Reading East |
See also
- List of Parliamentary constituencies in Oxfordshire
- Banbury
- Oxford East
- Oxford West and Abingdon
- Wantage
- Witney
Notes and references
- Notes
- ↑ A county constituency (for the purposes of election expenses and type of returning officer)
- ↑ As with all constituencies, the constituency elects one Member of Parliament (MP) by the first past the post system of election at least every five years.
- References
- ↑ "Electorate Figures - Boundary Commission for England". 2011 Electorate Figures. Boundary Commission for England. 4 March 2011. Retrieved 13 March 2011.
- ↑ Treasury press release Manor of Northstead
- ↑ Leigh Rayment's Historical List of MPs – Constituencies beginning with "H" (part 2)
- ↑ "Election Data 2015". Electoral Calculus. Archived from the original on 17 October 2015. Retrieved 17 October 2015.
- ↑ http://electionresults.blogspot.co.uk/2013/04/henley-2015.html
- ↑ http://www.samjuthaniforhenley.org.uk
- ↑ "Sue Cooper PPC page". Liberal Democrats. Retrieved 22 February 2015.
- ↑ "constituencies". UKIP South East. Retrieved 5 February 2015.
- ↑ http://www.greenoxfordshire.com/mark_stevenson_for_henley
- ↑ "Election Data 2010". Electoral Calculus. Archived from the original on 17 October 2015. Retrieved 17 October 2015.
- ↑ "BBC NEWS – Election 2010 – Henley". BBC News.
- ↑ ukpollingreport
- ↑ "Election Data 2005". Electoral Calculus. Archived from the original on 15 October 2011. Retrieved 18 October 2015.
- 1 2 3 Ask Aristotle: Henley, guardian.co.uk
- ↑ "Election Data 2001". Electoral Calculus. Archived from the original on 15 October 2011. Retrieved 18 October 2015.
- ↑ "Election Data 1997". Electoral Calculus. Archived from the original on 15 October 2011. Retrieved 18 October 2015.
- ↑ "Election Data 1992". Electoral Calculus. Archived from the original on 15 October 2011. Retrieved 18 October 2015.
- ↑ "Politics Resources". Election 1992. Politics Resources. 9 April 1992. Retrieved 2010-12-06.
- ↑ "Election Data 1987". Electoral Calculus. Archived from the original on 15 October 2011. Retrieved 18 October 2015.
- ↑ UK General Election results June 1987
- ↑ "Election Data 1983". Electoral Calculus. Archived from the original on 15 October 2011. Retrieved 18 October 2015.
- ↑ UK General Election results June 1983
- ↑ UK General Election results May 1979
- ↑ UK General Election results October 1974
- ↑ UK General Election results February 1974
- ↑ UK General Election results 1970
- ↑ UK General Election results March 1966
- ↑ UK General Election results October 1964
- ↑ UK General Election results October 1959
- ↑ UK General Election results May 1955
- ↑ UK General Election results October 1951
- ↑ UK General Election results February 1950
- ↑ UK General Election results July 1945
- 1 2 3 4 5 6 7 8 F. W. S. Craig, British Parliamentary Election Results 1918 - 1949
Sources
- Iain Dale, ed. (2003). The Times House of Commons 1929, 1931, 1935. Politico's (reprint). ISBN 1-84275-033-X.
- The Times House of Commons 1945. The Times. 1945.
- The Times House of Commons 1950. The Times. 1950.
- The Times House of Commons 1955. The Times. 1955.

Coordinates: 51°39′N 1°03′W / 51.65°N 1.05°W