Wycombe is a constituency[n 1] represented in the House of Commons of the UK Parliament since 2010 by Steve Baker, a Conservative.[n 2]
History
Wycombe has continuously returned MPs since the Model Parliament of 1295. As a parliamentary borough (often referred to as High Wycombe or Chepping Wycombe), it returned two MPs until 1868 and then one until its abolition in 1885. The name was then transferred to a new county division, formally known as the "Wycombe division of Buckinghamshire".
Constituency profile
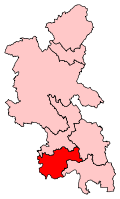
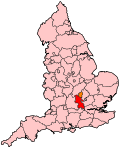
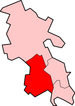
The constituency shares similar borders with Wycombe local government district, although it covers a slightly smaller area. The main town within the constituency, High Wycombe contains many working/middle class voters and a sizeable ethnic minority population that totals around one quarter of the town's population, with some census output areas of town home to over 50% ethnic minorities. The surrounding villages which account for just under half of the electorate are some of the most wealthy areas in the country with extremely low unemployment, and high incomes. Workless claimants totalled 3.0% of the population in November 2012, lower than the national average of 3.8%.[2]
Boundaries
1885-1918: The Municipal Borough of Chepping Wycombe, the Sessional Divisions of Burnham and Stoke, and parts of the first and second Sessional Divisions of Desborough.
1918-1945: The Municipal Borough of Chepping Wycombe, the Urban Districts of Eton, Marlow, and Slough, the Rural Districts of Eton and Hambleden, and part of the Rural District of Wycombe.
1945-1950: The Municipal Borough of Chepping Wycombe, the Urban District of Marlow, and the Rural District of Wycombe.
1950-1974: The Municipal Borough of High Wycombe, the Urban District of Marlow, and the Rural District of Wycombe.
1974-1983: The Municipal Borough of High Wycombe, the Urban District of Marlow, and in the Rural District of Wycombe the civil parishes of Chepping Wycombe, Fawley, Fingest and Lane End, Great Marlow, Hambleden, Hughenden, Little Marlow, Medmenham, Turville, and West Wycombe Rural.
1983-1997: The District of Wycombe wards of Booker and Castlefield, Bowerdean and Daws Hill, Cressex and Frogmoor, Downley, Great Marlow, Green Hill and Totteridge, Hambleden Valley, Hughenden Valley, Keep Hill and Hicks Farm, Kingshill, Lane End and Piddington, Little Marlow, Marlow Bottom, Marlow North, Marlow South, Marsh and Micklefield, Oakridge and Tinkers Wood, and West Wycombe and Sands.
1997-2010: The District of Wycombe wards of Booker and Castlefield, Bowerdean and Daws Hill, Cressex and Frogmoor, Downley, Great Marlow, Green Hill and Totteridge, Hambleden Valley, Hughenden Valley, Keep Hill and Hicks Farm, Kingshill, Lane End and Piddington, Marlow Bottom, Marlow North, Marlow South, Marsh and Micklefield, Oakridge and Tinkers Wood, and West Wycombe and Sands.
2010-present: The District of Wycombe wards of Abbey, Booker and Cressex, Bowerdean, Chiltern Rise, Disraeli, Downley and Plomer Hill, Greater Marlow, Hambleden Valley, Hazlemere North, Hazlemere South, Micklefield, Oakridge and Castlefield, Ryemead, Sands, Terriers and Amersham Hill, Totteridge, and Tylers Green and Loudwater.
Members of Parliament
MPs 1295–1640
- Constituency created (1295)
| Year | First member | Second member |
| 1295 | Stephen Ayott | Thomas le Tayleur |
| 1298 | Adam de Guldeford | Roger Allitarius |
| 1300 | John le Pistor |
| 1306 | Peter le Cotiler | John le Bake |
| 1307 | Andrew Batyn |
| 1307 | Roger de Sandwell |
| 1308 | Edmond de Haveringdoun |
| 1312 | Thomas Gerveys | Matthew le Fuller |
| 1312 | Robert Paer | William le Cassiere |
| 1318 | Robert Smith | William le Fote |
| 1322 | Richard le Haslere | Bennet le Cassiere |
| 1325 | John le Tayleur | John de Sandwell |
| 1326 | Roger Sandwell | Matthew le Fuller |
| 1327 | Richard atte Walle | John atte Donne |
| 1328 | John atte Donne | Henry de Mussenden |
| 1330 | John le Harriere | Richard Perre |
| 1332 | Matthew le Fuller | Richard Tottering |
| 1333 | Jordan de Wycombe | Richard Bennet |
| 1335 | John Ayot | Richard Perkyn |
| 1336 | John le Harriere | Thomas Gerveys |
| 1336 | John Ayot | Richard Abyndon |
| 1337 | John le Clerk | John Pool |
| 1338 | Stephen Ayot | John le Taverner |
| 1338 | Thomas Gerveys | Jordan de Preston |
| 1341 | Robert Stenstoole | Robert Harleyford |
| 1346 | Ralph Barber |
| 1347 | John Martyn | Robert Cattingham |
| 1348 | Walter atte Leech | William Cassiere |
| 1355 | Thomas Gerveys | Ralph Harleyford |
| 1357 | Robert Harleyford |
| 1357 | John Mepertshale |
| 1360 | Robert le Weeler |
| 1360 | Richard Spigurnell |
| 1362 | William Frere |
| 1365 | Thomas Cornwaile | Richard Barbour |
| 1368 | William atte Dene |
| 1369 | Thomas Gerveys |
| 1371 | No other? |
| 1372 | John Bledlowe |
| 1373 | Thomas Ballard |
| 1377 | Richard Sandwell |
| 1378 | Richard Jordaine |
| 1379 | Richard Sandwell |
| 1381 | Thomas Ravell | Walter Frere |
| 1382 | William Kele | William atte Dene |
| 1383 | Stephen Watford | John Petymin |
| 1384 | William atte Dene | Richard Kele |
| 1385 | Stephen Watford |
| 1386 | Walter Frere | Richard Holyman |
| 1388 | Stephen Watford | William atte Dene |
| 1391 | William Depham |
| 1392 | Walter Waltham |
| 1394 | Walter atte Dene | Nicholas Depham |
| 1396 | Richard Sandwell | Walter Waltham |
| 1399 | John Cotyngham | William Clerk |
| 1401 | Nicholas Sperling | John Sandwell |
| 1413 | Henry Sperling | Roger More |
| 1414 | William Hall | John Coventre II |
| 1415 | William Clerk | Andrew Sperling |
| 1417 | Roger More |
| 1419 | William Merchant | John Cotyngham |
| 1420 | Roger More | Thomas Merston |
| 1421 | John Horewode | Thomas Pusey |
| 1421 | Roger More | Richard Merston |
| 1422 | Nicholas Stepton | John Coventry |
| 1423 | Roger More |
| 1424 | William Whaplode | John Cotyngham |
| 1425 | Thomas Muston | William Stocton |
| 1427 | John Coventry | John Justice |
| 1429 | John Wellesbourn | John Bishop |
| 1430 | Roger More | William Fowler |
| 1432 | John Martyn | John Blackpoll |
| 1434 | John Durein | John Cotyngham |
| 1436 | John Hill | Bartholomew Halling |
| 1441 | John Radeshill | John Martyn |
| 1446 | John Wellesbourn |
| 1448 | John Haynes |
| 1449 | William Stocton | Nicholas Fayrewell |
| 1450 | Thomas More |
| 1452 | William Collard | David Thomasyn |
| 1461 | Thomas Mansell | Thomas Catsbury |
| 1469 | Thomas Fowler | Thomas Fayrewell |
| 1478 | Thomas Gate | Thomas Wellesbourn |
| 1529 | William Windsor | |
| 1542 | John Gates | William Dormer |
| 1547 | Thomas Fisher | Armigyll Wade |
| Mar 1553 | Henry Peckham | John Cheyne |
| Oct 1553 | Robert Drury |
| Apr 1554 | Thomas Pymme alias Fryer |
| Nov 1554 | John Cheyne | William Drury |
| 1555 | Henry Peckham | Robert Drury |
| 1558 | Thomas Pymme | Robert Woodleafe |
| 1558 | Paul Wentworth | Roland Bracebridge |
| 1562 | Thomas Fermore alias Draper | Thomas Keele |
| 1570 | John Russell | Robert Christmas |
| 1571 | Thomas Nale | Rowland Goules |
| 1584 | John Morley | George Cawfield |
| 1585 | Thomas Ridley | George Fleetwood |
| 1589 | Owen Oglethorp | Francis Goodwin |
| 1592 | Thomas Tasburgh | Thomas Fortescue |
| 1596 | William Fortescue | John Tasburgh |
| 1601 | Richard Blount | Henry Fleetwood |
| 1604 | Sir John Townsend |
| 1614 | William Borlase | Sir Henry Neville, jnr |
| 1621 | Richard Lovelace | Arthur Goodwin |
| 1624 | Henry Coke |
| 1625 | Thomas Lane |
| 1626 | Edmund Waller |
| 1628 | Sir William Borlase | Thomas Lane |
| 1629–1640 | No Parliament summoned |
MPs 1640–1868
| Year | First member[3] | First party | Second member[3] | Second party |
| |
|
April 1640 |
Sir Edmund Verney | Royalist |
Thomas Lane | Parliamentarian |
| November 1640 |
|
October 1642 |
Verney killed in battle – seat left vacant |
|
1645 |
Richard Browne | |
|
|
December 1648 |
Browne and Lane excluded in Pride's Purge – seat vacant |
|
|
1653 |
Wycombe was unrepresented in the Barebones Parliament |
|
|
1654 |
Thomas Scot | |
Wycombe had only one seat in the First and
Second Parliaments of the Protectorate |
|
1656 |
Tobias Bridge | |
|
January 1659 |
Thomas Scot | |
|
|
May 1659 |
Not represented in the restored Rump |
| | |
April 1660 |
Edmund Petty | |
Richard Browne | |
| | |
1661 |
Sir Edmund Pye, Bt | |
Sir John Borlase, Bt | |
|
February 1673 |
Sir John Borlase, Bt | |
|
November 1673 |
Robert Sawyer | |
|
1679 |
Thomas Lewes | |
| | |
1685 |
Sir Dennis Hampson, Bt | |
Edward Baldwin | |
| | |
1689 |
Thomas Lewes | |
William Jephson | |
|
1691 |
Charles Godfrey | |
|
1696 |
Fleetwood Dormer | |
|
1698 |
John Archdale[4] | |
|
1699 |
Thomas Archdale | |
|
1701 |
Fleetwood Dormer | |
|
1710 |
Sir Thomas Lee, Bt | |
|
1713 |
Sir John Wittewrong, Bt | |
|
February 1722 |
John Neale | |
| | |
March 1722 |
Charles Egerton | |
The Earl of Shelburne | |
|
February 1726 |
Charles Colyear [5] | |
|
March 1726 |
Harry Waller | |
|
1727 |
William Lee | |
|
1730 |
Sir Charles Vernon | |
|
1734 |
Edmund Waller [6] | |
|
1734 |
Sir Charles Vernon | |
|
1741 |
Edmund Waller | |
|
1747 |
Edmund Waller, junior | |
| | |
1754 |
The Earl of Shelburne | |
John Waller | Opposition Whig |
|
1757 |
Edmund Waller, junior | |
|
1760 |
Viscount FitzMaurice | Whig |
|
March 1761 |
Robert Waller | |
|
December 1761 |
Isaac Barré | Whig |
|
1774 |
Hon. Thomas FitzMaurice | |
|
1780 |
Viscount Mahon | Whig |
|
1786 |
Earl Wycombe | |
|
1790 |
Rear-Admiral Sir John Jervis [7] | Whig |
|
1794 |
Sir Francis Baring, Bt | |
|
1796 |
Sir John Dashwood-King, Bt | Tory |
|
1802 |
Sir Francis Baring, Bt | |
|
1806 |
Sir Thomas Baring, Bt | |
|
1831 |
Hon. Robert Smith | Whig |
|
1832 |
Hon. Charles Grey | Whig |
|
1837 |
Sir George Dashwood, Bt | Whig |
|
1838 |
George Robert Smith | Whig |
|
1841 |
Ralph Bernal | Whig |
|
1847 |
Martin Tucker Smith | Whig |
|
|
1859 |
Liberal |
Liberal |
|
1862 |
John Remington Mills | Liberal |
|
1865 |
Hon. Charles Carington | Liberal |
MPs 1868–present
- Reduced to one member (1868)
Elections
Elections in the 2010s
Elections in the 2000s
Elections in the 1990s
Elections in the 1980s
Elections in the 1970s
Elections in the 1960s
Elections in the 1950s
Election in the 1940s
A general election was expected 1939/40 and by 1939 the following had been adopted as candidates;
- Conservative: Sir Alfred Knox
- Labour: Ernest Whitfield
- Liberal: Vaughan Watkins
In 1938, the local Labour and Liberal parties had set up a formal organisation, 'The South Bucks Unity Committee' in support of a Popular Front and may well have agreed to support a joint candidate against the sitting Conservative.[20]
Election in the 1930s
Election in the 1920s

Vera Terrington
Election in the 1910s
Election in the 1900s

T.A.Herbert
See also
Notes and references
- Notes
- References
- ↑ "Electorate Figures – Boundary Commission for England". 2015 Electorate Figures. Boundary Commission for England. 29 April 2015. Retrieved 11 May 2015.
- ↑ Unemployment claimants by constituency The Guardian
- 1 2 3 Leigh Rayment's Historical List of MPs – Constituencies beginning with "W" (part 5)
- ↑ Archdale, a Quaker, never took his seat as he was not prepared to take the prescribed oath
- ↑ On petition, Colyear's election was declared void and a by-election was called. He was re-elected at the by-election but once more voted by the committee not to have been duly returned, and his opponent, Waller, was seated instead.
- ↑ Waller was also elected for Marlow, which he chose to represent, and did not for Wycombe in this Parliament
- ↑ Vice Admiral from 1793
- ↑ "Election Data 2015". Electoral Calculus. Archived from the original on 17 October 2015. Retrieved 17 October 2015.
- ↑ https://councillors.wycombe.gov.uk/mgElectionAreaResults.aspx?ID=96&RPID=29924966
- ↑ electorate 76371 provided by Wycombe Council elections office 22Jun2015
- ↑ "Election Data 2010". Electoral Calculus. Archived from the original on 26 July 2013. Retrieved 17 October 2015.
- ↑ "Wycombe". BBC News Online. Retrieved 2010-05-07.
- ↑ "Election Data 2005". Electoral Calculus. Archived from the original on 15 October 2011. Retrieved 18 October 2015.
- ↑ "Election Data 2001". Electoral Calculus. Archived from the original on 15 October 2011. Retrieved 18 October 2015.
- ↑ "Election Data 1997". Electoral Calculus. Archived from the original on 15 October 2011. Retrieved 18 October 2015.
- ↑ "Election Data 1992". Electoral Calculus. Archived from the original on 15 October 2011. Retrieved 18 October 2015.
- ↑ "Politics Resources". Election 1992. Politics Resources. 9 April 1992. Retrieved 2010-12-06.
- ↑ "Election Data 1987". Electoral Calculus. Archived from the original on 15 October 2011. Retrieved 18 October 2015.
- ↑ "Election Data 1983". Electoral Calculus. Archived from the original on 15 October 2011. Retrieved 18 October 2015.
- ↑ http://www.marxists.org/history/etol/revhist/backiss/vol1/no3/ayles.html
- 1 2 3 4 British parliamentary election results 1918-1949, Craig, F.W.S.
- ↑ Craig, F. W. S. British parliamentary election results 1918-1949 London: Macmillan.
- 1 2 3 Craig, F. W. S. (1974). British parliamentary election results 1885-1918 (1 ed.). London: Macmillan.
Further reading
- GENUKI
- Robert Beatson, A Chronological Register of Both Houses of Parliament (London: Longman, Hurst, Res & Orme, 1807)
- D Brunton & D H Pennington, Members of the Long Parliament (London: George Allen & Unwin, 1954)
- Cobbett's Parliamentary history of England, from the Norman Conquest in 1066 to the year 1803 (London: Thomas Hansard, 1808)
- The Constitutional Year Book for 1913 (London: National Union of Conservative and Unionist Associations, 1913)
- F W S Craig, British Parliamentary Election Results 1832–1885 (2nd edition, Aldershot: Parliamentary Research Services, 1989)
|
|---|
|
|
|
Towns
(component areas
and hamlets) | | |
|---|
|
Other civil parishes
(component villages
and hamlets) | |
|---|
|
Former districts
and boroughs | |
|---|
|
Former
constituencies | |
|---|
|
|
Coordinates: 51°36′N 0°48′W / 51.6°N 0.8°W / 51.6; -0.8