Runnymede and Weybridge (UK Parliament constituency)
Coordinates: 51°23′17″N 0°31′48″W / 51.388°N 0.530°W
| Runnymede and Weybridge | |
|---|---|
|
County constituency for the House of Commons | |
|
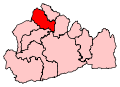
Boundary of Runnymede and Weybridge in Surrey. | |
|
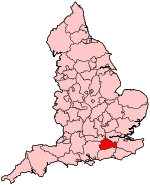
Location of Surrey within England. | |
| County | Surrey |
| Electorate | 73,680 (December 2010)[1] |
| Major settlements | Addlestone, Chertsey, Egham and Weybridge |
| Current constituency | |
| Created | 1997 |
| Member of parliament | Philip Hammond (Conservative) |
| Number of members | One |
| Created from |
Chertsey and Walton (majority) North West Surrey (minority) |
| Overlaps | |
| European Parliament constituency | South East England |
Runnymede and Weybridge is a constituency[n 1] represented in the House of Commons of the UK Parliament since its 1997 creation by the current Chancellor of the Exchequer, Philip Hammond, a Conservative.[n 2]
Boundaries
The constituency contains the whole of the area of Runnymede borough, and also the town of Weybridge in the Borough of Elmbridge district.
Parliament accepted the Boundary Commission's Fifth Periodic Review of Westminster constituencies to make no changes to this constituency for the 2010 general election which has electoral wards:
- Oatlands Park; St George's Hill; Weybridge North; Weybridge South in the Borough of Elmbridge
- Addlestone Bourneside; Addlestone North; Chertsey: Meads; St Ann's; South and Row Town; Egham: Hythe; Town; Englefield Green East; Englefield Green West; Foxhills; New Haw; Thorpe; Virginia Water; and Woodham in the Borough of Runnymede[2]
History
The constituency was created in 1997 from parts of the former seats of Chertsey and Walton and North West Surrey. Since its creation, it has been represented by Philip Hammond, the former Foreign Secretary and current Chancellor of the Exchequer.
Constituency profile
The constituency consists of Census Output Areas of two local government districts with similar characteristics: a working population whose income is higher than the national average and lower than average reliance upon social housing.[3] At the end of 2012 the unemployment rate in the constituency stood as 1.3% of the population claiming jobseekers allowance, compared to the regional average of 2.4%.[4] The borough contributing to the bulk of the seat has a low 14.7% of its population without a car, 18.3% of the population without qualifications and a high 29.9% with level 4 qualifications or above.
In terms of tenure 69.2% of homes are owned outright or on a mortgage as at the 2011 census across Runnymede.[5]
Members of Parliament
| Election | Member[6] | Party | |
|---|---|---|---|
| 1997 | Philip Hammond | Conservative | |
Elections
Elections in the 2010s
| Party | Candidate | Votes | % | ± | |
|---|---|---|---|---|---|
| Conservative | Philip Hammond | 29,901 | 59.7 | +3.8 | |
| Labour | Arran Neathey | 7,767 | 15.5 | +2.1 | |
| UKIP | Joe Branco[8] | 6,951 | 13.9 | +7.4 | |
| Liberal Democrat | John Vincent[9] | 3,362 | 6.7 | -14.9 | |
| Green | Rustam Majainah[10] | 2,071 | 4.1 | +2.7 | |
| Majority | 22,134 | 44.2 | +7.9 | ||
| Turnout | 50,224 | 68.1 | +1.7 | ||
| Conservative hold | Swing | +0.85 | |||
| Party | Candidate | Votes | % | ± | |
|---|---|---|---|---|---|
| Conservative | Philip Hammond | 26,915 | 55.9 | +4.5 | |
| Liberal Democrat | Andrew Falconer | 10,406 | 21.6 | +3.8 | |
| Labour | Paul Greenwood | 6,446 | 13.4 | -9.6 | |
| UKIP | Toby Micklethwait | 3,146 | 6.5 | +2.6 | |
| Green | Jenny Gould | 696 | 1.4 | -1.3 | |
| Independent | David Sammons | 541 | 1.1 | +1.1 | |
| Majority | 16,509 | 34.3 | |||
| Turnout | 48,150 | 66.4 | +8.0 | ||
| Conservative hold | Swing | +0.4 | |||
Elections in the 2000s
| Party | Candidate | Votes | % | ± | |
|---|---|---|---|---|---|
| Conservative | Philip Hammond | 22,366 | 51.4 | +2.7 | |
| Labour | Paul Greenwood | 10,017 | 23.0 | −6.0 | |
| Liberal Democrat | Henry Bolton | 7,771 | 17.9 | +1.6 | |
| UKIP | Anthony Micklethwait | 1,719 | 3.9 | +0.8 | |
| Green | Charles Gilman | 1,180 | 2.7 | −0.2 | |
| Monster Raving Loony | Andrew Collett | 358 | 0.8 | N/A | |
| UK Community Issues Party | Katrina Osman | 113 | 0.3 | N/A | |
| Majority | 12,349 | 28.4 | |||
| Turnout | 43,524 | 58.7 | +2.6 | ||
| Conservative hold | Swing | +4.4 | |||
- Result declared at 02:19
| Party | Candidate | Votes | % | ± | |
|---|---|---|---|---|---|
| Conservative | Philip Hammond | 20,646 | 48.7 | +0.1 | |
| Labour | Jane Briginshaw | 12,286 | 29.0 | −0.5 | |
| Liberal Democrat | Chris Bushill | 6,924 | 16.3 | 0.0 | |
| UKIP | Christopher Browne | 1,332 | 3.1 | +1.9 | |
| Green | Charles Gilman | 1,238 | 2.9 | N/A | |
| Majority | 8,360 | 19.7 | |||
| Turnout | 42,426 | 56.1 | −15.3 | ||
| Conservative hold | Swing | +0.3 | |||
- Result declared at 03:21
Elections in the 1990s
| Party | Candidate | Votes | % | ± | |
|---|---|---|---|---|---|
| Conservative | Philip Hammond | 25,051 | 48.6 | -12.8 | |
| Labour | Ian Peacock | 15,176 | 29.4 | +13.5 | |
| Liberal Democrat | Geoffrey Taylor | 8,397 | 16.3 | -4.8 | |
| Referendum | Peter Rolt | 2,150 | 4.2 | N/A | |
| UKIP | Simon Slater | 625 | 1.2 | N/A | |
| Natural Law | Jeremy Sleeman | 162 | 0.3 | N/A | |
| Majority | 9,875 | 19.2 | |||
| Turnout | 51,561 | 71.5 | |||
| Conservative hold | Swing | -13.1 | |||
- Result declared at 03:31
See also
Notes and references
- Notes
- ↑ A county constituency (for the purposes of election expenses and type of returning officer)
- ↑ As with all constituencies, the constituency elects one Member of Parliament (MP) by the first past the post system of election at least every five years.
- References
- ↑ "Electorate Figures - Boundary Commission for England". 2011 Electorate Figures. Boundary Commission for England. 4 March 2011. Retrieved 13 March 2011.
- ↑ 2010 post-revision map non-metropolitan areas and unitary authorities of England
- ↑ 2001 Census
- ↑ Unemployment claimants by constituency The Guardian
- ↑ 2011 census interactive maps
- ↑ Leigh Rayment's Historical List of MPs – Constituencies beginning with "R" (part 2)
- ↑ "Election Data 2015". Electoral Calculus. Archived from the original on 17 October 2015. Retrieved 17 October 2015.
- ↑ http://ukpollingreport.co.uk/2015guide/runnymedeandweybridge/
- ↑ http://www.libdems.org.uk/general_election_candidates#South East
- ↑ http://surrey.greenparty.org.uk/news/ge2015cands.html
- ↑ "Election Data 2010". Electoral Calculus. Archived from the original on 17 October 2015. Retrieved 17 October 2015.
- ↑ "Election Data 2005". Electoral Calculus. Archived from the original on 15 October 2011. Retrieved 18 October 2015.
- ↑ "Election Data 2001". Electoral Calculus. Archived from the original on 15 October 2011. Retrieved 18 October 2015.
- ↑ "Election Data 1997". Electoral Calculus. Archived from the original on 15 October 2011. Retrieved 18 October 2015.
Sources
- Election result, 2015 (BBC)
- Election result, 2010 (BBC)
- Election result, 2005 (BBC)
- Election results, 1997 - 2001 (BBC)
- Election results, 1997 - 2001 (Election Demon)