United Kingdom general election, 2001
| | |||||||||||||||||||||||||||||||||||||||||||||||||||||||||||||||||||
| |||||||||||||||||||||||||||||||||||||||||||||||||||||||||||||||||||
| |||||||||||||||||||||||||||||||||||||||||||||||||||||||||||||||||||
|
| |||||||||||||||||||||||||||||||||||||||||||||||||||||||||||||||||||
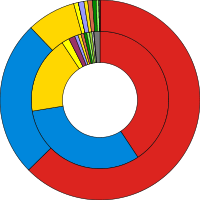
| Colours denote the winning party, as shown in the main table of results. | |||||||||||||||||||||||||||||||||||||||||||||||||||||||||||||||||||
| |||||||||||||||||||||||||||||||||||||||||||||||||||||||||||||||||||
.jpg)

.jpg)

| 1992 election • MPs |
| 1997 election • MPs |
| 2001 election • MPs |
| 2005 election • MPs |
| 2010 election • MPs |
The United Kingdom general election, 2001, was held on Thursday, 7 June 2001, to elect 659 members to the British House of Commons. It was dubbed "the quiet landslide" by the media,[1] as the Labour Party was re-elected with another landslide result and only suffered a net loss of five seats, though with significantly lower turnout than before – 59.4%, compared to 71.3% in the previous election. Tony Blair went on to become the first Labour Prime Minister to serve a second consecutive full term in office.
There was little change outside Northern Ireland, with 620 out of the 641 seats electing candidates from the same party as they did in 1997. Factors contributing to the Labour victory were a strong economy and falling unemployment, as well as that Labour was seen as having delivered on many key election pledges that it had made in 1997. The Conservative Party, under William Hague's leadership, was still deeply divided on the issue of Europe and the party's policy platform was considered to have shifted to a right-wing focus. Hague was also hindered by a series of embarrassing publicity stunts, and resigned as party leader three months later, becoming the first Conservative leader since Austen Chamberlain to leave office without becoming Prime Minister.
The election was essentially a repeat of the 1997 election, with Labour losing only 6 seats overall and the Conservatives making a net gain of one seat (gaining nine seats, but losing eight). The Conservatives did manage to gain a seat in Scotland, which ended the party's status as an 'England-only' party in the prior parliament. Although they did not gain many seats, one of the new MPs elected was future Conservative Prime Minister David Cameron. The Liberal Democrats gained six seats.
Change was seen in Northern Ireland, with the moderately unionist Ulster Unionist Party losing four seats to the more hardline Democratic Unionist Party. This transition was mirrored in the republican community with the moderate SDLP losing votes to the more staunchly republican and abstentionist Sinn Féin.
The election was also marked with exceptionally low voter turnout, falling below 60% for the first time since 1918.[2] The election was broadcast live on the BBC, and presented by Jeremy Paxman, Andrew Marr, Peter Snow and David Dimbleby.[3]
It was the last time that a party got above 40% in a British general election.
Overview
The election had been expected on 3 May, to coincide with local elections, but both were postponed because of rural movement restrictions imposed in response to the foot and mouth outbreak.
The elections were marked by voter apathy, with turnout falling to 59.4%, the lowest since the Coupon Election of 1918. Throughout the election the Labour Party had maintained a significant lead in the opinion polls and the result was deemed to be so certain that some bookmakers paid out for a Labour majority before the election day. However, the opinion polls the previous autumn had shown the first Tory lead (though only by a narrow margin) in the opinion polls for eight years as they benefited from the public anger towards the government over the fuel protests which had led to a severe shortage of motor fuel. By the end of 2000, however, the dispute had been solved and Labour were firmly back in the lead of the opinion polls.[4]
In total, a mere 29 parliamentary seats changed hands at the 2001 election.[5]
One of the more noted events of a quiet campaign was when countryside protester Craig Evans threw an egg at Deputy Prime Minister John Prescott in Rhyl; Prescott then punched him and a struggle ensued, in front of television cameras. 2001 also saw the rare election of an independent. Dr. Richard Taylor of Independent Kidderminster Hospital and Health Concern (usually now known simply as "Health Concern") unseated a government minister. There was also a high vote for British National Party leader Nick Griffin in Oldham, in the wake of recent race riots in the town.
In Northern Ireland, the election was far more dramatic and marked a move by unionists away from support for the Good Friday Agreement, with the moderate unionist Ulster Unionist Party (UUP) losing to the more hardline Democratic Unionist Party (DUP). This polarisation was also seen in the nationalist community, with the Social Democratic and Labour Party (SDLP) vote losing out to more left-wing and republican Sinn Féin. It also saw a tightening of the parties as the small UK Unionist Party lost its only seat.
Campaign
For Labour, the last four years had run relatively smoothly. The party had successfully defended all their by-election seats, and many suspected a Labour win was inevitable from the start. Many in the party however were afraid of voter apathy, which was epitomised in the "Hague with Lady Thatcher's hair" poster.[6] Despite recessions in mainland Europe and the US, due to the bursting of global tech bubbles, Britain was notably unaffected and Labour however could rely on a strong economy as unemployment continued to decline toward election day, putting to rest any fears of a Labour government putting the economic situation at risk.
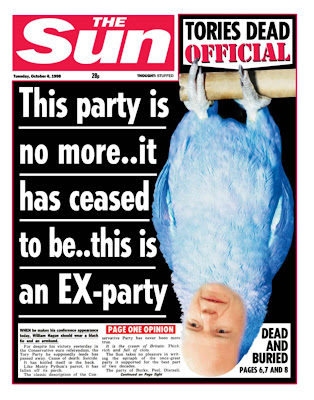
For William Hague, however, the Conservative Party had still not fully recovered from the loss in 1997. The party was still divided over Europe, and talk of a referendum on joining the Eurozone was rife. As Labour remained at the political centre, the Tories moved to the right. A policy gaffe by Oliver Letwin over public spending cuts left the party with an own goal that Labour soon took advantage of. Margaret Thatcher also added to Hague's troubles when speaking out strongly against the Euro to applause. Hague himself, although a witty performer at PMQs, was dogged in the press and reminded of his speech at Conservative conference at the age of 16. The Sun newspaper only added to the Conservatives woes by backing Labour once again, calling Hague a "dead parrot".[7]
The Tories campaigned on a strongly right-wing platform, emphasising the issues of Europe, immigration and tax, the fabled "Tebbit Trinity". However, Labour countered by asking where the proposed tax cuts were going to come from, and decried the Tory policy as "cut here, cut there, cut everywhere", in reference to the widespread belief that the Conservatives would make major cuts to public services in order to fund tax cuts.
For the Liberal Democrats, this was the first election for leader Charles Kennedy.[8]
Controversy
During the election Sharron Storer, a resident of Birmingham, criticised Prime Minister Tony Blair in front of television cameras about conditions in the National Health Service. The widely televised incident happened on 16 May during a campaign visit by Blair to the Queen Elizabeth Hospital in Birmingham. Sharron Storer's partner, Keith Sedgewick, a cancer patient with non-Hodgkin's lymphoma and therefore highly susceptible to infection, was being treated at the time in the bone marrow unit, but no bed could be found for him and he was transferred to the casualty unit for his first 24 hours.[9][10][11]
Opinion polling
Results
The election was effectively a repeat of 1997, as the Labour party retained an overwhelming majority. Having presided over relatively serene political, economic and social conditions, the feeling of prosperity in the UK had been maintained into the new millennium, and Labour would have a free hand to assert its ideals in the subsequent parliament. Despite the victory, voter apathy was a major issue, as turnout fell below 60%, 12% down on 1997. All of the 3 main parties saw their total votes fall, with Labour's total vote dropping by 2.8 million on 1997, the Conservatives 1.3 million, and the Liberal Democrats 428,000. Some suggested this dramatic fall was a sign of the general acceptance of the status quo and the likelihood of Labour's majority remaining unassailable.[12]
For the Conservatives, the huge loss they had sustained in 1997 was repeated. Despite gaining 9 seats the Tories lost 8 behind them to the Liberal Democrats and one even to Labour. The inevitable result was the speedy resignation of William Hague in the election aftermath. Some believed that Hague had been unlucky, although most considered him to be a talented orator and an intelligent statesman, he had come up against the charismatic Tony Blair in the pomp of his political career, and it was no surprise that little progress was made in reducing Labour's majority after a relatively smooth parliament. Staying at what they considered rock-bottom however showed that the Conservatives had failed to improve their negative public image, had remained somewhat disunited over Europe and had not regained the trust that they had lost in the 1990s. But in Scotland they managed to scrape one seat from the SNP, despite continuing its vote collapse. It failed to retake former strongholds in Scotland as the Nationalists consolidated their grip on the Northeastern portion of the country.[13]
The Liberal Democrats could point to steady progress under Charles Kennedy, gaining more seats than the main two parties – albeit only six overall – and maintaining the performance of a pleasing 1997 election, where the party had doubled its number of seats from 20 to 46. While they had yet to become electable as a government, they underlined their growing reputation as a worthwhile alternative to Labour and Conservative, offering plenty of debate in parliament and not just representing a protest vote.
The SNP failed to gain any seats and lost a seat to the Conservatives by just 79 votes. Plaid Cymru gained and lost a seat to Labour respectively.
In Northern Ireland the Ulster Unionists, despite gaining North Down, lost 5 seats behind them.
| 413 | 166 | 52 | 28 |
| Labour | Conservative | Lib Dem | O |
| Candidates | Votes | ||||||||||
|---|---|---|---|---|---|---|---|---|---|---|---|
| Party | Leader | Standing | Elected | Gained | Unseated | Net | % of total | % | No. | Net % | |
| Labour | Tony Blair | 640 | 413 | 2 | 8 | −6 | 62.5 | 40.7 | 10,724,953 | −2.5 | |
| Conservative | William Hague | 643 | 166 | 9 | 8 | +1 | 25.2 | 31.7 | 8,357,615 | +1.0 | |
| Liberal Democrat | Charles Kennedy | 639 | 52 | 8 | 2 | +6 | 7.9 | 18.3 | 4,814,321 | +1.5 | |
| SNP | John Swinney | 72 | 5 | 0 | 1 | −1 | 0.8 | 1.8 | 464,314 | −0.2 | |
| UKIP | Jeffrey Titford | 428 | 0 | 0 | 0 | 0 | 0.0 | 1.5 | 390,563 | 1.2 | |
| UUP | David Trimble | 17 | 6 | 1 | 5 | −4 | 0.9 | 0.8 | 216,839 | 0.0 | |
| Plaid Cymru | Ieuan Wyn Jones | 40 | 4 | 1 | 1 | 0 | 0.6 | 0.7 | 195,893 | +0.2 | |
| DUP | Ian Paisley | 14 | 5 | 3 | 0 | +3 | 0.8 | 0.7 | 181,999 | +0.4 | |
| Sinn Féin | Gerry Adams | 18 | 4 | 2 | 0 | +2 | 0.6 | 0.7 | 175,933 | +0.3 | |
| SDLP | John Hume | 18 | 3 | 0 | 0 | 0 | 0.5 | 0.6 | 169,865 | 0.0 | |
| Green | Margaret Wright and Mike Woodin | 145 | 0 | 0 | 0 | 0 | 0.0 | 0.6 | 166,477 | +0.3 | |
| Independent | N/A | 136 | 0 | 0 | 1 | −1 | 0.0 | 0.4 | 97,070 | +0.3 | |
| Scottish Socialist | Tommy Sheridan | 72 | 0 | 0 | 0 | 0 | 0.0 | 0.3 | 72,516 | N/A | |
| Socialist Alliance | None | 98 | 0 | 0 | 0 | 0 | 0.0 | 0.2 | 57,553 | N/A | |
| Socialist Labour | Arthur Scargill | 114 | 0 | 0 | 0 | 0 | 0.0 | 0.2 | 57,288 | 0.0 | |
| BNP | Nick Griffin | 33 | 0 | 0 | 0 | 0 | 0.0 | 0.2 | 47,129 | +0.1 | |
| Alliance | Séan Neeson | 10 | 0 | 0 | 0 | 0 | 0.0 | 0.1 | 28,999 | −0.1 | |
| Health Concern | Richard Taylor | 1 | 1 | 1 | 0 | +1 | 0.2 | 0.1 | 28,487 | N/A | |
| Liberal | Michael Meadowcroft | 13 | 0 | 0 | 0 | 0 | 0.0 | 0.1 | 13,685 | 0.0 | |
| UK Unionist | Robert McCartney | 1 | 0 | 0 | 1 | −1 | 0.0 | 0.1 | 13,509 | +0.1 | |
| ProLife Alliance | Bruno Quintavalle | 37 | 0 | 0 | 0 | 0 | 0.0 | 0.0 | 9,453 | −0.1 | |
| Legalise Cannabis | Alun Buffry | 13 | 0 | 0 | 0 | 0 | 0.0 | 0.0 | 8,677 | N/A | |
| People's Justice | Shaukat Ali Khan | 3 | 0 | 0 | 0 | 0 | 0.0 | 0.0 | 7,443 | N/A | |
| Monster Raving Loony | Howling Laud Hope and Catmando | 15 | 0 | 0 | 0 | 0 | 0.0 | 0.0 | 6,655 | 0.0 | |
| PUP | Hugh Smyth | 2 | 0 | 0 | 0 | 0 | 0.0 | 0.0 | 4,781 | 0.0 | |
| Mebyon Kernow | Dick Cole | 3 | 0 | 0 | 0 | 0 | 0.0 | 0.0 | 3,199 | 0.0 | |
| NI Women's Coalition | Monica McWilliams and Pearl Sagar | 1 | 0 | 0 | 0 | 0 | 0.0 | 0.0 | 2,968 | 0.0 | |
| Scottish Unionist | 2 | 0 | 0 | 0 | 0 | 0.0 | 0.0 | 2,728 | N/A | ||
| Rock 'n' Roll Loony | Chris Driver | 7 | 0 | 0 | 0 | 0 | 0.0 | 0.0 | 2,634 | N/A | |
| National Front | Tom Holmes | 5 | 0 | 0 | 0 | 0 | 0.0 | 0.0 | 2,484 | 0.0 | |
| Workers' Party | Seán Garland | 6 | 0 | 0 | 0 | 0 | 0.0 | 0.0 | 2,352 | 0.0 | |
| Neath Port Talbot Ratepayers | Paul Evans | 1 | 0 | 0 | 0 | 0 | 0.0 | 0.0 | 1,960 | N/A | |
| NI Unionist | Cedric Wilson | 6 | 0 | 0 | 0 | 0 | 0.0 | 0.0 | 1,794 | N/A | |
| Socialist Alternative | Peter Taaffe | 2 | 0 | 0 | 0 | 0 | 0.0 | 0.0 | 1,454 | 0.0 | |
| Reform 2000 | Erol Basarik | 5 | 0 | 0 | 0 | 0 | 0.0 | 0.0 | 1,418 | N/A | |
| Isle of Wight | 1 | 0 | 0 | 0 | 0 | 0.0 | 0.0 | 1,164 | N/A | ||
| Muslim | 4 | 0 | 0 | 0 | 0 | 0.0 | 0.0 | 1,150 | N/A | ||
| Communist | Robert Griffiths | 6 | 0 | 0 | 0 | 0 | 0.0 | 0.0 | 1,003 | 0.0 | |
| New Britain | Dennis Delderfield | 1 | 0 | 0 | 0 | 0 | 0.0 | 0.0 | 888 | 0.0 | |
| Free Party | 3 | 0 | 0 | 0 | 0 | 0.0 | 0.0 | 832 | N/A | ||
| Leeds Left Alliance | Mike Davies | 1 | 0 | 0 | 0 | 0 | 0.0 | 0.0 | 770 | N/A | |
| New Millennium Bean Party | Captain Beany | 1 | 0 | 0 | 0 | 0 | 0.0 | 0.0 | 727 | N/A | |
| Workers Revolutionary | Sheila Torrance | 6 | 0 | 0 | 0 | 0 | 0.0 | 0.0 | 607 | 0.0 | |
| Tatton | 1 | 0 | 0 | 0 | 0 | 0.0 | 0.0 | 505 | N/A | ||
| Government's new majority | 167 |
| Total votes cast | 26,368,204 |
| Turnout | 59.4% |
All parties with more than 500 votes shown.
The seat gains reflect changes on the 1997 general election result. Two seats had changed hands in by-elections in the intervening period. These were as follows:
- Romsey from Conservative to Liberal Democrats. This seat stayed Liberal Democrat in 2001.
- South Antrim from Ulster Unionists to Democratic Unionists. This seat reverted to the Ulster Unionists in 2001.
The results of the election give a Gallagher index of dis-proportionality of 17.74.
Seats changing hands
MPs that lost their seats

See also
- MPs elected in the United Kingdom general election, 2001
- 2001 UK foot and mouth crisis
- 2001 United Kingdom general election results in Scotland
- 2001 United Kingdom general election results in Wales
- 2001 United Kingdom general election results in Northern Ireland
Manifestos
- Labour (Ambitions for Britain)
- Conservative (Time for Common Sense)
- Liberal Democrat (Freedom, Justice, Honesty)
- UK Independence Party
- British National Party (Where we stand!)
- Green Party of England and Wales
- Ulster Unionist Party
- Progressive Unionist Party
- Social Democratic and Labour Party (It's working – let's keep building)
- Plaid Cymru
- Scottish National Party (Heart of the Manifesto 2001)
- ProLife Alliance
- The Democratic Party (The will of the people NOT the party)
- Kidderminster Health Concern
- Monster Raving Loony Party (Vote for insanity – you know it makes sense)
- The Stuckist Party
- Scottish Socialist Party
- Left Alliance
- Communist Party of Britain (People's need before corporate profit greed)
- Revolutionary Communist Party of Britain (Marxist-Leninist)
References
- ↑ Parkinson, Justin (3 August 2010). "The rise and fall of New Labour". BBC.co.uk. Retrieved 12 May 2015.
- ↑ "Election Statistics: UK 1918–2007" (PDF). House of Commons Library. 1 February 2008. p. 18. Retrieved 23 May 2014.
- ↑ https://www.youtube.com/watch?v=6weF6Q37F2w&feature=mfu_in_order&playnext=1&videos=UsHbCo8smUk| BBC Vote 2001 Coverage
- ↑ "Tories 'to cut fuel duty'". BBC News. 10 May 2001. Retrieved 26 October 2015.
- ↑ "2001: Labour claims second term". BBC News. 5 April 2005. Retrieved 26 May 2010.
- ↑ "Get out and vote. Or they get in.". The Guardian. London.
- ↑ http://4.bp.blogspot.com/_ThhguC97EdA/STaU-tJdVzI/AAAAAAAAASA/GVBGsJaLKAI/s400/PARROT-HAGUE.jpg
- ↑ "2001: Labour claims second term". BBC News. 5 April 2005.
- ↑ Duncan Watts (2006). British Government and Politics: A Comparative Guide. Edinburgh University. ISBN 978-0-7486-2323-5.
- ↑ BBC story from 16 May 2001
- ↑ BBC story from 17 May 2001
- ↑ "The poll that never was". BBC News. 11 June 2001.
- ↑ "Labour romps home again". BBC News. 8 June 2001.
Bibliography
- Butler, David and Dennis Kavanagh. The British General Election of 2001 (2002), the standard scholarly study
- General Election results, 7 June 2001 (Research Party 01/54), House of Commons Library
External links
- BBC News: Vote 2001 – in depth coverage.
- Catalogue of 2001 general election ephemera at the Archives Division of the London School of Economics.
- Election Night coverage All 34 parts uploaded onto YouTube
| General elections |
|
|---|---|
| Local elections |
|
| European elections | |
| Referendums | |
| |
| ||
| Politics | 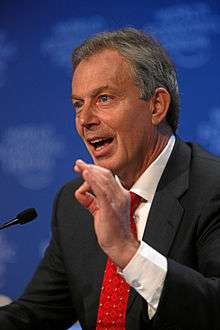 | |
| Ideology | ||
| General elections | ||
| Party election | ||
| Shadow Cabinet elections | ||
| Post-premiership | ||
| Books | ||
| Family |
| |
| Cultural depictions |
| |
| Related topics | ||
| ||
| Politics |  | |
|---|---|---|
| Ideology | ||
| General election | ||
| Party election | ||
| Key figures | ||
|---|---|---|
| Political ethos | ||
| General elections | ||
| Government | ||
| Publications | ||
| Related topics | ||
| ||