Worthing West (UK Parliament constituency)
Coordinates: 51°49′41″N 0°19′44″W / 51.828°N 0.329°W
| Worthing West | |
|---|---|
|
Borough constituency for the House of Commons | |
|
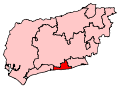
Boundary of Worthing West in West Sussex. | |
|
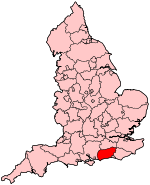
Location of West Sussex within England. | |
| County | West Sussex |
| Electorate | 74,468 (December 2010) |
| Current constituency | |
| Created | 1997 |
| Member of parliament | Sir Peter Bottomley (Conservative) |
| Overlaps | |
| European Parliament constituency | South East England |
Worthing West is a borough constituency represented in the House of Commons of the Parliament of the United Kingdom. It elects one Member of Parliament (MP) by the first past the post system of election.
Boundaries
The constituency covers the western portion of Worthing in West Sussex. Eastern parts of the town are in the East Worthing and Shoreham constituency. It also contains the towns of East Preston and Rustington in the district of Arun.
History
The constituency was created in 1997 when the previous constituency, Worthing was divided in two. Prior to 1945, the territory of this constituency had been contained in the Horsham and Worthing seat.
The MP since the seat's creation is the Conservative Peter Bottomley. He previously represented the Eltham area in south-east London from 1975 to 1997.
Members of Parliament
| Election | Member[1] | Party | |
|---|---|---|---|
| 1997 | Sir Peter Bottomley | Conservative | |
Elections
Elections in the 2010s
| Party | Candidate | Votes | % | ± | |
|---|---|---|---|---|---|
| Conservative | Sir Peter Bottomley | 26,124 | 51.5 | −0.3 | |
| UKIP | Timothy Philip Cross | 9,269 | 18.3 | +12.3 | |
| Labour | Jim Deen | 7,955 | 15.7 | +3.9 | |
| Liberal Democrat | Hazel Thorpe | 4,477 | 8.8 | −19.0 | |
| Green | David Aherne | 2,938 | 5.8 | +3.8 | |
| Majority | 16,855 | 33.2 | |||
| Turnout | 50,763 | 67.1 | +2.4 | ||
| Conservative hold | Swing | ||||
| Party | Candidate | Votes | % | ± | |
|---|---|---|---|---|---|
| Conservative | Peter Bottomley | 25,416 | 51.7 | +4.1 | |
| Liberal Democrat | Hazel Thorpe | 13,687 | 27.9 | +1.1 | |
| Labour | Ian Ross | 5,800 | 11.8 | −7.4 | |
| UKIP | John Wallace | 2,924 | 6.0 | +0.7 | |
| Green | David Aherne | 996 | 2.0 | N/A | |
| Christian | Stuart Dearsley | 300 | 0.6 | N/A | |
| Majority | 11,729 | 23.9 | |||
| Turnout | 49,123 | 64.7 | +2.7 | ||
| Conservative hold | Swing | ||||
Elections in the 2000s
| Party | Candidate | Votes | % | ± | |
|---|---|---|---|---|---|
| Conservative | Peter Bottomley | 21,383 | 47.6 | +0.1 | |
| Liberal Democrat | Claire Potter | 12,004 | 26.7 | +0.2 | |
| Labour | Antony Bignell | 8,630 | 19.2 | −2.3 | |
| UKIP | Timothy Cross | 2,374 | 5.3 | +0.8 | |
| Legalise Cannabis | Chris Baldwin | 515 | 1.2 | N/A | |
| Majority | 9,379 | 20.9 | |||
| Turnout | 44,906 | 62.6 | +2.1 | ||
| Conservative hold | Swing | +0.1 | |||
| Party | Candidate | Votes | % | ± | |
|---|---|---|---|---|---|
| Conservative | Peter Bottomley | 20,508 | 47.5 | +1.3 | |
| Liberal Democrat | James Walsh | 11,471 | 26.5 | −4.6 | |
| Labour | Alan Butcher | 9,270 | 21.5 | +5.2 | |
| UKIP | Timothy Philip Cross | 1,960 | 4.5 | +2.5 | |
| Majority | 9,037 | 21.0 | |||
| Turnout | 43,209 | 59.7 | −12.1 | ||
| Conservative hold | Swing | ||||
Elections in the 1990s
| Party | Candidate | Votes | % | ± | |
|---|---|---|---|---|---|
| Conservative | Peter Bottomley | 23,733 | 46.1 | N/A | |
| Liberal Democrat | Christopher A. Hare | 16,020 | 31.1 | N/A | |
| Labour | John P. Adams | 8,347 | 16.2 | N/A | |
| Referendum | Nick John | 2,313 | 4.5 | N/A | |
| UKIP | Timothy Philip Cross | 1,029 | 2.0 | N/A | |
| Majority | 7,713 | 15.0 | N/A | ||
| Turnout | 51,442 | 71.8 | N/A | ||
| Conservative win (new seat) | |||||
See also
Notes and references
- ↑ Leigh Rayment's Historical List of MPs – Constituencies beginning with "W" (part 5)
- ↑ "Election Data 2015". Electoral Calculus. Archived from the original on 17 October 2015. Retrieved 17 October 2015.
- ↑ http://www.bbc.co.uk/news/politics/constituencies/E14001055
- ↑ "Election Data 2010". Electoral Calculus. Archived from the original on 17 October 2015. Retrieved 17 October 2015.
- ↑ "Worthing West". BBC News Online. Retrieved 2010-05-07.
- ↑ "Election Data 2005". Electoral Calculus. Archived from the original on 15 October 2011. Retrieved 18 October 2015.
- ↑ http://www.worthing.gov.uk/worthings-services/electionselectoralregisterandvoting/previouselectionresults/elections2005-parliamentarycountycouncil/
- ↑ "Election Data 2001". Electoral Calculus. Archived from the original on 15 October 2011. Retrieved 18 October 2015.
- ↑ "Election Data 1997". Electoral Calculus. Archived from the original on 15 October 2011. Retrieved 18 October 2015.
External links
- Election result, 2015 (BBC)
- Election result, 2010 (BBC)
- Election result, 2005 (BBC)
- Election results, 1997 - 2001 (BBC)
- Election results, 1997 - 2001 (Election Demon)