Isle of Wight (UK Parliament constituency)
Coordinates: 50°41′02″N 1°19′12″W / 50.684°N 1.320°W
| Isle of Wight | |
|---|---|
|
County constituency for the House of Commons | |
|
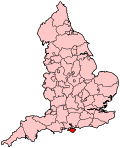
Location of Isle of Wight within England. | |
| County | Isle of Wight |
| Electorate | 110,924 (December 2010)[1] |
| Current constituency | |
| Created | 1832 |
| Member of parliament | Andrew Turner (Conservative) |
| Number of members | One |
| Created from |
Hampshire Newtown Yarmouth |
| Overlaps | |
| European Parliament constituency | South East England |
Isle of Wight (/ˈwaɪt/[2]) is a constituency[n 1] represented in the House of Commons of the UK Parliament since 2001 by Andrew Turner of the Conservative Party.
Created by the Great Reform Act for the 1832 general election it covers the whole of the Isle of Wight and has had the largest electorate of any constituency in all General Elections since 1983.[n 2]
Boundaries
The Isle of Wight forms a single constituency of the House of Commons. It covers exactly the same land as the ceremonial county of the Isle of Wight and the area administered by the unitary authority, Isle of Wight Council, which comprises the island itself together with a few uninhabited rocks.
Its electorate of 110,924 (as of 2010)[3] is by far the largest in the UK, being more than 50% above the England average of 71,537[3] and five times the size of the smallest (Na h-Eileanan an Iar, formerly known as the Western Isles), despite the Isle of Wight having some of the same problems as other island constituencies.[4]
Recent history
Successive Boundary Commission Reports considered the possibility of splitting the island into two constituencies (or possibly having a constituency crossing the Solent onto the mainland) but with a distinct lack of local enthusiasm for either option the Boundary Commission, party-interested and neutral commentators felt that the island would still be best represented by a single MP. One problem the independent body cited in 2008 was a difficulty of dividing the island in two in a way that would be acceptable to all interests.[5] However, in the 2018 review now underway, dividing the island into two separate constituencies (both significantly smaller than the allowable range for mainland constituencies) is a requirement. The Commission's draft proposals divide the island into two seats, East and West.[6]
History
Before the Reform Act 1832 the island usually had three Parliamentary boroughs: Newport, Newtown, and Yarmouth each electing two MPs. In 1654 an Isle of Wight constituency was created for the First Protectorate Parliament but the island subsequently reverted to the three constituencies. Otherwise, the island was represented by the two members for Hampshire. The Reform Act abolished Newtown and Yarmouth parliamentary boroughs, and created a county constituency for the whole of the Isle of Wight. The county electorate included freeholders, qualified by property, in the remaining parliamentary borough. The separate Newport borough constituency was abolished in 1885.
The constituency has traditionally been a battleground between the Conservatives and the Liberal Democrats. Between 1974 and 1987 the seat was a Liberal seat,[7][8][9] then becoming Conservative until 1997 when the Liberal Democrats won on a reduced Conservative vote.[9][10] The seat reverted to the Conservatives in 2001.[10] At the 2015 election, whilst the Conservatives scored one of their largest reductions in vote share in the UK, the Liberal Democrats dropped by even more and finished in fifth place.
Members of Parliament
Pre 1832
- 1654: Lord Lisle; William Sydenham
Since 1832

Elections
Elections in the 2010s
| Party | Candidate | Votes | % | ± | |
|---|---|---|---|---|---|
| Conservative | Andrew John Turner[13] | 28,591 | 40.7 | -6.0 | |
| UKIP | Iain McKie[14] | 14,888 | 21.2 | +17.7 | |
| Green | Vix Lowthion[15] | 9,404 | 13.4 | +12.1 | |
| Labour | Stewart Blackmore[13] | 8,984 | 12.8 | +1.2 | |
| Liberal Democrat | David Goodall[16] | 5,235 | 7.5 | -24.2 | |
| Independent | Ian Stephens[17] | 3,198 | 4.5 | N/A | |
| Majority | 13,703 | 19.5 | +4.5 | ||
| Turnout | 70,300 | 65.0 | +1.1 | ||
| Conservative hold | Swing | -11.8 | |||
| Party | Candidate | Votes | % | ± | |
|---|---|---|---|---|---|
| Conservative | Andrew John Turner | 32,810 | 46.7 | −2.3 | |
| Liberal Democrat | Jill Wareham | 22,283 | 31.7 | +2.2 | |
| Labour | Mark Chiverton | 8,169 | 11.6 | −5.6 | |
| UKIP | Michael Tarrant | 2,435 | 3.5 | +0.1 | |
| BNP | Geoff Clynch | 1,457 | 2.1 | N/A | |
| English Democrat | Ian Dunsire | 1,233 | 1.8 | N/A | |
| Green | Bob Keats | 931 | 1.3 | N/A | |
| Middle England Party | Paul Martin | 616 | 0.9 | N/A | |
| Independent | Pete Harris | 175 | 0.2 | N/A | |
| Independent | Paul Randle-Jolliffe | 89 | 0.1 | N/A | |
| Independent | Edward Corby | 66 | 0.1 | −0.7 | |
| Majority | 10,527 | 15.0 | |||
| Turnout | 70,264 | 63.9 | |||
| Conservative hold | Swing | ||||
Elections in the 2000s
| Party | Candidate | Votes | % | ± | |
|---|---|---|---|---|---|
| Conservative | Andrew John Turner | 32,717 | 48.9 | +9.2 | |
| Liberal Democrat | Anthony Rowlands | 19,739 | 29.5 | −5.8 | |
| Labour | Mark Chiverton | 11,484 | 17.2 | +2.0 | |
| UKIP | Michael Tarrant | 2,352 | 3.5 | +0.2 | |
| Independent | Edward Corby | 551 | 0.8 | ||
| Majority | 12,978 | 19.4 | |||
| Turnout | 66,843 | 61.3 | +0.5 | ||
| Conservative hold | Swing | +7.5 | |||
| Party | Candidate | Votes | % | ± | |
|---|---|---|---|---|---|
| Conservative | Andrew John Turner | 25,223 | 39.7 | +5.7 | |
| Liberal Democrat | Peter Brand | 22,397 | 35.3 | −7.5 | |
| Labour | Deborah Gardiner | 9,676 | 15.2 | +2.1 | |
| UKIP | David Lott | 2,106 | 3.3 | +1.9 | |
| Independent | David Holmes | 1,423 | 2.2 | ||
| Green | Paul Scivier | 1,279 | 2.0 | +1.3 | |
| Isle of Wight Party | Philip Murray | 1,164 | 1.8 | ||
| Socialist Labour | James Spensley | 214 | 0.3 | ||
| Majority | 2,826 | 4.4 | |||
| Turnout | 63,482 | 60.8 | −11.2 | ||
| Conservative gain from Liberal Democrat | Swing | 6.6 | |||
Elections in the 1990s
| Party | Candidate | Votes | % | ± | |
|---|---|---|---|---|---|
| Liberal Democrat | Dr Peter Brand | 31,274 | 42.7 | −2.9 | |
| Conservative | Andrew John Turner | 24,868 | 34.0 | −13.9 | |
| Labour | Deborah Gardiner | 9,646 | 13.2 | +7.2 | |
| Referendum | Tim Bristow | 4,734 | 6.5 | N/A | |
| UKIP | Malcom Turner | 1,072 | 1.5 | N/A | |
| Independent | Harry Rees | 848 | 1.2 | N/A | |
| Green | Paul Kevin Scivier | 544 | 0.7 | N/A | |
| Natural Law | Clive Daly | 87 | 0.1 | −0.3 | |
| Rainbow Warriors | Jonathan Eveleigh | 86 | 0.1 | N/A | |
| Majority | 6,406 | 8.6 | |||
| Turnout | 74,193 | 72.0 | −7.8 | ||
| Liberal Democrat gain from Conservative | Swing | 6.6 | |||
| Party | Candidate | Votes | % | ± | |
|---|---|---|---|---|---|
| Conservative | Barry Field | 38,163 | 47.9 | −3.3 | |
| Liberal Democrat | Dr Peter Brand | 36,336 | 45.6 | +2.7 | |
| Labour | Ken Pearson | 4,784 | 6.0 | +0.1 | |
| Natural Law | Clive Daly | 350 | 0.4 | N/A | |
| Majority | 1,827 | 2.3 | −6.0 | ||
| Turnout | 79,633 | 79.8 | +0.2 | ||
| Conservative hold | Swing | −3.0 | |||
Elections in the 1980s
| Party | Candidate | Votes | % | ± | |
|---|---|---|---|---|---|
| Conservative | Barry Field | 40,175 | 51.2 | +4.9 | |
| Liberal | Michael Alan Young | 33,733 | 42.9 | −8.1 | |
| Labour | Kenn Pearson | 4,626 | 5.9 | +3.5 | |
| Majority | 6,442 | 8.3 | |||
| Turnout | 78,560 | 79.6 | |||
| Conservative gain from Liberal | Swing | ||||
| Party | Candidate | Votes | % | ± | |
|---|---|---|---|---|---|
| Liberal | Stephen Sherlock Ross | 38,407 | 51.0 | +2.8 | |
| Conservative | Virginia Bottomley | 34,904 | 46.3 | -1.4 | |
| Labour | Catherine Wilson | 1,828 | 2.4 | -1.6 | |
| Isle of Wight Residents Party | Thomas Brian Joseph McDermott | 208 | 0.3 | +0.3 | |
| Majority | 3,503 | 4.7 | |||
| Turnout | 80.0 | ||||
| Liberal hold | Swing | ||||
Elections in the 1970s
| Party | Candidate | Votes | % | ± | |
|---|---|---|---|---|---|
| Liberal | Stephen Sherlock Ross | 35,889 | 48.2 | +3.1 | |
| Conservative | Dudley Fishburn | 35,537 | 47.7 | +5.7 | |
| Labour | C Wilson | 3,014 | 4.0 | -9 | |
| Majority | 352 | ||||
| Turnout | 81.8 | ||||
| Liberal hold | Swing | ||||
| Party | Candidate | Votes | % | ± | |
|---|---|---|---|---|---|
| Liberal | Stephen Sherlock Ross | 29,697 | 45.1 | -5.1 | |
| Conservative | Dudley Fishburn | 27,657 | 42.0 | +3 | |
| Labour | L.D. Brooke | 8,562 | 13.0 | +2.2 | |
| Majority | 2,040 | ||||
| Turnout | 76.7 | ||||
| Liberal hold | Swing | ||||
| Party | Candidate | Votes | % | ± | |
|---|---|---|---|---|---|
| Liberal | Stephen Sherlock Ross | 34,808 | 50.2 | +28 | |
| Conservative | Harold Frederick Martin Woodnutt | 27,042 | 39.0 | -13.4 | |
| Labour | TC Bisson | 7,495 | 10.8 | -11.8 | |
| Majority | 7,766 | ||||
| Turnout | 81.4 | ||||
| Liberal gain from Conservative | Swing | ||||
| Party | Candidate | Votes | % | ± | |
|---|---|---|---|---|---|
| Conservative | Harold Frederick Martin Woodnutt | 30,437 | 52.4 | +3.8 | |
| Labour | Kent William Boulton | 13,111 | 22.6 | -6.4 | |
| Liberal | Stephen Sherlock Ross | 12,883 | 22.2 | -0.2 | |
| Vectis National Party | Ronald W.J Cowdell | 1,607 | 2.8 | +2.8 | |
| Majority | 17,326 | ||||
| Turnout | 72.0 | ||||
| Conservative hold | Swing | ||||
Elections in the 1960s
| Party | Candidate | Votes | % | ± | |
|---|---|---|---|---|---|
| Conservative | Harold Frederick Martin Woodnutt | 25,862 | 48.6 | -4.9 | |
| Labour | Peter Stephenson | 15,411 | 29.0 | -2.6 | |
| Liberal | Stephen Sherlock Ross | 11,915 | 22.4 | +7.5 | |
| Majority | 10,451 | 19.65 | |||
| Turnout | 75.04 | ||||
| Conservative hold | Swing | ||||
| Party | Candidate | Votes | % | ± | |
|---|---|---|---|---|---|
| Conservative | Harold Frederick Martin Woodnutt | 27,497 | 53.5 | -9.4 | |
| Labour | William Mann | 16,244 | 31.6 | -5.5 | |
| Liberal | Barbara Ellen Mary Stevenson Bliss | 7,666 | 14.9 | +14.9 | |
| Majority | 11,253 | 21.9 | |||
| Turnout | 74.3 | ||||
| Conservative hold | Swing | ||||
Elections in the 1950s
| Party | Candidate | Votes | % | ± | |
|---|---|---|---|---|---|
| Conservative | Harold Frederick Martin Woodnutt | 31,228 | 62.9 | +0.3 | |
| Labour | Edward Cecil Amey | 18,396 | 37.1 | -0.3 | |
| Majority | 12,832 | 25.9 | |||
| Turnout | 74.1 | ||||
| Conservative hold | Swing | ||||
| Party | Candidate | Votes | % | ± | |
|---|---|---|---|---|---|
| Conservative | Sir Peter Drummond Macdonald | 31,335 | 62.6 | +0.8 | |
| Labour | Sydney George Conbeer | 18,698 | 37.4 | -0.8 | |
| Majority | 12,637 | 25.3 | |||
| Turnout | 74.4 | ||||
| Conservative hold | Swing | ||||
| Party | Candidate | Votes | % | ± | |
|---|---|---|---|---|---|
| Conservative | Sir Peter Drummond Macdonald | 33,501 | 61.8 | +1.3 | |
| Labour | Sydney George Conbeer | 20,712 | 38.2 | -1.3 | |
| Majority | 12,789 | 23.6 | |||
| Turnout | 80.3 | ||||
| Conservative hold | Swing | ||||
| Party | Candidate | Votes | % | ± | |
|---|---|---|---|---|---|
| Conservative | Sir Peter Drummond Macdonald | 32,984 | 60.5 | +13.9 | |
| Labour | Sydney George Conbeer | 21,496 | 39.5 | -1.2 | |
| Majority | 11,488 | 21.1 | |||
| Turnout | 80.61 | ||||
| Conservative hold | Swing | ||||
Elections in the 1940s
| Party | Candidate | Votes | % | ± | |
|---|---|---|---|---|---|
| Conservative | Sir Peter Drummond Macdonald | 22,036 | 46.6 | -16.58 | |
| Labour | William James Miller | 19,252 | 40.7 | +3.87 | |
| Liberal | Miss. May O'Conor | 5,967 | 12.6 | +12.6 | |
| Majority | 2,784 | 5.9 | |||
| Turnout | 47,255 | 76.0 | |||
| Conservative hold | Swing | ||||
General Election 1939/40
Another general election was required to take place before the end of 1940. The political parties had been making preparations for an election to take place from 1939 and by the end of this year, the following candidates had been selected;
- Conservative: Peter Macdonald
- Labour: Robert Arthur Lyster
- Liberal: Helen de Guerry Browne
Elections in the 1930s
| Party | Candidate | Votes | % | ± | |
|---|---|---|---|---|---|
| Conservative | Sir Peter Drummond Macdonald | 26,748 | 63.18 | -14.07 | |
| Labour | William James Miller | 15,586 | 36.83 | +14.07 | |
| Majority | 11,162 | 26.37 | |||
| Turnout | 42,334 | 69.44 | |||
| Conservative hold | Swing | ||||
| Party | Candidate | Votes | % | ± | |
|---|---|---|---|---|---|
| Conservative | Peter Drummond Macdonald | 32,728 | 77.25 | +29.05 | |
| Labour | James Ekstrand Drummond | 9,639 | 22.75 | +9.05 | |
| Majority | 23,089 | 54.50 | |||
| Turnout | 71.12 | ||||
| Conservative hold | Swing | ||||
Election in the 1920s
| Party | Candidate | Votes | % | ± | |
|---|---|---|---|---|---|
| Unionist | Peter Drummond Macdonald | 21,949 | 48.2 | -4.2 | |
| Liberal | St John Hutchinson | 17,383 | 38.1 | +0.3 | |
| Labour | Henry Edward Weaver | 6,256 | 13.7 | +3.9 | |
| Majority | 4.566 | 10.1 | -4.5 | ||
| Turnout | 79.0 | ||||
| Unionist hold | Swing | -2.3 | |||
| Party | Candidate | Votes | % | ± | |
|---|---|---|---|---|---|
| Unionist | Peter Drummond Macdonald | 19,346 | 52.4 | +6.1 | |
| Liberal | Rt Hon. John Edward Bernard Seely | 13,944 | 37.8 | -8.8 | |
| Labour | Henry Edward Weaver | 3,620 | 9.8 | +2.7 | |
| Majority | 5,402 | 14.6 | 14.9 | ||
| Turnout | 80.1 | ||||
| Party | Candidate | Votes | % | ± | |
|---|---|---|---|---|---|
| Liberal | Rt Hon. John Edward Bernard Seely | 16,249 | 46.6 | +10.4 | |
| Unionist | Peter Drummond Macdonald | 16,159 | 46.3 | +14.7 | |
| Labour | Mrs E Palmer | 2,475 | 7.1 | -4.1 | |
| Majority | 90 | 0.3 | +4.3 | ||
| Turnout | 76.6 | +1.2 | |||
| Liberal hold | Swing | +2.2 | |||
| Party | Candidate | Votes | % | ± | |
|---|---|---|---|---|---|
| Liberal | Sir Edgar Chatfeild-Clarke | 12,202 | 36.2 | -4.6 | |
| Unionist | John Thomas Woolrych Perowne | 10,620 | 31.6 | -27.6 | |
| Independent Conservative | Arthur Charles Thomas Veasey | 7,061 | 21.0 | n/a | |
| Labour | Harold Charles Shearman | 3,756 | 11.2 | ||
| Majority | 1,582 | 4.6 | |||
| Turnout | 75.4 | +9.9 | |||
Election in the 1910s
| Party | Candidate | Votes | % | ± | |
|---|---|---|---|---|---|
| Conservative | Douglas Bernard Hall | 16,274 | 59.2 | +8.4 | |
| Liberal | Sir Godfrey Baring | 11,235 | 40.8 | -8.4 | |
| Majority | 5,039 | 18.4 | |||
| Turnout | 65.5 | ||||
Another General Election was required to take place before the end of 1915. The political parties had been making preparations for an election to take place and by the July 1914, the following candidates had been selected;
- Unionist: Douglas Bernard Hall
- Liberal: Sir Godfrey Baring

| Party | Candidate | Votes | % | ± | |
|---|---|---|---|---|---|
| Conservative | Douglas Bernard Hall | 7,192 | 50.8 | -0.2 | |
| Liberal | Constantine Scaramanga-Ralli | 6,969 | 49.2 | +0.2 | |
| Turnout | 14,161 | 88.7 | -2.3 | ||
| Majority | 223 | 1.6 | -0.4 | ||
| Conservative hold | Swing | -0.2 | |||
| Party | Candidate | Votes | % | ± | |
|---|---|---|---|---|---|
| Conservative | Douglas Bernard Hall | 7,414 | 51.0 | +6.8 | |
| Liberal | Godfrey Baring | 7,123 | 49.0 | -6.8 | |
| Majority | 291 | 2.0 | |||
| Turnout | 14,537 | 91.0 | |||
| Conservative gain from Liberal | Swing | +6.8 | |||
Elections in the 1900s

| Party | Candidate | Votes | % | ± | |
|---|---|---|---|---|---|
| Liberal | Godfrey Baring | 7,453 | 55.8 | n/a | |
| Conservative | Anthony Hickman Morgan | 5,892 | 44.2 | n/a | |
| Majority | 1,561 | 11.6 | n/a | ||
| Turnout | 13,345 | 87.8 | n/a | ||
| Liberal gain from Conservative | Swing | n/a | |||
| Party | Candidate | Votes | % | ± | |
|---|---|---|---|---|---|
| Independent Conservative | John Edward Bernard Seely | unopposed | n/a | n/a | |
| Independent Conservative gain from Conservative | Swing | n/a | |||
| Party | Candidate | Votes | % | ± | |
|---|---|---|---|---|---|
| Conservative | John Edward Bernard Seely | unopposed | n/a | n/a | |
| Conservative hold | Swing | n/a | |||
| Party | Candidate | Votes | % | ± | |
|---|---|---|---|---|---|
| Conservative | John Edward Bernard Seely | 6,432 | 54.5 | +2.5 | |
| Liberal | Godfrey Baring | 5,370 | 45.5 | -2.5 | |
| Majority | 1,062 | 9.0 | |||
| Turnout | 81.4 | +0.5 | |||
| Conservative hold | Swing | +2.5 | |||
See also
Notes and References
- Notes
- ↑ A county constituency (for the purposes of election expenses and type of returning officer)
- ↑ As with all constituencies, the constituency elects one Member of Parliament (MP) by the first past the post system of election at least every five years.
- References
- ↑ "Electorate Figures – Boundary Commission for England". 2011 Electorate Figures. Boundary Commission for England. 4 March 2011. Archived from the original on 6 November 2010. Retrieved 13 March 2011.
- ↑ "Wight". Oxford Dictionaries. Oxford University Press. Retrieved 2016-01-20.
- 1 2 "Electorate Figures – Boundary Commission for England". Archived from the original on 6 November 2010.
- ↑ "The Bow Group "Crossbow" – 50th Anniversary edition (page 41)" (PDF). www.bowgroup.org. Retrieved 27 October 2008.
- ↑ "Boundary Commission for England – Isle of Wight". www.statistics.gov.uk. Archived from the original on 4 July 2008. Retrieved 26 October 2008.
- ↑ Initial Proposal South East Boundary Commission for England
- 1 2 "UK General Election results – October 1974". www.politicsresources.net. Retrieved 27 October 2008.
- 1 2 "UK General Election results – May 1979". www.politicsresources.net. Retrieved 27 October 2008.
- 1 2 3 4 5 "British Parliamentary Election Results 1983–1997". www.election.demon.co.uk. Retrieved 26 October 2008.
- 1 2 3 4 "BBC News – Results and Constituencies – Isle of Wight". www.bbc.co.uk. Retrieved 27 October 2008.
- ↑ Leigh Rayment's Historical List of MPs – Constituencies beginning with "I"
- ↑ "Election Data 2015". Electoral Calculus. Archived from the original on 17 October 2015. Retrieved 17 October 2015.
- 1 2 http://electionresults.blogspot.co.uk/2013/04/isle-of-wight-2015.html
- ↑ http://iainmckie.co.uk/
- ↑ http://isleofwight.greenparty.org.uk/news/2014/11/26/isle-of-wight-green-party-announce-parliamentary-candidate/
- ↑ http://davidgoodall.org.uk/en/article/2015/1008895/campaign-launch
- ↑ http://onthewight.com/2015/01/22/ian-stephens-to-stand-as-independent-candidate-for-isle-of-wight-mp/
- ↑ Statement of Persons Nominated, Isle of Wight Council
- ↑ Island set for race to be next MP
- ↑ "IWight – Isle of Wight General election results 2005". www.iwight.gov.uk. Archived from the original on 10 September 2009. Retrieved 27 October 2008.
- ↑ "Politics Resources". Election 1992. Politics Resources. 9 April 1992. Retrieved 6 December 2010.
- ↑ "UK General Election results – February 1974". www.politicsresources.net. Retrieved 27 October 2008.
- ↑ "UK General Election results – June 1970". www.politicsresources.net. Retrieved 27 October 2008.
- ↑ "UK General Election results – March 1966". www.politicsresources.net. Retrieved 27 October 2008.
- ↑ "UK General Election results – March 1964". www.politicsresources.net. Retrieved 27 October 2008.
- ↑ "UK General Election results – October 1959". www.politicsresources.net. Retrieved 27 October 2008.
- ↑ "UK General Election results – May 1955". www.politicsresources.net. Retrieved 27 October 2008.
- ↑ "UK General Election results – October 1951". www.politicsresources.net. Retrieved 27 October 2008.
- ↑ "UK General Election results – February 1950". www.politicsresources.net. Retrieved 27 October 2008.
- ↑ "UK General Election results – July 1945". www.politicsresources.net. Retrieved 27 October 2008.
- ↑ "UK General Election results – 1935". www.politicsresources.net. Retrieved 16 September 2011.
- ↑ British parliamentary election results 1918-1949, Craig, F.W.S.
- ↑ British parliamentary election results 1885–1918
- 1 2 3 4 British parliamentary election results, 1885-1918 (Craig)
- ↑ The Constitiutional Year Book, 1904, published by Conservative Central Office, page 145 (169 in web page), Isle of Wight