East Hampshire (UK Parliament constituency)
| East Hampshire | |
|---|---|
|
County constituency for the House of Commons | |
|
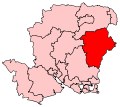
Boundary of East Hampshire in Hampshire. | |
|
Location of Hampshire within England. | |
| County | Hampshire |
| Electorate | 72,648 (December 2010)[1] |
| Current constituency | |
| Created | 1983 |
| Member of parliament | Damian Hinds (Conservative) |
| Number of members | One |
| Created from | Petersfield, Aldershot and Basingstoke[2] |
| Overlaps | |
| European Parliament constituency | South East England |

East Hampshire is a constituency[n 1] represented in the House of Commons of the UK Parliament since 2010 by Damian Hinds of the Conservative Party.[n 2]
History
East Hampshire as a seat was created in 1983 to replace the Petersfield constituency. The first MP for the seat was Michael Mates, who held the seat from 1983 until the 2010 election when he retired.
Boundaries and profile
The constituency is based on a similar area to that of the East Hampshire district, which it does not fill completely. The constituency includes the medium-sized towns of Petersfield, Alton, smaller towns of Bordon, Liss and Liphook, and a small part of the Havant borough north of Waterlooville, in turn north of Portsmouth. Much of the seat is the East Hampshire Area of Outstanding Natural Beauty. Results to date, apart from in 1997 result, suggest the seat is a Conservative Party safe seat and on national opinion-poll adjusted results, Hinds has the 28th highest share of the vote for the party in the country. The Liberal Democrats or its predecessor the Liberals have finished second in every election bar 2015 where UKIP finished second with 12.3% of the vote.[3]
Members of Parliament
| Election | Member[4] | Party | |
|---|---|---|---|
| 1983 | Michael Mates | Conservative | |
| 2010 | Damian Hinds | Conservative | |
Elections
Elections in the 2010s
| Party | Candidate | Votes | % | ± | |
|---|---|---|---|---|---|
| Conservative | Damian Hinds | 31,334 | 60.7 | +3.9 | |
| UKIP | Peter Baillie | 6,187 | 12.0 | +9.1 | |
| Liberal Democrat | Richard Robinson | 5,732 | 11.1 | −19.4 | |
| Labour | Alex Wilks | 5,220 | 10.1 | +2.2 | |
| Green | Peter Bisset | 3,176 | 6.1 | +6.1 | |
| Majority | 25,147 | 48.7 | +22.4 | ||
| Turnout | 51,649 | 71.1 | +0.1 | ||
| Conservative hold | Swing | ||||
| Party | Candidate | Votes | % | ± | |
|---|---|---|---|---|---|
| Conservative | Damian Hinds | 29,137 | 56.8 | +9.7 | |
| Liberal Democrat | Adam Carew | 15,640 | 30.5 | −3.5 | |
| Labour | Jane Edbrooke | 4,043 | 7.9 | −8.6 | |
| UKIP | Hugh McGuiness | 1,477 | 2.9 | +0.3 | |
| English Democrat | Matt Williams | 710 | 1.4 | N/A | |
| Justice & Anti-Corruption Party | Don Jerrard | 310 | 0.6 | N/A | |
| Majority | 13,467 | 26.3 | |||
| Turnout | 51,317 | 71.0 | +6.3 | ||
| Conservative hold | Swing | +6.6 | |||
Elections in the 2000s
| Party | Candidate | Votes | % | ± | |
|---|---|---|---|---|---|
| Conservative | Michael Mates | 24,273 | 45.7 | −1.9 | |
| Liberal Democrat | Ruth Bright | 18,764 | 35.3 | +5.4 | |
| Labour | Marjorie Broughton | 8,519 | 16.0 | −3.6 | |
| UKIP | David Samuel | 1,583 | 3.0 | +0.2 | |
| Majority | 5,509 | 10.4 | |||
| Turnout | 53,139 | 66.9 | +2.6 | ||
| Conservative hold | Swing | −3.7 | |||
| Party | Candidate | Votes | % | ± | |
|---|---|---|---|---|---|
| Conservative | Michael Mates | 23,950 | 47.6 | −0.4 | |
| Liberal Democrat | Robert Anthony Booker | 15,060 | 29.9 | +1.8 | |
| Labour | Mrs. Barbara Anne Burfoot | 9,866 | 19.6 | +2.5 | |
| UKIP | Stephen Ralph Coles | 1,413 | 2.8 | +1.9 | |
| Majority | 8,890 | 17.7 | |||
| Turnout | 50,289 | 64.3 | −11.3 | ||
| Conservative hold | Swing | ||||
Elections in the 1990s
| Party | Candidate | Votes | % | ± | |
|---|---|---|---|---|---|
| Conservative | Michael Mates | 27,927 | 48.0 | ||
| Liberal Democrat | Robert Anthony Booker | 16,337 | 28.1 | ||
| Labour | Robert Hoyle | 9,945 | 17.1 | ||
| Referendum | John Hayter | 2,757 | 4.7 | N/A | |
| Green | Ian Charles Foster | 649 | 1.1 | ||
| UKIP | Stephen Ralph Coles | 513 | 0.9 | N/A | |
| Majority | 11,590 | 19.94 | |||
| Turnout | 58,128 | 75.60 | |||
| Conservative hold | Swing | ||||
| Party | Candidate | Votes | % | ± | |
|---|---|---|---|---|---|
| Conservative | Michael Mates | 47,541 | 64.2 | −0.3 | |
| Liberal Democrat | Mrs. Susan Mary Baring | 18,376 | 24.8 | −4.1 | |
| Labour | James Arthur Phillips | 6,840 | 9.2 | +2.6 | |
| Green | Ian Charles Foster | 1,113 | 1.5 | +1.5 | |
| Independent | Stanley Leslie Hale | 165 | 0.2 | N/A | |
| Majority | 29,165 | 39.4 | +3.8 | ||
| Turnout | 74,035 | 79.3 | +1.9 | ||
| Conservative hold | Swing | +1.9 | |||
Elections in the 1980s
| Party | Candidate | Votes | % | ± | |
|---|---|---|---|---|---|
| Conservative | Michael Mates | 43,093 | 64.5 | +1.7 | |
| Liberal | Robert Anthony Booker | 19,307 | 28.9 | −2.8 | |
| Labour | Colin Christopher Lloyd | 4,443 | 6.7 | +1.2 | |
| Majority | 23,786 | 35.6 | |||
| Turnout | 66,843 | 77.4 | |||
| Conservative hold | Swing | ||||
| Party | Candidate | Votes | % | ± | |
|---|---|---|---|---|---|
| Conservative | Michael Mates | 36,968 | 62.8 | N/A | |
| Liberal | Rebecca Carmichael Bryan | 18,641 | 31.7 | N/A | |
| Labour | Steven John Cowan | 3,247 | 5.5 | N/A | |
| Majority | 18,327 | 31.1 | N/A | ||
| Turnout | 58,856 | 74.2 | N/A | ||
| Conservative win (new seat) | |||||
See also
Notes and references
- Notes
- ↑ A county constituency (for the purposes of election expenses and type of returning officer)
- ↑ As with all constituencies, the constituency elects one Member of Parliament (MP) by the first past the post system of election at least every five years.
- References
- ↑ "Electorate Figures - Boundary Commission for England". 2011 Electorate Figures. Boundary Commission for England. 4 March 2011. Retrieved 13 March 2011.
- ↑ "'Hampshire East', June 1983 up to May 1997". ElectionWeb Project. Cognitive Computing Limited. Retrieved 11 March 2016.
- ↑ Electoral Calculus - percentage by party columns
- ↑ Leigh Rayment's Historical List of MPs – Constituencies beginning with "H" (part 1)
- ↑ "Election Data 2015". Electoral Calculus. Archived from the original on 17 October 2015. Retrieved 17 October 2015.
- ↑ "Election Data 2010". Electoral Calculus. Archived from the original on 17 October 2015. Retrieved 17 October 2015.
- ↑ "Election Data 2005". Electoral Calculus. Archived from the original on 15 October 2011. Retrieved 18 October 2015.
- ↑ "Election Data 2001". Electoral Calculus. Archived from the original on 15 October 2011. Retrieved 18 October 2015.
- ↑ "Election Data 1997". Electoral Calculus. Archived from the original on 15 October 2011. Retrieved 18 October 2015.
- ↑ "Politics Resources". Election 1992. Politics Resources. 9 April 1992. Retrieved 2010-12-06.
- ↑ "Election Data 1992". Electoral Calculus. Archived from the original on 15 October 2011. Retrieved 18 October 2015.
- ↑ "Election Data 1987". Electoral Calculus. Archived from the original on 15 October 2011. Retrieved 18 October 2015.
- ↑ "Election Data 1983". Electoral Calculus. Archived from the original on 15 October 2011. Retrieved 18 October 2015.
Coordinates: 50°59′N 0°59′W / 50.98°N 0.98°W