Witney (UK Parliament constituency)
| Witney | |
|---|---|
|
County constituency for the House of Commons | |
|
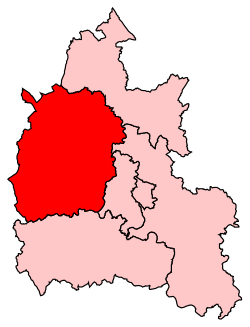
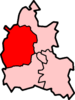
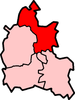
Boundary of Witney in Oxfordshire. | |
|
Location of Oxfordshire within England. | |
| County | Oxfordshire |
| Electorate | 78,220 (December 2010)[1] |
| Major settlements | Witney, Carterton, Chipping Norton and Charlbury |
| Current constituency | |
| Created | 1983 |
| Member of parliament | Robert Courts (Conservative) |
| Number of members | One |
| Created from | Mid Oxfordshire and Banbury[2] |
| Overlaps | |
| European Parliament constituency | South East England |

Witney is a county constituency in Oxfordshire represented in the House of Commons of the Parliament of the United Kingdom. It elects one Member of Parliament (MP) by the first past the post system of election, and was created for the 1983 general election. It is a safe Conservative Party seat.
The constituency was represented from 2001 to 2016 by David Cameron, who was Conservative leader from 2005 to 2016 and Prime Minister from 2010 to 2016.[3] On 12 September 2016, Cameron said that he would resign as an MP with immediate effect, triggering the 2016 Witney by-election, which was won by Robert Courts, also a Conservative, albeit with a significantly reduced majority[4]
The constituency is co-terminous with the district of West Oxfordshire and so, incorporates the towns of Carterton, Chipping Norton and Woodstock.
History
The constituency's first MP was Douglas Hurd, who served as a cabinet minister under both Margaret Thatcher and John Major, and retired in 1997. Hurd was succeeded by Shaun Woodward at the 1997 general election. However, Woodward defected to the Labour Party in 1999,[5] and Witney unexpectedly had a Labour MP. Woodward chose not to stand in Witney as a Labour candidate and moved to the Labour safe seat of St Helens South instead, following the practice of Alan Howarth in 1997.
At the 2001 general election, David Cameron was elected as MP for Witney. Cameron was re-elected to a fourth term as MP for the constituency at the 2015 general election with a majority of 25,155, the highest in his political career; on that occasion his Conservative Party won a surprise majority in the House of Commons, taking 330 seats to the opposition Labour Party's 232, and enabling them to become a majority government. However, on 24 June 2016, Cameron announced that he would resign as Prime Minister by that October due to the outcome of the EU Referendum the previous day, in which 51.9% of voters supported leaving the EU. On 12 September 2016, it was announced that Cameron would resign as MP for Witney. This triggered a by-election, which was won by Robert Courts, also a Conservative, albeit with a significantly reduced majority.
Boundaries
1983-1997: The District of West Oxfordshire wards of Ascott and Shipton, Aston Bampton and Standlake, Bampton, Bladon and Cassington, Brize Norton and Curbridge, Burford, Carterton North, Carterton South, Chadlington, Charlbury, Chipping Norton, Clanfield and Shilton, Combe and Stonesfield, Ducklington, Enstone, Eynsham, Filkins and Langford, Finstock and Leafield, Freeland and Hanborough, Hailey, Kingham, Milton-under-Wychwood, Minster Lovell, North Leigh, Rollright, Stanton Harcourt, Witney East, Witney North, Witney South, Witney West, and Woodstock, and the District of Cherwell wards of Gosford, North West Kidlington, South East Kidlington, and Yarnton.
1997-2010: The District of West Oxfordshire, and the District of Cherwell ward of Yarnton.
2010-present: The District of West Oxfordshire.
As part of the Fifth Periodic Review of Westminster constituencies the Boundary Commission reported in 2004[6] that the seat of Witney could be composed from the entire district of West Oxfordshire.[7] Seven years later[8] the Commission recommended no change.[9]
In the late 19th century, the Bampton East petty sessional division, with Witney at its heart, formed one part of the Woodstock constituency.[10]
Until 1974, much of the seat remained as part of the Woodstock and latterly Banbury constituency.[11] From 1974 to 1983, the area was included in the Mid Oxfordshire seat along with parts of Bullingdon and Ploughley. Since 1983, Witney has been a full parliamentary seat in its own right and comprises the whole of the District of West Oxfordshire with surrounding villages attached until 1997.
Carterton is the second largest populated town with 14,000 and is situated alongside RAF Brize Norton which is vital to the local economy, being one of the largest and busiest Royal Air Force stations in the country.
For the 2010 general election, the Witney Parliamentary Constituency boundaries changed and it become co-terminous with the boundaries of West Oxfordshire District Council.
Members of Parliament
| Election | Member[12] | Party | Notes | |
|---|---|---|---|---|
| 1983 | Douglas Hurd | Conservative | Later Baron Hurd of Westwell; Cabinet minister 1984–95 | |
| 1997 | Conservative | MP for St Helens South from 2001; later Secretary of State for Northern Ireland | ||
| 1999[5] | Labour | |||
| 2001 | David Cameron | Conservative | Leader of the Conservative Party 2005–2016; Prime Minister 2010–2016 | |
| 2016 | Robert Courts | Conservative | ||
Elections
Elections in the 2010s
| Party | Candidate | Votes | % | ± | |
|---|---|---|---|---|---|
| Conservative | Robert Courts | 17,313 | 45.0 | −15.2 | |
| Liberal Democrat | Liz Leffman | 11,611 | 30.2 | +23.5 | |
| Labour | Duncan Enright | 5,765 | 15.0 | −2.2 | |
| Green | Larry Sanders | 1,363 | 3.5 | −1.5 | |
| UKIP | Dickie Bird | 1,354 | 3.5 | −5.6 | |
| National Health Action | Helen Salisbury | 433 | 1.1 | 0.0 | |
| Independent | Daniel Skidmore | 151 | 0.4 | N/A | |
| Monster Raving Loony | Mad Hatter | 129 | 0.3 | N/A | |
| Independent | Nicholas Ward | 93 | 0.2 | N/A | |
| Bus-Pass Elvis | David Bishop | 61 | 0.2 | N/A | |
| Eccentric Party | Lord Toby Jug | 59 | 0.2 | N/A | |
| English Democrat | Winston McKenzie | 52 | 0.1 | N/A | |
| One Love Party | Emilia Arno | 44 | 0.1 | N/A | |
| Independent | Adam Knight | 27 | 0.1 | N/A | |
| Majority | 5,702 | 14.8 | −28.2 | ||
| Turnout | 38,492 | 46.8 | −26.5 | ||
| Conservative hold | Swing | ||||
| Party | Candidate | Votes | % | ± | |
|---|---|---|---|---|---|
| Conservative | David Cameron | 35,201 | 60.2 | +1.4 | |
| Labour | Duncan Enright | 10,046 | 17.2 | +4.2 | |
| UKIP | Simon Strutt | 5,352 | 9.2 | +5.7 | |
| Liberal Democrat | Andy Graham | 3,953 | 6.8 | −12.7 | |
| Green | Stuart Sutherland MacDonald | 2,970 | 5.1 | +0.9 | |
| National Health Action | Clive Peedell | 616 | 1.1 | N/A | |
| Wessex Regionalist | Colin Roland Bex | 110 | 0.2 | +0.1 | |
| Independent | Christopher Tompson | 94 | 0.2 | N/A | |
| Reduce VAT in Sport | Vivien Inez Saunders | 56 | 0.1 | N/A | |
| Give Me Back Elmo | Bobby Smith | 37 | 0.1 | N/A | |
| Land Party | Deek Jackson | 35 | 0.1 | N/A | |
| Independent | Nathan Paul Handley | 12 | 0.02 | N/A | |
| Majority | 25,155 | 43 | +3.6 | ||
| Turnout | 58,482 | 73.3 | +0.0 | ||
| Conservative hold | Swing | −1.4 | |||
| Party | Candidate | Votes | % | ± | |
|---|---|---|---|---|---|
| Conservative | David Cameron | 33,973 | 58.8 | +9.4 | |
| Liberal Democrat | Dawn Barnes | 11,233 | 19.4 | -3.1 | |
| Labour | Joe Goldberg | 7,511 | 13.0 | -9.4 | |
| Green | Stuart Sutherland MacDonald | 2,385 | 4.1 | +1.0 | |
| UKIP | Count Nikolai Tolstoy | 2,001 | 3.5 | +0.9 | |
| Monster Raving Loony | Howling Laud Hope | 234 | 0.3 | N/A | |
| Independent | Paul Wesson | 166 | 0.3 | N/A | |
| Independent | Johnnie Cook | 151 | 0.3 | N/A | |
| Wessex Regionalist | Colin Roland Bex | 62 | 0.1 | N/A | |
| Independent | Aaron Barschak | 53 | 0.1 | N/A | |
| Majority | 22,740 | 39.4 | +12.5 | ||
| Turnout | 57,769 | 73.3 | +4.3 | ||
| Conservative hold | Swing | +6.3 | |||
Elections in the 2000s
| Party | Candidate | Votes | % | ± | |
|---|---|---|---|---|---|
| Conservative | David Cameron | 26,571 | 49.3 | +4.3 | |
| Liberal Democrat | Liz Leffman | 12,415 | 23.0 | +2.7 | |
| Labour | Tony Gray | 11,845 | 22.0 | -6.8 | |
| Green | Richard Dossett-Davies | 1,682 | 3.2 | +0.9 | |
| UKIP | Paul Wesson | 1,356 | 2.5 | +0.9 | |
| Majority | 14,156 | 26.3 | +10.1 | ||
| Turnout | 53,869 | 69.0 | +3.1 | ||
| Conservative hold | Swing | +0.8 | |||
| Party | Candidate | Votes | % | ± | |
|---|---|---|---|---|---|
| Conservative | David Cameron | 22,153 | 45.0 | +2.0 | |
| Labour | Michael Bartlet | 14,180 | 28.8 | -1.8 | |
| Liberal Democrat | Gareth Epps | 10,000 | 20.3 | +0.5 | |
| Green | Mark Stevenson | 1,100 | 2.2 | +1.1 | |
| Independent | Barry Beadle | 1,003 | 2.0 | N/A | |
| UKIP | Kenneth Dukes | 767 | 1.6 | +0.2 | |
| Majority | 7,973 | 16.2 | +3.8 | ||
| Turnout | 49,203 | 65.9 | -10.8 | ||
| Conservative hold | Swing | +1.9 | |||
Elections in the 1990s
| Party | Candidate | Votes | % | ± | |
|---|---|---|---|---|---|
| Conservative | Shaun Woodward | 24,282 | 43.0 | -14.8 | |
| Labour | Alexander J Hollingsworth | 17,254 | 30.6 | +12.5 | |
| Liberal Democrat | Angela Lawrence | 11,202 | 19.9 | -2.7 | |
| Referendum | Geoffrey Brown | 2,262 | 4.0 | N/A | |
| UKIP | Michael Montgomery | 765 | 1.4 | N/A | |
| Green | Sue N Chapple-Perrie | 636 | 1.1 | +0.00 | |
| Majority | 7,028 | 12.4 | -27.3 | ||
| Turnout | 56,401 | 76.7 | -4.2 | ||
| Conservative hold | Swing | -13.7 | |||
| Party | Candidate | Votes | % | ± | |
|---|---|---|---|---|---|
| Conservative | Douglas Hurd | 36,256 | 56.4 | −1.1 | |
| Labour | James Plaskitt | 13,688 | 21.3 | +4.6 | |
| Liberal Democrat | Ian M. Blair | 13,393 | 20.8 | −4.9 | |
| Green | Charlotte Beckford | 716 | 1.1 | N/A | |
| Natural Law | Sally B. Catling | 134 | 0.2 | N/A | |
| Independent Conservative | Marilyn CC Brown | 119 | 0.2 | N/A | |
| Majority | 22,568 | 35.1 | +3.4 | ||
| Turnout | 64,306 | 81.9 | +4.7 | ||
| Conservative hold | Swing | −2.8 | |||
Elections in the 1980s
| Party | Candidate | Votes | % | ± | |
|---|---|---|---|---|---|
| Conservative | Douglas Hurd | 33,458 | 57.5 | +2.1 | |
| Liberal | Muriel Eda Burton | 14,994 | 25.8 | −5.1 | |
| Labour | Christine Frances Collette | 9,733 | 16.7 | +2.9 | |
| Majority | 18,464 | 31.7 | +7.2 | ||
| Turnout | 58,185 | 77.3 | +2.6 | ||
| Conservative hold | Swing | +3.6 | |||
| Party | Candidate | Votes | % | ± | |
|---|---|---|---|---|---|
| Conservative | Douglas Hurd | 28,695 | 55.4 | N/A | |
| Liberal | Philip John Baston | 15,983 | 30.8 | N/A | |
| Labour | Carole B Douse | 7,145 | 13.8 | N/A | |
| Majority | 12,712 | 24.5 | N/A | ||
| Turnout | 51,823 | 74.7 | N/A | ||
| Conservative win (new seat) | |||||
Neighbouring constituencies
 |
Stratford-on-Avon, Banbury | | ||
| The Cotswolds | |
Banbury Henley Oxford West and Abingdon | ||
| ||||
| | ||||
| Wantage |
See also
- List of Parliamentary constituencies in Oxfordshire
- Henley (UK Parliament constituency)
- Oxford East (UK Parliament constituency)
- Oxford West and Abingdon (UK Parliament constituency)
- Wantage (UK Parliament constituency)
Notes and references
- ↑ "Electorate Figures – Boundary Commission for England". 2011 Electorate Figures. Boundary Commission for England. 4 March 2011. Retrieved 13 March 2011.
- ↑ "'Witney', June 1983 up to May 1997". ElectionWeb Project. Cognitive Computing Limited. Retrieved 14 March 2016.
- ↑ "David Cameron". Witney Conservatives. 6 May 2010. Retrieved 22 December 2011.
- ↑ http://www.itv.com/news/2016-09-12/david-cameron-resigns-his-seat-as-an-mp/
- 1 2 "Anger as Tory defects to Labour". BBC News. 18 December 1999. Retrieved 5 January 2011.
- ↑ Review area- Oxfordshire Boundary Commission for England via National Archives
- ↑ Final Recommendations – Oxfordshire BCE via National Archives
- ↑ What's Proposed – Oxfordshire Boundary Commission for England
- ↑ South West recommendations BCE
- ↑ 1885 Boundary Commission map Vision of Britain
- ↑ 1917 Boundary Commission map Vision of Britain
- ↑ Leigh Rayment's Historical List of MPs – Constituencies beginning with "W" (part 5)
- ↑ West Oxfordshire District Council, "Statement of Persons Nominated and Notice of Poll"
- ↑ Britain Elects, "Witney Result"
- ↑ "Deleleration of Results of Poll" (PDF). West Oxfordshire District Council.
- ↑ "Election Data 2015". Electoral Calculus. Archived from the original on 17 October 2015. Retrieved 17 October 2015.
- ↑ http://www.westoxon.gov.uk/media/1045231/statements-of-persons-nominated-and-notice-of-poll-for-parliamentary-election-7-may-2015.pdf
- ↑ http://www.bbc.co.uk/news/politics/constituencies/E14001046
- ↑ "Election Data 2010". Electoral Calculus. Archived from the original on 26 July 2013. Retrieved 17 October 2015.
- ↑ Statement of Persons Nominated, West Oxfordshire District Council
- ↑ "2010 Witney Election Result". BBC News. 6 May 2010. Retrieved 5 January 2011.
- ↑ "Election Data 2005". Electoral Calculus. Archived from the original on 15 October 2011. Retrieved 18 October 2015.
- ↑ "Election Data 2001". Electoral Calculus. Archived from the original on 15 October 2011. Retrieved 18 October 2015.
- ↑ "Election Data 1997". Electoral Calculus. Archived from the original on 15 October 2011. Retrieved 18 October 2015.
- ↑ "Politics Resources". Election 1997. Politics Resources. 1 May 1997. Retrieved 7 January 2011.
- ↑ C. Rallings & M. Thrasher, The Media Guide to the New Parliamentary Constituencies, p.178 (Plymouth: LGC Elections Centre, 1995)
- ↑ The 1997 election result is calculated relative to the notional, not the actual, 1992 result.
- ↑ "Election Data 1992". Electoral Calculus. Archived from the original on 15 October 2011. Retrieved 18 October 2015.
- ↑ "Politics Resources". Election 1992. Politics Resources. 9 April 1992. Retrieved 6 December 2010.
- ↑ "Election Data 1987". Electoral Calculus. Archived from the original on 15 October 2011. Retrieved 18 October 2015.
- ↑ "UK General Election results June 1987". Richard Kimber's Political Science Resources. Retrieved 5 February 2011.
- ↑ "Election Data 1983". Electoral Calculus. Archived from the original on 15 October 2011. Retrieved 18 October 2015.
- ↑ "UK General Election results June 1983". Richard Kimber's Political Science Resources. Retrieved 5 February 2011.
| Parliament of the United Kingdom | ||
|---|---|---|
| Preceded by Folkestone and Hythe |
Constituency represented by the Leader of the Opposition 2005–2010 |
Succeeded by Camberwell and Peckham |
| Preceded by Kirkcaldy and Cowdenbeath |
Constituency represented by the Prime Minister 2010–2016 |
Succeeded by Maidenhead |
Coordinates: 51°48′N 1°30′W / 51.80°N 1.50°W