Epsom and Ewell (UK Parliament constituency)
| Epsom and Ewell | |
|---|---|
|
Borough constituency for the House of Commons | |
|
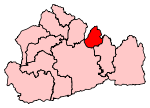
Boundary of Epsom and Ewell in Surrey for the 2010 general election. | |
|
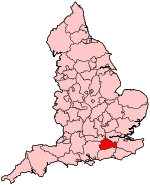
Location of Surrey within England. | |
| County | Surrey |
| Electorate | 76,916 (December 2010)[1] |
| Major settlements | Epsom, Ewell and Ashtead |
| Current constituency | |
| Created | 1974 |
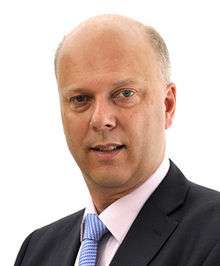
| Member of parliament | Chris Grayling (Conservative) |
| Number of members | One |
| Created from | Epsom |
| Overlaps | |
| European Parliament constituency | South East England |
Epsom and Ewell is a constituency[n 1] represented in the House of Commons of the UK Parliament since 2001 by Chris Grayling, a Conservative and the current Secretary of State for Transport. [n 2]
Boundaries
1974-1983: The Municipal Borough of Epsom and Ewell, and the Urban District of Leatherhead.
1983-1997: The Borough of Epsom and Ewell, and the Borough of Reigate and Banstead wards of Banstead Village, Nork, Preston, and Tattenhams.
1997-2010: The Borough of Epsom and Ewell, the District of Mole Valley wards of Ashtead Common, Ashtead Park, and Ashtead Village, and the Borough of Reigate and Banstead wards of Nork, Preston, and Tattenhams.
2010-present: The Borough of Epsom and Ewell, the District of Mole Valley wards of Ashtead Common, Ashtead Park, and Ashtead Village, and the Borough of Reigate and Banstead wards of Nork and Tattenhams.
- Historic boundaries
Before 1997 it lacked Ashtead but instead included Banstead from Reigate and Banstead. As the borough is small and includes steeply undulating parts such as Epsom Downs it has consistently contained areas in neighbouring Surrey districts.
- Latest boundary change
In 2005, the Boundary Commission's report led to changes for 2010. The boundary with Mole Valley moves slightly on the uninhabited portions of land by the M25 motorway adjoining Ashtead and Leatherhead, in line with local government wards. The Preston ward (in Tadworth) was transferred to Reigate to bring that constituency's electorate closer to the county average.
History
The constituency was established for the February 1974 general election, forming the centre of the previous Epsom constituency. Epsom had been held by a Conservative since its creation in the Redistribution of Seats Act 1885.
In Westminster elections, Epsom and Ewell is one of the strongest Conservative areas in the country. However locally the borough council is controlled by the Epsom and Ewell Residents Association, with the Conservatives lacking a firm base here and until recently rarely the party contested local elections. There are also a number of Residents Association councillors in the Reigate & Banstead wards in the constituency, although Mole Valley lacks Residents Association councillors.
In 1987, Barbara Follett, later Member of Parliament for Stevenage, unsuccessfully stood for the Labour Party in the constituency.
The seat is not expected to change hands in normal circumstances, unless there is a beyond landslide win for a non-Conservative party.[2]
Members of Parliament
| Election | Member[3] | Party | |
|---|---|---|---|
| Feb 1974 | constituency created | ||
| Feb 1974 | Peter Rawlinson | Conservative | |
| 1978 by-election | Sir Archie Hamilton | Conservative | |
| 2001 | Chris Grayling | Conservative | |
Elections
Elections in the 2010s
| Party | Candidate | Votes | % | ± | |
|---|---|---|---|---|---|
| Conservative | Chris Grayling | 33,309 | 58.3 | +2.1 | |
| Labour | Sheila Carlson | 8,866 | 15.5 | +3.6 | |
| UKIP | Robert Leach | 7,117 | 12.5 | +7.8 | |
| Liberal Democrat | Stephen Gee | 5,002 | 8.8 | -18.1 | |
| Green | Susan McGrath | 2,116 | 3.7 | N/A | |
| Independent | Lionel Blackman | 612 | 1.1 | N/A | |
| Independent | Gareth Harfoot | 121 | 0.2 | N/A | |
| Majority | 24,443 | 42.8 | |||
| Turnout | 57,143 | 72.7 | +2.3 | ||
| Conservative hold | Swing | +4.1 | |||
| Party | Candidate | Votes | % | ± | |
|---|---|---|---|---|---|
| Conservative | Chris Grayling | 30,868 | 56.2 | +1.8 | |
| Liberal Democrat | Jonathan Lees | 14,734 | 26.8 | +5.3 | |
| Labour | Craig Montgomery | 6,538 | 11.9 | -8.1 | |
| UKIP | Elizabeth Wallace | 2,549 | 4.6 | +1.1 | |
| Radical Reform | Peter Ticher | 266 | 0.5 | 0.5 | |
| Majority | 16,134 | 29.4 | |||
| Turnout | 54,955 | 70.4 | +4.1 | ||
| Conservative hold | Swing | +4.1 | |||
Elections in the 2000s
| Party | Candidate | Votes | % | ± | |
|---|---|---|---|---|---|
| Conservative | Chris Grayling | 27,146 | 54.4 | +6.3 | |
| Liberal Democrat | Jonathan Lees | 10,699 | 21.4 | -0.7 | |
| Labour | Charlie Mansell | 10,265 | 20.6 | -5.9 | |
| UKIP | Peter Kefford | 1,769 | 3.5 | +0.2 | |
| Majority | 16,447 | 33.0 | |||
| Turnout | 49,879 | 66.1 | 3.3 | ||
| Conservative hold | Swing | +3.5 | |||
| Party | Candidate | Votes | % | ± | |
|---|---|---|---|---|---|
| Conservative | Chris Grayling | 22,430 | 48.1 | +2.5 | |
| Labour | Charlie Mansell | 12,350 | 26.5 | +2.1 | |
| Liberal Democrat | John Vincent | 10,316 | 22.1 | -0.7 | |
| UKIP | Graham Webster-Gardiner | 1,547 | 3.3 | +2.3 | |
| Majority | 10,080 | 21.6 | |||
| Turnout | 46,643 | 62.8 | -11.2 | ||
| Conservative hold | Swing | ||||
Elections in the 1990s
| Party | Candidate | Votes | % | ± | |
|---|---|---|---|---|---|
| Conservative | Archibald Hamilton | 24,717 | 45.6 | -14.6 | |
| Labour | Philip Woodford | 13,192 | 24.3 | +8.6 | |
| Liberal Democrat | John Vincent | 12,380 | 22.8 | -0.7 | |
| Referendum | Christopher Macdonald | 2,355 | 4.3 | ||
| UKIP | Harold Green | 544 | 1.0 | ||
| Green | Hugo Charlton | 527 | 1.0 | ||
| ProLife Alliance | Katherine Weeks | 466 | 0.9 | ||
| Majority | 11,525 | 21.3 | |||
| Turnout | 54,181 | ||||
| Conservative hold | Swing | ||||
| Party | Candidate | Votes | % | ± | |
|---|---|---|---|---|---|
| Conservative | Archibald Hamilton | 32,861 | 60.2 | −2.0 | |
| Liberal Democrat | Martin P. Emerson | 12,840 | 23.5 | +0.3 | |
| Labour | Richard A. Warren | 8,577 | 15.7 | +1.2 | |
| Natural Law | GD Hatchard | 334 | 0.6 | N/A | |
| Majority | 20,021 | 36.7 | −2.3 | ||
| Turnout | 54,612 | 80.1 | +4.8 | ||
| Conservative hold | Swing | −1.2 | |||
Elections in the 1980s
| Party | Candidate | Votes | % | ± | |
|---|---|---|---|---|---|
| Conservative | Archibald Gavin Hamilton | 33,145 | 62.21 | ||
| Liberal | Margaret Jane Joachim | 12,384 | 23.24 | ||
| Labour | Daphne Barbara Follett | 7,751 | 14.55 | ||
| Majority | 20,761 | 38.97 | |||
| Turnout | 75.38 | ||||
| Conservative hold | Swing | ||||
| Party | Candidate | Votes | % | ± | |
|---|---|---|---|---|---|
| Conservative | Archibald Gavin Hamilton | 30,737 | 60.43 | ||
| Liberal | Michael Alexander John Anderson | 13,542 | 26.62 | ||
| Labour | WR Carpenter | 6,587 | 12.95 | ||
| Majority | 17,195 | 33.80 | |||
| Turnout | 72.02 | ||||
| Conservative hold | Swing | ||||
Elections in the 1970s
| Party | Candidate | Votes | % | ± | |
|---|---|---|---|---|---|
| Conservative | Archibald Hamilton | 39,104 | 61.91 | ||
| Liberal | M Anderson | 12,746 | 20.18 | ||
| Labour | Christopher Robert Smith | 11,315 | 17.91 | ||
| Majority | 26,358 | 41.73 | |||
| Turnout | 76.91 | ||||
| Conservative hold | Swing | ||||
| Party | Candidate | Votes | % | ± | |
|---|---|---|---|---|---|
| Conservative | Archibald Hamilton | 28,242 | 63.61 | +9.55 | |
| Labour | Anthony Mooney | 7,314 | 16.47 | -2.84 | |
| Liberal | Michael Alexander John Anderson | 5,673 | 12.78 | -13.85 | |
| Royalist | Jonathan King | 2,350 | 5.29 | N/A | |
| National Front | James Sawyer | 823 | 1.85 | N/A | |
| Majority | 20,928 | 47.14 | |||
| Turnout | 44,402 | ||||
| Conservative hold | Swing | ||||
| Party | Candidate | Votes | % | ± | |
|---|---|---|---|---|---|
| Conservative | Peter Rawlinson | 32,109 | 54.06 | ||
| Liberal | David Julian Hardy Griffiths | 15,819 | 26.63 | ||
| Labour | Neil Joseph Kearney | 11,471 | 19.31 | ||
| Majority | 16,290 | 27.42 | |||
| Turnout | 73.70 | ||||
| Conservative hold | Swing | ||||
| Party | Candidate | Votes | % | ± | |
|---|---|---|---|---|---|
| Conservative | Peter Rawlinson | 35,823 | 54.68 | N/A | |
| Liberal | David Julian Hardy Griffiths | 18,899 | 28.85 | N/A | |
| Labour | Neil Joseph Kearney | 10,787 | 16.5 | N/A | |
| Majority | 16,924 | 25.8 | N/A | ||
| Turnout | 82.0 | N/A | |||
| Conservative win (new seat) | |||||
See also
Notes and references
- Notes
- ↑ A borough constituency (for the purposes of election expenses and type of returning officer)
- ↑ As with all constituencies, the constituency elects one Member of Parliament (MP) by the first past the post system of election at least every five years.
- References
- ↑ "Electorate Figures - Boundary Commission for England". 2011 Electorate Figures. Boundary Commission for England. 4 March 2011. Retrieved 13 March 2011.
- ↑ 2005 Guardian Profile
- ↑ Leigh Rayment's Historical List of MPs – Constituencies beginning with "E" (part 2)
- ↑ "Election Data 2015". Electoral Calculus. Archived from the original on 17 October 2015. Retrieved 17 October 2015.
- ↑ "Election Data 2010". Electoral Calculus. Archived from the original on 17 October 2015. Retrieved 17 October 2015.
- ↑ "Election Data 2005". Electoral Calculus. Archived from the original on 15 October 2011. Retrieved 18 October 2015.
- ↑ "Election Data 2001". Electoral Calculus. Archived from the original on 15 October 2011. Retrieved 18 October 2015.
- ↑ "Election Data 1997". Electoral Calculus. Archived from the original on 15 October 2011. Retrieved 18 October 2015.
- ↑ "Election Data 1992". Electoral Calculus. Archived from the original on 15 October 2011. Retrieved 18 October 2015.
- ↑ "Politics Resources". Election 1992. Politics Resources. 9 April 1992. Retrieved 2010-12-06.
- ↑ "Election Data 1987". Electoral Calculus. Archived from the original on 15 October 2011. Retrieved 18 October 2015.
- ↑ "Election Data 1983". Electoral Calculus. Archived from the original on 15 October 2011. Retrieved 18 October 2015.
Sources
- Election result, 2015 (BBC)
- Election result, 2010 (BBC)
- Election result, 2005 (BBC)
- Election results, 1997 - 2001 (BBC)
- Election results, 1997 - 2001 (Election Demon)
- Election results, 1983 - 1992 (Election Demon)
Coordinates: 51°20′N 0°16′W / 51.33°N 0.27°W