Loughborough (UK Parliament constituency)
| Loughborough | |
|---|---|
|
County constituency for the House of Commons | |
|
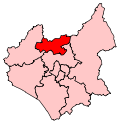
Boundary of Loughborough in Leicestershire. | |
|
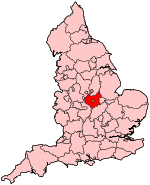
Location of Leicestershire within England. | |
| County | Leicestershire |
| Electorate | 77,884 (December 2010)[1] |
| Major settlements | Loughborough |
| Current constituency | |
| Created | 1885 |
| Member of parliament | Nicky Morgan (Conservative) |
| Number of members | One |
| Created from | North Leicestershire |
| Overlaps | |
| European Parliament constituency | East Midlands |
Loughborough is a constituency[n 1] in Leicestershire represented in the House of Commons of the UK Parliament since 2010 by Nicky Morgan, a Conservative.[n 2] The constituency is a considered a bellwether, as it has reflected the national result at every general election since February 1974.
Boundaries
1885–1918: The Sessional Division of Loughborough except the civil parishes of Cossington, Seagrave, and Sileby, and parts of the Sessional Divisions of Ashby-de-la-Zouch and Leicester.
1918–1950: The Municipal Borough of Loughborough, the Urban Districts of Ashby-de-la-Zouch, Ashby Woulds, and Shepshed, the Rural Districts of Castle Donington and Loughborough, and the Rural District of Ashby-de-la-Zouch except the civil parish of Bardon.
1950–1955: The Municipal Borough of Loughborough, the Urban Districts of Ashby-de-la-Zouch, Ashby Woulds, and Shepshed, and the Rural Districts of Ashby-de-la-Zouch and Castle Donington.
1955–1974: The Municipal Borough of Loughborough, the Urban Districts of Ashby-de-la-Zouch, Ashby Woulds, and Shepshed, the Rural District of Ashby-de-la-Zouch as constituted by the County of Leicester (Coalville Urban District) Confirmation Order 1953, and the Rural District of Castle Donington.
1974–1983: The Municipal Borough of Loughborough, the Urban Districts of Ashby-de-la-Zouch, Ashby Woulds, and Shepshed, the Rural District of Ashby-de-la-Zouch as altered by the West Midland Counties Order 1965, and the Rural District of Castle Donington as altered by the East Midland Counties Order 1965.
1983–1997: The Borough of Charnwood wards of Ashby, Barrow upon Soar and Quorndon, Birstall Goscote, Birstall Greengate, Birstall Netherhall, Birstall Riverside, Birstall Stonehill, Garendon, Hastings, Hathern, Lemyngton, Nanpantan, Mountsorrel and Rothley, Outwoods, Sileby, Southfields, Storer, The Wolds, Thurcaston, Woodhouse and Swithland, and Woodthorpe.
1997–2010: The Borough of Charnwood wards of Ashby, Barrow upon Soar and Quorndon, Garendon, Hastings, Hathern, Lemyngton, Nanpantan, Outwoods, Shepshed East, Shepshed West, Sileby, Southfields, Storer, The Wolds, and Woodthorpe.
2010–present: The Borough of Charnwood wards of Barrow and Sileby West, Loughborough Ashby, Loughborough Dishley and Hathern, Loughborough Garendon, Loughborough Hastings, Loughborough Lemyngton, Loughborough Nanpantan, Loughborough Outwoods, Loughborough Shelthorpe, Loughborough Southfields, Loughborough Storer, Quorn and Mountsorrel Castle, Shepshed East, Shepshed West, Sileby, and The Wolds.
History
Loughborough was originally part of a larger constituency, Leicestershire, which was split into two districts in the Reform Act of 1832.
In the Redistribution of Seats Act of 1885 Leicestershire was divided into five parts, Eastern (Melton), Mid [or] (Loughborough), Western (Bosworth) and Southern (Harborough), each returning one member, the last part was a borough constituency for Leicester which returned two MPs.
In 1983 the Leicestershire coalfield, an area loyal to Labour, was removed from the constituency and replaced by much of the Soar Valley, a rural area that tended to vote Conservative. Opencast coal mining is still relevant to the west of the seat only at Measham, one of the few high-profile excavations planned by Coalfield Resources PLC (formerly UK Coal). In 1995 the Soar Valley was moved to the newly created Charnwood constituency approximately reinstating the old version of the seat.
The last time that Loughborough was not represented by an MP from a governing political party was prior to the February 1974 general election, making the constituency a bellwether.
Members of Parliament
Elections
Elections in the 2010s
| Party | Candidate | Votes | % | ± | |
|---|---|---|---|---|---|
| Conservative | Nicky Morgan | 25,762 | 49.5 | +7.9 | |
| Labour | Matthew O'Callaghan | 16,579 | 31.9 | -2.6 | |
| UKIP | Bill Piper | 5,704 | 11.0 | +9.2 | |
| Liberal Democrat | Stephen Coltman[4] | 2,130 | 4.1 | -14.2 | |
| Green | Matt Sisson[5] | 1,845 | 3.5 | – | |
| Majority | 9,183 | 17.7 | +10.6 | ||
| Turnout | 52,020 | 72.6 | +4.4 | ||
| Conservative hold | Swing | +5.25 | |||
| Party | Candidate | Votes | % | ± | |
|---|---|---|---|---|---|
| Conservative | Nicky Morgan | 21,971 | 41.6 | +4.3 | |
| Labour Co-op | Andrew John Reed | 18,227 | 34.5 | -6.7 | |
| Liberal Democrat | Mike Willis | 9,675 | 18.3 | +0.4 | |
| BNP | Kevan Stafford | 2,040 | 3.9 | - | |
| UKIP | John Foden | 925 | 1.8 | -0.6 | |
| Majority | 3,744 | 7.1 | - | ||
| Turnout | 52,838 | 68.2 | +5.2 | ||
| Conservative gain from Labour Co-op | Swing | +5.5 | |||
Elections in the 2000s
The 2005 general election saw Andy Reed returned with a decreased majority after his share of the vote dropped by 8.3%. Loughborough was the 126th target seat of the Conservative Party and their share of the vote increased slightly but the Liberal Democrats had the largest increase. The swing of 5.0% from Labour to Conservative was higher than the national swing of 3.0% and turnout was above average.
| Party | Candidate | Votes | % | ± | |
|---|---|---|---|---|---|
| Labour Co-op | Andrew John Reed | 19,098 | 41.4 | −8.3 | |
| Conservative | Nicky Morgan | 17,102 | 37.1 | +1.8 | |
| Liberal Democrat | Graeme Smith | 8,258 | 17.9 | +5.1 | |
| UKIP | Bernard Sherratt | 1,094 | 2.4 | +0.3 | |
| Veritas | John McVay | 588 | 1.3 | N/A | |
| Majority | 1,996 | 4.3 | −10.1 | ||
| Turnout | 46,140 | 63.8 | +0.6 | ||
| Labour Co-op hold | Swing | −5.0 | |||
| Party | Candidate | Votes | % | ± | |
|---|---|---|---|---|---|
| Labour Co-op | Andrew John Reed | 22,016 | 49.7 | +1.2 | |
| Conservative | Neil Lyon | 15,638 | 35.3 | −2.4 | |
| Liberal Democrat | Julie Simons | 5,667 | 12.8 | +1.0 | |
| UKIP | John Bigger | 933 | 2.1 | N/A | |
| Majority | 6,378 | 14.4 | +3.5 | ||
| Turnout | 44,254 | 63.2 | −12.7 | ||
| Labour Co-op hold | Swing | +1.8 | |||
Elections in the 1990s
| Party | Candidate | Votes | % | ± | |
|---|---|---|---|---|---|
| Labour Co-op | Andrew John Reed | 25,448 | 48.6 | +8.8 | |
| Conservative | Ken Andrews | 19,736 | 37.7 | −9.1 | |
| Liberal Democrat | Diana Brass | 6,190 | 11.8 | +0.6 | |
| Referendum | Rama P. Gupta | 991 | 1.9 | N/A | |
| Majority | 5,712 | 10.9 | - | ||
| Turnout | 52,365 | 75.9 | −2.6 | ||
| Labour Co-op gain from Conservative | Swing | +8.95 | |||
| Party | Candidate | Votes | % | ± | |
|---|---|---|---|---|---|
| Conservative | Stephen Dorrell | 30,064 | 50.7 | -4.0 | |
| Labour | Andrew John Reed | 19,181 | 32.4 | +7.9 | |
| Liberal Democrat | AW Stott | 8,953 | 15.1 | -4.6 | |
| Green | I Sinclair | 817 | 1.4 | +0.3 | |
| Natural Law | P Reynolds | 233 | 0.4 | +0.4 | |
| Majority | 10,883 | 18.4 | -11.9 | ||
| Turnout | 59,248 | 78.5 | -0.7 | ||
| Conservative hold | Swing | -1.95 | |||
Elections in the 1980s
| Party | Candidate | Votes | % | ± | |
|---|---|---|---|---|---|
| Conservative | Stephen Dorrell | 31,931 | 54.7 | +1.8 | |
| Labour | Christopher John Wrigley | 14,283 | 24.5 | +1.1 | |
| SDP–Liberal Alliance (Social Democratic) | Roger Graham Fox | 11,499 | 19.7 | −2.5 | |
| Green | Rama P. Gupta | 656 | 1.1 | N/A | |
| Majority | 17,648 | 30.2 | +0.7 | ||
| Turnout | 58,369 | 79.2 | +1.5 | ||
| Conservative hold | Swing | +0.35 | |||
| Party | Candidate | Votes | % | ± | |
|---|---|---|---|---|---|
| Conservative | Stephen Dorrell | 29,056 | 52.9 | +4.9 | |
| Labour | Mike Jones | 12,876 | 23.4 | −16.2 | |
| SDP–Liberal Alliance (Social Democratic) | J.R. Frears | 12,189 | 22.2 | +11.5 | |
| Ecology | D.G. Whitebread | 591 | 1.1 | +0.1 | |
| BNP | John Peacock | 228 | 0.4 | N/A | |
| Majority | 16,180 | 29.5 | +21.1 | ||
| Turnout | 54,940 | 77.7 | −3.5 | ||
| Conservative hold | Swing | +10.55 | |||
Elections in the 1970s
| Party | Candidate | Votes | % | ± | |
|---|---|---|---|---|---|
| Conservative | Stephen Dorrell | 29,788 | 48.0 | +6.5 | |
| Labour | John Desmond Cronin | 24,589 | 39.6 | +2.4 | |
| Liberal | R. Palmer | 6,650 | 10.7 | −8.2 | |
| Ecology | D. G. Whitebread | 595 | 1.0 | N/A | |
| National Front | John Peacock | 484 | 0.8 | -1.4 | |
| Majority | 5,199 | 8.4 | - | ||
| Turnout | 62,106 | 81.2 | +2.7 | ||
| Conservative gain from Labour | Swing | +2.05 | |||
| Party | Candidate | Votes | % | ± | |
|---|---|---|---|---|---|
| Labour | John Desmond Cronin | 22,869 | 41.5 | +2.9 | |
| Conservative | R.M. York | 20,521 | 37.2 | −0.2 | |
| Liberal | M. Bennett | 10,409 | 18.9 | −5.1 | |
| National Front | K. Sanders | 1,215 | 2.2 | N/A | |
| More Prosperous Britain | H. Smith | 125 | 0.2 | N/A | |
| Majority | 2,348 | 4.3 | +3.1 | ||
| Turnout | 55,139 | 78.5 | −5.8 | ||
| Labour hold | Swing | ||||
| Party | Candidate | Votes | % | ± | |
|---|---|---|---|---|---|
| Labour | John Desmond Cronin | 22,643 | 38.6 | −6.8 | |
| Conservative | R.M. York | 21,846 | 37.4 | −6.9 | |
| Liberal | M. Bennett | 14,096 | 24.0 | +13.7 | |
| Majority | 697 | 1.2 | +0.2 | ||
| Turnout | 58,685 | 84.3 | +5.4 | ||
| Labour hold | Swing | ||||
| Party | Candidate | Votes | % | ± | |
|---|---|---|---|---|---|
| Labour | John Desmond Cronin | 22,806 | 45.4 | −4.8 | |
| Conservative | Rodney Elton | 22,272 | 44.3 | +7.3 | |
| Liberal | Jan Maria Mokrzycki | 5,185 | 10.3 | −2.6 | |
| Majority | 534 | 1.0 | −12.2 | ||
| Turnout | 50,263 | 78.9 | −3.4 | ||
| Labour hold | Swing | -6.05 | |||
Elections in the 1960s
| Party | Candidate | Votes | % | ± | |
|---|---|---|---|---|---|
| Labour | John Desmond Cronin | 22,935 | 50.2 | +2.5 | |
| Conservative | Rodney Elton | 16,911 | 37.0 | −1.2 | |
| Liberal | Brian S Stratford | 5,875 | 12.9 | −1.3 | |
| Majority | 6,024 | 13.2 | +3.7 | ||
| Turnout | 45,721 | 82.3 | −1.6 | ||
| Labour hold | Swing | ||||
| Party | Candidate | Votes | % | ± | |
|---|---|---|---|---|---|
| Labour | John Desmond Cronin | 22,081 | 47.7 | +0.5 | |
| Conservative | John L Leatham | 17,671 | 38.2 | −0.8 | |
| Liberal | G R Smedley Stevenson | 6,558 | 14.2 | +0.4 | |
| Majority | 4,410 | 9.5 | +1.3 | ||
| Turnout | 46,310 | 83.9 | −0.1 | ||
| Labour hold | Swing | ||||
Elections in the 1950s
| Party | Candidate | Votes | % | ± | |
|---|---|---|---|---|---|
| Labour | John Desmond Cronin | 21,496 | 47.2 | −7.7 | |
| Conservative | Clifford Geoffrey Waite | 17,749 | 39.0 | −6.1 | |
| Liberal | Raymond Edward Hancock | 6,303 | 13.8 | N/A | |
| Majority | 3,747 | 8.2 | −1.5 | ||
| Turnout | 45,548 | 84.0 | +1.6 | ||
| Labour hold | Swing | -0.8 | |||
| Party | Candidate | Votes | % | ± | |
|---|---|---|---|---|---|
| Labour | John Desmond Cronin | 24,044 | 54.9 | −2.1 | |
| Conservative | Michael Victor Argyle | 19,781 | 45.1 | +2.1 | |
| Majority | 4,263 | 9.7 | −4.3 | ||
| Turnout | 43,825 | 82.4 | −3.5 | ||
| Labour hold | Swing | -2.1 | |||
| Party | Candidate | Votes | % | ± | |
|---|---|---|---|---|---|
| Labour | Montefiore Follick | 25,894 | 57.0 | −0.5 | |
| Conservative | Mrs. Phylis G Spencer | 19,571 | 43.0 | +0.5 | |
| Majority | 6,323 | 13.9 | −1.1 | ||
| Turnout | 45,465 | 85.9 | −1.1 | ||
| Labour hold | Swing | -0.5 | |||
| Party | Candidate | Votes | % | ± | |
|---|---|---|---|---|---|
| Labour | Montefiore Follick | 25,921 | 57.5 | +4.2 | |
| Conservative | Samuel Field Middup | 19,196 | 42.5 | +11.2 | |
| Majority | 6,725 | 15.0 | −7.0 | ||
| Turnout | 87.0 | +12.3 | |||
| Labour hold | Swing | -3.5 | |||
Elections in the 1940s

| Party | Candidate | Votes | % | ± | |
|---|---|---|---|---|---|
| Labour | Montefiore Follick | 21,152 | 53.3 | +12.7 | |
| Conservative | Maj. Lawrence Kimball | 12,401 | 31.3 | −11.4 | |
| Liberal | Maj. Charles Alleyne Lidbury | 6,121 | 15.4 | −1.3 | |
| Majority | 8,751 | 22.0 | |||
| Turnout | 74.7 | −2.7 | |||
| Labour gain from Conservative | Swing | ||||
Elections in the 1930s
| Party | Candidate | Votes | % | ± | |
|---|---|---|---|---|---|
| Conservative | Lawrence Kimball | 15,396 | 42.7 | −18.0 | |
| Labour | George Ernest Winterton | 14,653 | 40.6 | +1.3 | |
| Liberal | Walter Meakin | 6,003 | 16.7 | N/A | |
| Majority | 743 | 2.1 | −19.3 | ||
| Turnout | 77.4 | −4.4 | |||
| Conservative hold | Swing | ||||
| Party | Candidate | Votes | % | ± | |
|---|---|---|---|---|---|
| Conservative | Lawrence Kimball | 22,310 | 60.7 | +27.8 | |
| Labour | George Ernest Winterton | 14,458 | 39.3 | −0.7 | |
| Majority | 7,852 | 21.4 | |||
| Turnout | 81.8 | −3.4 | |||
| Conservative gain from Labour | Swing | +13.9 | |||
Elections in the 1920s
| Party | Candidate | Votes | % | ± | |
|---|---|---|---|---|---|
| Labour | George Ernest Winterton | 14,854 | 40.0 | +5.1 | |
| Unionist | Frank Gibbs Rye | 12,210 | 32.9 | −7.0 | |
| Liberal | Frank Gladstone Hines | 10,044 | 27.1 | +1.9 | |
| Majority | 2,644 | 7.1 | 12.1 | ||
| Turnout | 85.2 | +1.5 | |||
| Labour gain from Unionist | Swing | +6.0 | |||
| Party | Candidate | Votes | % | ± | |
|---|---|---|---|---|---|
| Unionist | Frank Gibbs Rye | 11,114 | 39.9 | +8.4 | |
| Labour | George Ernest Winterton | 9,751 | 34.9 | +2.4 | |
| Liberal | Edward Louis Spears | 7,040 | 25.2 | −10.8 | |
| Majority | 1,363 | 5.0 | |||
| Turnout | 83.7 | +6.8 | |||
| Unionist gain from Liberal | Swing | +9.6 | |||
| Party | Candidate | Votes | % | ± | |
|---|---|---|---|---|---|
| Liberal | Edward Louis Spears | 8,937 | 36.0 | n/a | |
| Labour | George Ernest Winterton | 8,064 | 32.5 | n/a | |
| Unionist | Frank Gibbs Rye | 7,805 | 31.5 | n/a | |
| Majority | 873 | 3.5 | |||
| Turnout | 76.9 | ||||
| Liberal hold | Swing | ||||
| Party | Candidate | Votes | % | ± | |
|---|---|---|---|---|---|
| National Liberal | Edward Louis Spears | Unopposed | N/A | N/A | |
| National Liberal hold | Swing | N/A | |||
Elections in the 1910s
| Party | Candidate | Votes | % | ± | |
|---|---|---|---|---|---|
| Liberal | Oscar Montague Guest | 11,918 | 65.1 | +12.8 | |
| Labour | Herbert William Hallam | 6,381 | 34.9 | −12.8 | |
| Majority | 5,537 | 30.2 | +25.6 | ||
| Turnout | 59.8 | −30.4 | |||
| Liberal hold | Swing | ||||
| Party | Candidate | Votes | % | ± | |
|---|---|---|---|---|---|
| Liberal | Sir Maurice Levy | 6,488 | 52.3 | −0.6 | |
| Conservative | Neville Woodford Smith-Carington | 5,916 | 47.7 | +0.6 | |
| Majority | 572 | 4.6 | −1.2 | ||
| Turnout | 90.2 | −2.6 | |||
| Liberal hold | Swing | -0.6 | |||
| Party | Candidate | Votes | % | ± | |
|---|---|---|---|---|---|
| Liberal | Sir Maurice Levy | 6,760 | 52.9 | −4.6 | |
| Conservative | Neville Woodford Smith-Carington | 6,007 | 47.1 | +5.6 | |
| Majority | 753 | 5.8 | −11.2 | ||
| Turnout | 92.8 | +2.7 | |||
| Liberal hold | Swing | -5.1 | |||
Elections in the 1900s
| Party | Candidate | Votes | % | ± | |
|---|---|---|---|---|---|
| Liberal | Maurice Levy | 6,803 | 57.5 | +7.2 | |
| Conservative | William Baring du Pré | 5,023 | 42.5 | −7.2 | |
| Majority | 1,780 | 15.0 | +14.4 | ||
| Turnout | 90.1 | +5.0 | |||
| Liberal hold | Swing | ||||
| Party | Candidate | Votes | % | ± | |
|---|---|---|---|---|---|
| Liberal | Maurice Levy | 4,897 | 50.3 | −1.7 | |
| Conservative | Hussey Packe | 4,830 | 49.7 | +1.7 | |
| Majority | 67 | 0.6 | −3.4 | ||
| Turnout | 85.1 | −3.4 | |||
| Liberal hold | Swing | -1.7 | |||
Elections in the 1890s
| Party | Candidate | Votes | % | ± | |
|---|---|---|---|---|---|
| Liberal | Jabez Edward Johnson-Ferguson | 4,732 | 52.0 | −2.1 | |
| Conservative | R. L. Tooth | 4,360 | 48.0 | +2.1 | |
| Majority | 372 | 4.0 | −4.2 | ||
| Turnout | 88.5 | +2.5 | |||
| Liberal hold | Swing | -2.1 | |||
| Party | Candidate | Votes | % | ± | |
|---|---|---|---|---|---|
| Liberal | Jabez Edward Johnson-Ferguson | 4,715 | 54.1 | +4.9 | |
| Conservative | Edwin Joseph Lisle March Philipps de Lisle | 3,994 | 45.9 | −4.9 | |
| Majority | 721 | 8.2 | |||
| Turnout | 86.0 | −0.1 | |||
| Liberal gain from Conservative | Swing | ||||
Elections in the 1880s
| Party | Candidate | Votes | % | ± | |
|---|---|---|---|---|---|
| Conservative | Edwin Joseph Lisle March Philipps de Lisle | 4,075 | 50.8 | +7.0 | |
| Liberal | Jabez Edward Johnson-Ferguson | 3,940 | 49.2 | −7.0 | |
| Majority | 135 | 1.6 | |||
| Turnout | 86.1 | −4.4 | |||
| Conservative gain from Liberal | Swing | +7.0 | |||
| Party | Candidate | Votes | % | ± | |
|---|---|---|---|---|---|
| Liberal | Jabez Edward Johnson-Ferguson | 4,733 | 56.2 | N/A | |
| Conservative | Montagu Curzon | 3,693 | 43.8 | N/A | |
| Majority | 1,040 | 12.4 | N/A | ||
| Turnout | 90.5 | ||||
See also
Notes and references
- Notes
- ↑ A county constituency (for the purposes of election expenses and type of returning officer)
- ↑ As with all constituencies, the constituency elects one Member of Parliament (MP) by the first past the post system of election at least every five years.
- References
- ↑ "Electorate Figures - Boundary Commission for England". 2011 Electorate Figures. Boundary Commission for England. 4 March 2011. Retrieved 13 March 2011.
- ↑ Leigh Rayment's Historical List of MPs – Constituencies beginning with "L" (part 4)
- ↑ "Election Data 2015". Electoral Calculus. Archived from the original on 17 October 2015. Retrieved 17 October 2015.
- ↑ http://www.libdems.org.uk/general_election_candidates
- ↑ http://loughborough.greenparty.org.uk/news/2014/12/15/matt-sisson-selected-as-parliamentary-candidate-for-loughborough/
- ↑ "Election Data 2010". Electoral Calculus. Archived from the original on 17 October 2015. Retrieved 17 October 2015.
- ↑ "BBC NEWS – Election 2010 – Loughborough". BBC News.
- ↑ "Election Data 2005". Electoral Calculus. Archived from the original on 15 October 2011. Retrieved 18 October 2015.
- ↑ "Election Data 2001". Electoral Calculus. Archived from the original on 15 October 2011. Retrieved 18 October 2015.
- ↑ "Election Data 1997". Electoral Calculus. Archived from the original on 15 October 2011. Retrieved 18 October 2015.
- ↑ "Election Data 1992". Electoral Calculus. Archived from the original on 15 October 2011. Retrieved 18 October 2015.
- ↑ "Politics Resources". Election 1992. Politics Resources. 9 April 1992. Retrieved 6 Dec 2010.
- ↑ "Election Data 1987". Electoral Calculus. Archived from the original on 15 October 2011. Retrieved 18 October 2015.
- ↑ "Election Data 1983". Electoral Calculus. Archived from the original on 15 October 2011. Retrieved 18 October 2015.
Sources
- UK Genealogy Archives - History
- BBC News: Loughborough constituency - History and Boundaries
- Andy Reed MP | Loughborough Constituency - Boundaries
- British Parliamentary Election results 1983-97 - Elections (1983–1992)
- UK General Elections since 1832 - Elections (1951–1979)
- McCalmont, Frederick Haynes, Stenton Michael, Vincent, John Russell. McCalmont's parliamentary poll book: British election results. (ISBN 0-85527-000-4)
- F. W. S. Craig. British Parliamentary Election Results 1950-1973. (ISBN 0-900178-07-8)
- F. W. S. Craig. British Parliamentary Election Results 1918-1949. (ISBN 0-900178-01-9)
External links
- BBC News: Voters 'concerned' at crime rise
- Labour in Loughborough
- Loughborough Conservatives
- Loughborough Liberal Democrats
- Map showing original Loughborough constituency (1895)
Coordinates: 52°46′N 1°12′W / 52.77°N 1.20°W