United Kingdom general election, 1935
| | |||||||||||||||||||||||||||||||||||||||||||||||||||||||||||||||||||||||||||||||||||||||||||||||||||||||||||||||||||
| |||||||||||||||||||||||||||||||||||||||||||||||||||||||||||||||||||||||||||||||||||||||||||||||||||||||||||||||||||
| |||||||||||||||||||||||||||||||||||||||||||||||||||||||||||||||||||||||||||||||||||||||||||||||||||||||||||||||||||
| |||||||||||||||||||||||||||||||||||||||||||||||||||||||||||||||||||||||||||||||||||||||||||||||||||||||||||||||||||


| 1929 election • MPs |
| 1931 election • MPs |
| 1935 election • MPs |
| 1945 election • MPs |
| 1950 election • MPs |
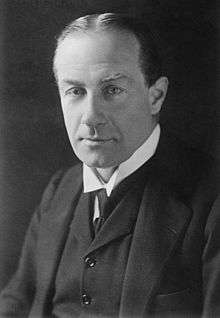
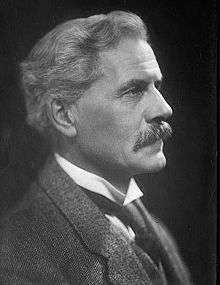
The United Kingdom general election held on Thursday, 14 November 1935 resulted in a large, though reduced, majority for the National Government now led by Conservative Stanley Baldwin. The greatest number of Members, as before, were Conservatives, while the National Liberal vote held steady. The National Labour vote collapsed, and even its leader Ramsay MacDonald lost his seat.
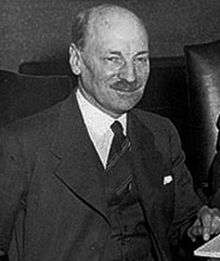
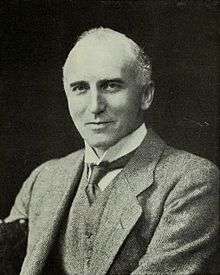
Labour, under what was then regarded internally as the caretaker leadership of Clement Attlee following the resignation of George Lansbury slightly over a month before the election, made large gains over their very poor showing in the 1931 general election. The Liberals continued their slow political collapse and lost further ground, with their leader Sir Herbert Samuel losing his own seat.
The Independent Labour Party stood entirely separately from Labour for the first time since 1895, having stood candidates unendorsed by Labour at the 1931 election and having disaffiliated fully from Labour in 1932. The Scottish National Party contested their first election, and the Communist Party gained their first parliamentary seat in almost ten years, West Fife.
The major election issues were the continuing unemployment problems and the role of the League of Nations, particularly as regarding the Empire of Japan.
No general elections were held during the Second World War until Allied victory was assured; hence the 1935 House sat until 1945. As a result, this parliament would see two leadership changes. Neville Chamberlain took over as Prime Minister and Conservative leader in 1937. He in turn resigned in 1940, when the office of Prime Minister passed to Winston Churchill, who linked the three main parties in the House of Commons in an all-party unity government for the duration of the Second World War.
Results
| Candidates | Votes | ||||||||||
|---|---|---|---|---|---|---|---|---|---|---|---|
| Party | Leader | Standing | Elected | Gained | Unseated | Net | % of total | % | No. | Net % | |
| National Government | |||||||||||
| Conservative | Stanley Baldwin | 515 | 387 | 5 | 88 | − 83 | 62.8 | 47.8 | 10,025,083 | − 7.2 | |
| Liberal National | John Simon | 44 | 33 | 5 | 7 | − 2 | 5.4 | 3.7 | 784,608 | 0.0 | |
| National Labour | Ramsay MacDonald | 20 | 8 | 1 | 6 | − 5 | 1.3 | 1.5 | 321,028 | 0.0 | |
| National | N/A | 4 | 1 | 1 | 4 | − 3 | 0.5 | 0.3 | 53,189 | − 0.2 | |
| National Government (total) | Stanley Baldwin | 583 | 429 | 69.9 | 53.3 | 11,183,908 | |||||
| Opposition | |||||||||||
| Labour | Clement Attlee | 552 | 154 | 105 | 3 | + 102 | 25.0 | 38.0 | 7,984,988 | + 7.4 | |
| Liberal | Herbert Samuel | 161 | 21 | 3 | 18 | − 11 | 3.4 | 6.7 | 1,414,010 | − 0.3 | |
| Ind. Labour Party | James Maxton | 17 | 4 | 1 | 0 | + 1 | 0.7 | 0.7 | 136,208 | − 0.5 | |
| Nationalist | T. J. Campbell | 2 | 2 | 0 | 0 | 0 | 0.3 | 0.2 | 50,747 | − 0.1 | |
| Independent Republican | N/A | 3 | 0 | 0 | 0 | 0 | 0.0 | 0.2 | 46,715 | N/A | |
| Independent National | N/A | 2 | 2 | 0 | 0 | 0 | 0.3 | 0.2 | 33,527 | N/A | |
| SNP | Alexander MacEwen | 8 | 0 | 0 | 0 | 0 | 0.0 | 0.2 | 29,517 | 0.0 | |
| Independent Conservative | N/A | 3 | 0 | 0 | 0 | 0 | 0.0 | 0.1 | 29,475 | N/A | |
| Communist | Harry Pollitt | 2 | 1 | 1 | 0 | 0 | 0.3 | 0.1 | 27,177 | − 0.2 | |
| Independent | N/A | 5 | 2 | 1 | 0 | 0 | 0.2 | 0.1 | + 0.1 | ||
| Independent Labour | N/A | 1 | 0 | 0 | 0 | 0 | 0.0 | 0.1 | 14,867 | 0.0 | |
| Liverpool Protestant | H. D. Longbottom | 1 | 0 | 0 | 0 | 0 | 0.0 | 0.0 | 6,677 | 0.0 | |
| Independent Progressive | N/A | 1 | 0 | 0 | 0 | 0 | 0.0 | 0.0 | 6,421 | N/A | |
| Social Credit | John Hargrave | 3 | 0 | 0 | 0 | 0 | 0.0 | 0.0 | 10,376 | N/A | |
| Plaid Cymru | Saunders Lewis | 1 | 0 | 0 | 0 | 0 | 0.0 | 0.0 | 2,534 | 0.0 | |
| Independent Liberal | N/A | 1 | 0 | 0 | 0 | 0 | 0.0 | 0.0 | 2,525 | 0.0 | |
| Agriculturalist | N/A | 1 | 0 | 0 | 0 | 0 | 0.0 | 0.0 | 1,771 | N/A | |
| Christian Socialist | N/A | 1 | 0 | 0 | 0 | 0 | 0.0 | 0.0 | 1,480 | N/A | |
Total votes cast: 20,991,488. Turnout 71.1%.[1] All parties shown. Conservatives include the Ulster and Scottish Unionists. Seats and votes won by the Independent Labour Party (ILP) are compared with seats and votes won by the official ILP candidates among the ILP candidates at the 1931 election who ran without national Labour Party endorsement.
Votes summary
Seats summary
Constituency Results
These are available on the Political Science Resources Elections Database, a link to which is given below.
Further reading
- F. W. S. Craig, British Electoral Facts: 1832-1987
- Fry, Geoffrey K. "A Reconsideration of the British General Election of 1935 and the Electoral Revolution of 1945," History (1991) 76#246 pp 43–55.
- Stannage, Tom. Baldwin Thwarts the Opposition: The British General Election of 1935 (1980).
See also
References
External links
| General elections |
|
|---|---|
| Local elections |
|
| European elections | |
| Referendums | |
| |