South Derbyshire (UK Parliament constituency)
| South Derbyshire | |
|---|---|
|
County constituency for the House of Commons | |
|
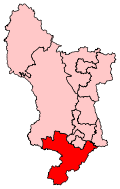
Boundary of South Derbyshire in Derbyshire. | |
|
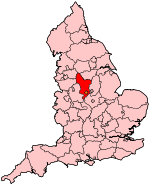
Location of Derbyshire within England. | |
| County | Derbyshire |
| Electorate | 71,326 (December 2010)[1] |
| Major settlements | Melbourne, Swadlincote, Willington |
| Current constituency | |
| Created | 1983 |
| Member of parliament | Heather Wheeler (Conservative) |
| Number of members | One |
| Created from |
Derby North Derby South Belper South East Derbyshire |
| 1832–1950 | |
| Number of members |
1832–1885: Two 1885–1950: One |
| Type of constituency | County constituency |
| Created from | Derbyshire |
| Overlaps | |
| European Parliament constituency | East Midlands |
South Derbyshire is a constituency[n 1] represented in the House of Commons of the UK Parliament since 2010 by Heather Wheeler, a Conservative.[n 2]
Boundaries
1885-1918: The Municipal Borough of Derby, the Sessional Divisions of Repton and Swadlincote, and parts of the Sessional Divisions of Ashbourne and Derby.
1918-1950: The Urban Districts of Alvaston and Boulton, Long Eaton, and Swadlincote, the Rural Districts of Hartshorne and Seals, and Shardlow, and part of the Rural District of Repton.
1983-1997: The District of South Derbyshire, and the City of Derby wards of Boulton, Chellaston, and Mickleover.
1997-2010: The District of South Derbyshire, and the City of Derby wards of Boulton and Chellaston.
2010-present: The District of South Derbyshire.

South Derbyshire constituency covers Derbyshire to the south of the city of Derby, forming a tapering salient surrounded by Staffordshire and Leicestershire.
The constituency was originally created after the Reform Act in 1832 when Derbyshire was divided into North Derbyshire and South Derbyshire.
The present constituency was created in 1983 from parts of the seats of Derby North, Derby South, Belper, and South East Derbyshire. When Parliament implemented the plans of the Boundary Commission's Fourth Periodic Review of Westminster constituencies 1995 that came into effect for 1997, Mickleover ward was transferred to Derby South. Under the Fifth Periodic Review of Westminster constituencies, approved for the 2010 general election, the constituency shed the two City of Derby wards to become coterminous with its district.[n 3]
Constituency profile
This constituency consists of rural and semi-rural settlements, including Repton (with its famous public school), in which a majority of voters have, in local elections since World War II, been Tory-voting, plus more historically industrial, and manufacturing-focussed settlements such as Swadlincote where the electorate has been for the most part Labour-voting.
Workless claimants were in November 2012 significantly lower than the national average of 3.8%, at 2.2% of the population based on a statistical compilation by The Guardian, and very close to that of the Mid Derbyshire seat, at 1.9%. Also similar is the regionally lowest jobseeker seat of Derbyshire Dales, with only 1.5% of the population registered as jobseekers.[2]
Members of Parliament
MPs 1832–1885
| Election | First member[3] | First party | Second member[3] | Second party | ||
|---|---|---|---|---|---|---|
| 1832 | Hon. George Venables-Vernon | Whig | The Lord Waterpark | Whig | ||
| 1835 | Sir George Harpur Crewe, Bt | Tory | Sir Roger Gresley, Bt | Tory | ||
| 1837 | Francis Hurt | Tory | ||||
| 1841 | Edward Miller Mundy | Conservative | Charles Robert Colvile | Peelite | ||
| 1849 by-election | William Mundy | Conservative | ||||
| 1857 | William Evans | Liberal | ||||
| 1859 | William Mundy | Conservative | ||||
| 1865 | Charles Robert Colvile | Liberal | ||||
| 1868 | Rowland Smith | Conservative | Sir Thomas Gresley, Bt | Conservative | ||
| 1869 by-election | Sir Henry Wilmot, Bt | Conservative | ||||
| 1874 | William Evans | Liberal | ||||
| 1885 | radical boundary changes, reduced to one member | |||||
MPs 1885–1950
MPs since 1983
| Election | Member[3] | Party | |
|---|---|---|---|
| 1983 | Edwina Currie | Conservative | |
| 1997 | Mark Todd | Labour | |
| 2010 | Heather Wheeler | Conservative | |
Elections
Elections in the 2010s
| Party | Candidate | Votes | % | ± | |
|---|---|---|---|---|---|
| Conservative | Heather Wheeler | 25,066 | 49.4 | +3.9 | |
| Labour | Cheryl Pidgeon[5] | 13,595 | 26.8 | −4.6 | |
| UKIP | Alan Graves[6] | 8,998 | 17.7 | +15.3 | |
| Liberal Democrat | Lorraine Johnson | 1,887 | 3.7 | −12.2 | |
| Green | Marianne Bamkin[7] | 1,216 | 2.4 | +2.4 | |
| Majority | 11,471 | 22.6 | |||
| Turnout | 50,762 | 68.2 | |||
| Conservative hold | Swing | +4.25 | |||
| Party | Candidate | Votes | % | ± | |
|---|---|---|---|---|---|
| Conservative | Heather Wheeler | 22,935 | 45.5 | +8.1 | |
| Labour | Michael Edwards | 15,807 | 31.4 | −11.5 | |
| Liberal Democrat | Alexis Diouf | 8,012 | 15.9 | +3.0 | |
| BNP | Peter Jarvis | 2,193 | 4.3 | +0.3 | |
| UKIP | Charles Swabey | 1,206 | 2.4 | +2.4 | |
| Socialist Labour | Paul Liversuch | 266 | 0.5 | +0.5 | |
| Majority | 7,128 | 14.1 | |||
| Turnout | 50,419 | 71.4 | +4.5 | ||
| Conservative gain from Labour | Swing | +9.8 | |||
Elections in the 2000s
| Party | Candidate | Votes | % | ± | |
|---|---|---|---|---|---|
| Labour | Mark Wainwright Todd | 24,823 | 44.5 | −6.2 | |
| Conservative | Simon Spencer | 20,328 | 36.4 | +0.8 | |
| Liberal Democrat | Deborah Newton-Cook | 7,600 | 13.6 | +3.5 | |
| BNP | David Joines | 1,797 | 3.2 | N/A | |
| Veritas | Edward Spalton | 1,272 | 2.3 | N/A | |
| Majority | 4,495 | 8.1 | |||
| Turnout | 55,820 | 65.6 | +1.6 | ||
| Labour hold | Swing | −3.5 | |||
| Party | Candidate | Votes | % | ± | |
|---|---|---|---|---|---|
| Labour | Mark Wainwright Todd | 26,338 | 50.7 | −3.8 | |
| Conservative | James Hakewill | 18,487 | 35.6 | +4.3 | |
| Liberal Democrat | Russell Eagling | 5,233 | 10.1 | +1.1 | |
| UKIP | John Blunt | 1,074 | 2.1 | +1.1 | |
| Socialist Labour | Paul Liversuch | 564 | 1.1 | N/A | |
| Independent | James Taylor | 249 | 0.5 | N/A | |
| Majority | 7,851 | 15.1 | |||
| Turnout | 51,945 | 64.1 | −14.1 | ||
| Labour hold | Swing | −4.1 | |||
Elections in the 1990s
| Party | Candidate | Votes | % | ± | |
|---|---|---|---|---|---|
| Labour | Mark Wainwright Todd | 32,709 | 54.5 | +10.5 | |
| Conservative | Edwina Currie | 18,742 | 31.3 | −15.9 | |
| Liberal Democrat | Rob Renold | 5,408 | 9.0 | +0.7 | |
| Referendum | Richard Anthony Edward North | 2,491 | 4.2 | N/A | |
| UKIP | Ian Edward Crompton | 617 | 1.0 | N/A | |
| Majority | 13,967 | 23.2 | |||
| Turnout | 78.2 | ||||
| Labour gain from Conservative | Swing | 13.2 | |||
| Party | Candidate | Votes | % | ± | |
|---|---|---|---|---|---|
| Conservative | Edwina Currie | 34,266 | 48.7 | −0.4 | |
| Labour | Mark Wainwright Todd | 29,608 | 42.1 | +8.8 | |
| Liberal Democrat | Ms. Diana J. Brass | 6,236 | 8.9 | −8.8 | |
| Natural Law | Titus William Mercer | 291 | 0.4 | +0.4 | |
| Majority | 4,658 | 6.6 | −9.2 | ||
| Turnout | 70,401 | 84.7 | +3.4 | ||
| Conservative hold | Swing | −4.6 | |||
Elections in the 1980s
| Party | Candidate | Votes | % | ± | |
|---|---|---|---|---|---|
| Conservative | Edwina Currie | 31,927 | 49.1 | +5.3 | |
| Labour | John David Whitby | 21,616 | 33.2 | +4.0 | |
| Social Democratic | John Edgar | 11,509 | 17.7 | −9.3 | |
| Majority | 10,311 | 15.9 | |||
| Turnout | 65,052 | 81.3 | |||
| Conservative hold | Swing | ||||
| Party | Candidate | Votes | % | ± | |
|---|---|---|---|---|---|
| Conservative | Edwina Currie | 25,909 | 43.8 | N/A | |
| Labour | Peter Anthony Kent | 17,296 | 29.2 | N/A | |
| Social Democratic | Roderick MacFarquhar | 15,959 | 27.0 | N/A | |
| Majority | 8,613 | 14.6 | N/A | ||
| Turnout | 59,164 | 78.5 | N/A | ||
| Conservative win (new seat) | |||||
Election in the 1940s
| Party | Candidate | Votes | % | ± | |
|---|---|---|---|---|---|
| Labour | Arthur Joseph Champion | 47,586 | 57.7 | ||
| Conservative | Paul Vychan Emrys-Evans | 24,636 | 29.9 | ||
| Liberal | Norman Heathcote | 10,255 | 12.4 | ||
| Majority | 22,950 | 27.8 | N/A | ||
| Turnout | 82,477 | N/A | |||
| Labour gain from Conservative | Swing | N/A | |||
Elections in the 1930s
| Party | Candidate | Votes | % | ± | |
|---|---|---|---|---|---|
| Conservative | Paul Vychan Emrys-Evans | 31,321 | 51.53 | ||
| Labour | Francis Arnold Polgrean Rowe | 29,462 | 48.47 | ||
| Majority | 1,859 | 3.06 | |||
| Turnout | 73.55 | ||||
| Conservative hold | Swing | ||||
| Party | Candidate | Votes | % | ± | |
|---|---|---|---|---|---|
| Conservative | Paul Vychan Emrys-Evans | 33,965 | 58.64 | ||
| Labour | David Graham Pole | 23,958 | 41.36 | ||
| Majority | 10,007 | 17.28 | |||
| Turnout | 82.34 | ||||
| Conservative gain from Labour | Swing | ||||
Elections in the 1920s
| Party | Candidate | Votes | % | ± | |
|---|---|---|---|---|---|
| Labour | David Graham Pole | 25,101 | 47.4 | +6.9 | |
| Unionist | Sir James Augustus Grant | 17,803 | 33.7 | -10.6 | |
| Liberal | Ebenezer Josiah Johnson | 9,998 | 18.9 | +3.7 | |
| Majority | 7,298 | 13.7 | 17.5 | ||
| Turnout | 83.4 | +1.5 | |||
| Labour gain from Unionist | Swing | +8.7 | |||
| Party | Candidate | Votes | % | ± | |
|---|---|---|---|---|---|
| Unionist | James Augustus Grant | 16,448 | |||
| Labour | Alfred Goodere | 15,033 | |||
| Liberal | Alfred Jesse Suenson-Taylor | 5,647 | |||
| Majority | |||||
| Turnout | |||||
| Unionist hold | Swing | ||||
| Party | Candidate | Votes | % | ± | |
|---|---|---|---|---|---|
| Unionist | Henry Dubs Lorimer | 12,902 | 38.5 | -4.1 | |
| Labour | Alfred Goodere | 10,919 | 32.7 | +3.1 | |
| Liberal | Gilbert Stone | 9,620 | 28.8 | +1.0 | |
| Majority | 5.8 | -7.2 | |||
| Turnout | 75.7 | -4.1 | |||
| Unionist hold | Swing | -3.6 | |||
Elections in the 1910s

| Party | Candidate | Votes | % | ± | |
|---|---|---|---|---|---|
| Liberal | Herbert Henry Raphael | 7,744 | 51.2 | -1.3 | |
| Liberal Unionist | John Bertram Marsden-Smedley | 7,373 | 48.8 | +1.3 | |
| Majority | 371 | 2.4 | -2.6 | ||
| Turnout | 87.0 | -3.6 | |||
| Liberal hold | Swing | -1.3 | |||
| Party | Candidate | Votes | % | ± | |
|---|---|---|---|---|---|
| Liberal | Herbert Henry Raphael | 8,259 | 52.5 | -2.7 | |
| Conservative | John Bertram Marsden-Smedley | 7,473 | 47.5 | +2.7 | |
| Majority | 786 | 5.0 | -5.4 | ||
| Turnout | 90.6 | +2.2 | |||
| Liberal hold | Swing | -2.7 | |||
Elections in the 1900s
| Party | Candidate | Votes | % | ± | |
|---|---|---|---|---|---|
| Liberal | Herbert Henry Raphael | 7,961 | 55.2 | ||
| Conservative | John Gretton | 6,468 | 44.8 | ||
| Majority | 1,493 | 10.4 | |||
| Turnout | 88.4 | ||||
| Liberal gain from Conservative | Swing | ||||
See also
Notes and references
- Notes
- ↑ A county constituency (for the purposes of election expenses and type of returning officer)
- ↑ As with all constituencies, the constituency elects one Member of Parliament (MP) by the first past the post system of election at least every five years.
- ↑ Boulton and Chellaston wards were transferred to Derby South, and Mickleover ward, herein from 1983 to 1997, was transferred from Derby South to Derby North.
- References
- ↑ "Electorate Figures - Boundary Commission for England". 2011 Electorate Figures. Boundary Commission for England. 4 March 2011. Retrieved 13 March 2011.
- ↑ Unemployment claimants by constituency The Guardian
- 1 2 3 4 Leigh Rayment's Historical List of MPs – Constituencies beginning with "D" (part 1)
- ↑ "Election Data 2015". Electoral Calculus. Archived from the original on 17 October 2015. Retrieved 17 October 2015.
- ↑ http://electionresults.blogspot.co.uk/2013/04/derbyshire-south-2015.html
- ↑ http://electionresults.blogspot.co.uk/2013/04/derbyshire-south-2015.html
- ↑ Marianne Bamkin, Wikimedia Commons, retrieved 10 April 2015
- ↑ "Election Data 2010". Electoral Calculus. Archived from the original on 17 October 2015. Retrieved 17 October 2015.
- ↑ "Election Data 2005". Electoral Calculus. Archived from the original on 15 October 2011. Retrieved 18 October 2015.
- ↑ "Election Data 2001". Electoral Calculus. Archived from the original on 15 October 2011. Retrieved 18 October 2015.
- ↑ "Election Data 1997". Electoral Calculus. Archived from the original on 15 October 2011. Retrieved 18 October 2015.
- ↑ "Election Data 1992". Electoral Calculus. Archived from the original on 15 October 2011. Retrieved 18 October 2015.
- ↑ "Politics Resources". Election 1992. Politics Resources. 9 April 1992. Retrieved 2010-12-06.
- ↑ "Election Data 1987". Electoral Calculus. Archived from the original on 15 October 2011. Retrieved 18 October 2015.
- ↑ "Election Data 1983". Electoral Calculus. Archived from the original on 15 October 2011. Retrieved 18 October 2015.
- ↑ British Parliamentary Election Results 1918-1949, FWS Craig
- ↑ F W S Craig, British Parliamentary Election Results 1918-1949; Political Reference Publications, Glasgow 1949
- ↑ F W S Craig, British Parliamentary Election Results 1918-1949; Political Reference Publications, Glasgow 1949
- 1 2 3 British parliamentary election results, 1885-1918 (Craig)
Coordinates: 52°48′N 1°33′W / 52.80°N 1.55°W

