Bosworth (UK Parliament constituency)
| Bosworth | |
|---|---|
|
County constituency for the House of Commons | |
|
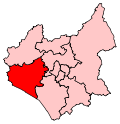
Boundary of Bosworth in Leicestershire. | |
|
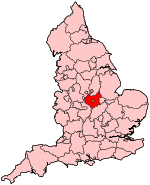
Location of Leicestershire within England. | |
| County | Leicestershire |
| Population | 98,282 (2011 census)[1] |
| Electorate | 77,787 (December 2010)[2] |
| Major settlements | Hinckley, Earl Shilton and Market Bosworth |
| Current constituency | |
| Created | 1885 |
| Member of parliament | David Tredinnick (Conservative) |
| Number of members | One |
| Created from | South Leicestershire |
| Overlaps | |
| European Parliament constituency | East Midlands |
Bosworth /bɒzwɜːrθ/ is a constituency[n 1] represented in the House of Commons of the UK Parliament since 1987 by David Tredinnick of the Conservative Party.[n 2]
Boundaries
1885-1918: The Sessional Divisions of Ashby-de-la-Zouch (except the civil parishes of Bardon, Breedon, Thringstone, Osgathorpe, and Whitwick) and Market Bosworth.
1918-1950: The Urban Districts of Coalville and Hinckley, the Rural Districts of Hinckley and Market Bosworth, and the civil parish of Bardon in the Rural District of Ashby-de-la-Zouch.
1950-1955: The Urban Districts of Coalville and Hinckley, and the Rural District of Market Bosworth.
1955-1974: The Urban District of Coalville as constituted by the County of Leicester (Coalville Urban District) Confirmation Order 1953, the Urban District of Hinckley, and the Rural District of Market Bosworth.
1974-1983: The Urban Districts of Coalville and Hinckley as altered by the West Midland Counties Order 1965, and the Rural District of Market Bosworth.
1983-1997: The Borough of Hinckley and Bosworth, and the Borough of Charnwood ward of Bradgate.
1997-2010: The Borough of Hinckley and Bosworth wards of Ambien, Bagworth, Barleston, Nailstone and Osbaston, Barwell, Burbage, Cadeby, Carlton and Market Bosworth, Castle, Clarendon, De Montfort, Desford and Peckleton, Earl Shilton, Markfield, Newbold Verdon, Sheepy and Witherley, Trinity, and Twycross and Shackerstone.
2010-present: The Borough of Hinckley and Bosworth wards of Ambien, Barlestone, Nailstone and Osbaston, Barwell, Burbage St Catherines and Lash Hill, Burbage Sketchley and Stretton, Cadeby, Carlton and Market Bosworth with Shackerstone, Earl Shilton, Hinckley Castle, Hinckley Clarendon, Hinckley De Montfort, Hinckley Trinity, Markfield, Stanton and Fieldhead, Newbold Verdon with Desford and Peckleton, Ratby, Bagworth and Thornton, and Twycross and Witherley with Sheepy.
History
The Western, or Bosworth, division was created in 1885, and included part of the Ashby de la Zouch and all of the Market Bosworth petty sessional divisions. It was redefined in 1918 to cover the urban districts of Coalville and Hinckley, the rural districts of Hinckley and Market Bosworth and the civil parish of Bardon from Ashby RD. Hinckley RD was abolished in the 1930s and in 1948 and 1970 the Bosworth constituency by which date it was shaped to eventually all of Coalville, Hinckley and Market Bosworth RD.
Coalville is part of North West Leicestershire since the 1983 election.
The seat was Labour for 25 years until the Conservatives gained it in the 1970 general election and have held it since.
Hinckley expanded greatly after World War II and is the most economically significant town other than Leicester in Leicestershire however unlike the borough the constituency retains under the independent Boundary Commission the poetic name of Bosworth, alluding to the Battle of Bosworth of the medieval Wars of the Roses which is recreated annually on the battlefield.
The seat had a coal mining tradition that however other industry, defence, trade and retail supports the residential town of Hinckley and its rural hinterland. The area of strongest Labour support is the former mining village of Earl Shilton, which is now in local elections generally over-shadowed by surrounding areas with majority-Conservative support. It was once held for Labour by Woodrow Wyatt who left the party and became one of its most voluble critics in the 1980s.
During the 2015 count a police car outside the Hinckley Leisure Centre, where the count was taking place, caught fire then exploded while being hosed down by firefighters. Five men were arrested.[3]
Members of Parliament
Elections
Elections in the 2010s
| Party | Candidate | Votes | % | ± | |
|---|---|---|---|---|---|
| Conservative | David Tredinnick[6] | 22,939 | 42.8 | +0.2 | |
| Liberal Democrat | Michael Mullaney[6] | 11,951 | 22.3 | -11.0 | |
| Labour | Chris Kealey[6] | 9,354 | 17.5 | +1.5 | |
| UKIP | David Sprason[6] | 9,338 | 17.4 | +15.4 | |
| Majority | 10,988 | 20.5 | +11.2 | ||
| Turnout | 53,582 | 67 | -3.2 | ||
| Conservative hold | Swing | +5.6 | |||
Going into the 2015 general election, this was the 180th most marginal constituency in Great Britain, the Liberal Democrats requiring a swing from the Conservatives of 4.6% to take the seat (based on the result of the 2010 general election).[7]
| Party | Candidate | Votes | % | ± | |
|---|---|---|---|---|---|
| Conservative | David Tredinnick | 23,132 | 42.6 | 0.0 | |
| Liberal Democrat | Michael Mullaney | 18,100 | 33.3 | +11.7 | |
| Labour | Rory Palmer | 8,674 | 16 | -15.9 | |
| BNP | John Ryde | 2,458 | 4.5 | +4.5 | |
| UKIP | Dutch Veldhuizen | 1,098 | 2 | -1.9 | |
| English Democrat | James Lampitt | 615 | 1.1 | +1.1 | |
| Science | Michael Brooks[9] | 197 | 0.4 | +0.4 | |
| Majority | 5,032 | 9.3 | -1.9 | ||
| Turnout | 54,274 | 70.2 | +3.8 | ||
| Conservative hold | Swing | -5.9 | |||
Elections in the 2000s
| Party | Candidate | Votes | % | ± | |
|---|---|---|---|---|---|
| Conservative | David Tredinnick | 20,212 | 42.6 | -1.8 | |
| Labour | Rupert Herd | 14,893 | 31.4 | -8.0 | |
| Liberal Democrat | James Moore | 10,528 | 22.2 | +6.0 | |
| UKIP | Denis Walker | 1,866 | 3.9 | +3.9 | |
| Majority | 5,319 | 11.2 | +6.2 | ||
| Turnout | 47,499 | 66.3 | +1.9 | ||
| Conservative hold | Swing | +3.1 | |||
| Party | Candidate | Votes | % | ± | |
|---|---|---|---|---|---|
| Conservative | David Tredinnick | 20,030 | 44.4 | +3.8 | |
| Labour | Andrew Furlong | 17,750 | 39.4 | +0.7 | |
| Liberal Democrat | Jon Ellis | 7,326 | 16.2 | -1.6 | |
| Majority | 2,280 | 5.0 | |||
| Turnout | 45,106 | 64.4 | -12.0 | ||
| Conservative hold | Swing | +1.5 | |||
Elections in the 1990s
| Party | Candidate | Votes | % | ± | |
|---|---|---|---|---|---|
| Conservative | David Tredinnick | 21,189 | 40.6 | -13.6 | |
| Labour | Andrew Furlong | 20,162 | 38.7 | +12.7 | |
| Liberal Democrat | Jon Ellis | 9,281 | 17.8 | -0.9 | |
| Referendum | Scott Halborg | 1,521 | 2.9 | N/A | |
| Majority | 1,027 | 2.0 | -26.3 | ||
| Turnout | 52,153 | 76.4 | |||
| Conservative hold | Swing | ||||
| Party | Candidate | Votes | % | ± | |
|---|---|---|---|---|---|
| Conservative | David Tredinnick | 36,618 | 54.2 | -0.2 | |
| Labour | David B. Everitt | 17,524 | 26.0 | +8.8 | |
| Liberal Democrat | Gregory M. Drozdz | 12,643 | 18.7 | -8.6 | |
| Green | Brian Fewster | 716 | 1.1 | +0.0 | |
| Majority | 19,094 | 28.3 | +1.2 | ||
| Turnout | 67,501 | 84.1 | +2.8 | ||
| Conservative hold | Swing | -4.5 | |||
Elections in the 1980s
| Party | Candidate | Votes | % | ± | |
|---|---|---|---|---|---|
| Conservative | David Tredinnick | 34,145 | 54.4 | -0.96 | |
| Liberal | David Christopher Bill | 17,129 | 27.3 | +2.2 | |
| Labour | Richard Sidney Hall | 10,787 | 17.2 | -2.26 | |
| Green | Dinah Gillian Freer | 660 | 1.0 | N/A | |
| Majority | 17,016 | 27.1 | -3.13 | ||
| Turnout | 81.26 | ||||
| Conservative hold | Swing | ||||
| Party | Candidate | Votes | % | ± | |
|---|---|---|---|---|---|
| Conservative | Adam Courtauld Butler | 31,663 | 55.4 | -7.24 | |
| Social Democratic | M. Fox | 14,369 | 25.1 | N/A | |
| Labour | Daniel J.M. Janner | 11,120 | 19.5 | +1.13 | |
| Majority | 17,294 | 30.3 | -14.05 | ||
| Turnout | 78.19 | ||||
| Conservative hold | Swing | ||||
Elections in the 1970s
| Party | Candidate | Votes | % | ± | |
|---|---|---|---|---|---|
| Conservative | Adam Courtauld Butler | 37,030 | 48.5 | ||
| Labour | Derek John Fatchett | 28,595 | 37.5 | ||
| Liberal | Thomas Edward Brown | 10,032 | 13.1 | ||
| National Front | David Henry Dunn | 682 | 0.9 | N/A | |
| Majority | 8,435 | 11.0 | |||
| Turnout | |||||
| Conservative hold | Swing | ||||
| Party | Candidate | Votes | % | ± | |
|---|---|---|---|---|---|
| Conservative | Adam Courtauld Butler | 28,490 | 41.43 | +2.04 | |
| Labour | M G M Sloman | 28,188 | 40.99 | +3.96 | |
| Liberal | M J Galton | 12,082 | 17.57 | -6.02 | |
| Majority | 302 | 0.44 | -1.92 | ||
| Turnout | 82.03 | ||||
| Conservative hold | Swing | ||||
| Party | Candidate | Votes | % | ± | |
|---|---|---|---|---|---|
| Conservative | Adam Courtauld Butler | 28,151 | 39.39 | -11.48 | |
| Labour | M G M Sloman | 26,464 | 37.03 | -12.10 | |
| Liberal | M J Galton | 16,859 | 23.59 | N/A | |
| Majority | 1,687 | 2.36 | +0.61 | ||
| Turnout | 85.99 | ||||
| Conservative hold | Swing | ||||
| Party | Candidate | Votes | % | ± | |
|---|---|---|---|---|---|
| Conservative | Adam Courtauld Butler | 30,732 | 50.87 | +14.88 | |
| Labour | Woodrow Lyle Wyatt | 29,677 | 49.13 | -1.10 | |
| Majority | 1,055 | 1.75 | -12.48 | ||
| Turnout | 77.14 | ||||
| Conservative gain from Labour | Swing | ||||
Elections in the 1960s
| Party | Candidate | Votes | % | ± | |
|---|---|---|---|---|---|
| Labour | Woodrow Lyle Wyatt | 27,427 | 50.23 | +4.64 | |
| Conservative | C J Philip Wood | 19,654 | 35.99 | +0.75 | |
| Liberal | Anthony H Extance | 7,526 | 13.78 | -5.39 | |
| Majority | 7,773 | 14.23 | +3.88 | ||
| Turnout | 79.76 | ||||
| Labour hold | Swing | ||||
| Party | Candidate | Votes | % | ± | |
|---|---|---|---|---|---|
| Labour | Woodrow Lyle Wyatt | 25,334 | 45.59 | -5.70 | |
| Conservative | Percy Laurence Braithwaite | 19,583 | 35.24 | -13.47 | |
| Liberal | John H David | 10,652 | 19.17 | N/A | |
| Majority | 5,751 | 10.35 | +7.77 | ||
| Turnout | 82.80 | ||||
| Labour hold | Swing | ||||
Elections in the 1950s
| Party | Candidate | Votes | % | ± | |
|---|---|---|---|---|---|
| Labour | Woodrow Lyle Wyatt | 27,734 | 51.29 | -2.72 | |
| Conservative | Percy Laurence Braithwaite | 26,341 | 48.71 | +2.72 | |
| Majority | 1,393 | 2.58 | -5. | ||
| Turnout | 83.05 | ||||
| Labour hold | Swing | ||||
| Party | Candidate | Votes | % | ± | |
|---|---|---|---|---|---|
| Labour | Arthur Cecil Allen | 27,626 | 54.01 | -3.08 | |
| Conservative | Donald Charles Bray | 23,526 | 45.99 | +3.08 | |
| Majority | 4,100 | 8.02 | -6.17 | ||
| Turnout | 80.73 | ||||
| Labour hold | Swing | ||||
| Party | Candidate | Votes | % | ± | |
|---|---|---|---|---|---|
| Labour | Arthur Cecil Allen | 30,767 | 57.09 | +3.45 | |
| Conservative | Donald Charles Bray | 23,122 | 42.91 | +13.62 | |
| Majority | 7,645 | 14.19 | -24.35 | ||
| Turnout | 85.42 | ||||
| Labour hold | Swing | ||||
| Party | Candidate | Votes | % | ± | |
|---|---|---|---|---|---|
| Labour | Arthur Cecil Allen | 29,282 | 53.64 | -1.99 | |
| Conservative | A Cripps | 15,988 | 29.29 | N/A | |
| Liberal | Leonard Wright Harvey | 9,315 | 17.07 | N/A | |
| Majority | 13,294 | 24.35 | +13.08 | ||
| Turnout | 88.07 | ||||
| Labour hold | Swing | ||||
Elections in the 1940s
| Party | Candidate | Votes | % | ± | |
|---|---|---|---|---|---|
| Labour | Arthur Cecil Allen | 26,151 | 55.63 | N/A | |
| Liberal National | James Millard Tucker | 20,854 | 44.37 | N/A | |
| Majority | 5,297 | 11.27 | |||
| Turnout | 77.49 | ||||
| Labour gain from Liberal National | Swing | ||||
Elections in the 1930s
| Party | Candidate | Votes | % | ± | |
|---|---|---|---|---|---|
| Liberal National | Sir William Edge | 22,969 | 59.22 | ||
| Labour | C Rothwell | 15,816 | 40.78 | ||
| Majority | 7,153 | 18.44 | |||
| Turnout | 73.33 | ||||
| Liberal National hold | Swing | ||||
| Party | Candidate | Votes | % | ± | |
|---|---|---|---|---|---|
| Liberal National | Sir William Edge | 26,926 | 68.00 | ||
| Labour | John Morgan | 12,670 | 32.00 | ||
| Majority | 14,256 | 36.00 | |||
| Turnout | 79.72 | ||||
| Liberal National gain from Liberal | Swing | ||||
Election in the 1920s
| Party | Candidate | Votes | % | ± | |
|---|---|---|---|---|---|
| Liberal | Sir William Edge | 17,044 | 41.4 | +7.8 | |
| Labour | John Minto | 15,244 | 37.0 | ||
| Unionist | Sydney Lipscomb Elborne | 8,861 | 21.5 | -13.4 | |
| Majority | 1,800 | 4.4 | |||
| Turnout | 41,149 | ||||
| Liberal hold | Swing | +10.6 | |||
- % change and swing from 1924
| Party | Candidate | Votes | % | ± | |
|---|---|---|---|---|---|
| Liberal | Sir William Edge | 11,981 | 38.2 | ||
| Labour | John Minto | 11,710 | 37.3 | ||
| Unionist | Edward Louis Spears | 7,685 | 24.5 | ||
| Majority | 271 | 0.9 | |||
| Turnout | 84.6 | ||||
| Liberal gain from Unionist | Swing | ||||
| Party | Candidate | Votes | % | ± | |
|---|---|---|---|---|---|
| Unionist | Robert Gee | 10,114 | 34.9 | ||
| Liberal | George Ward | 9,756 | 33.6 | ||
| Labour | John Minto | 9,143 | 31.5 | ||
| Majority | 358 | 1.3 | |||
| Turnout | 29,013 | ||||
| Party | Candidate | Votes | % | ± | |
|---|---|---|---|---|---|
| Liberal | George Ward | 11,596 | |||
| Unionist | Thomas Guy Frederick Paget | 8,430 | |||
| Labour | E Hughes | 8,152 | |||
| Majority | |||||
| Turnout | |||||
| Party | Candidate | Votes | % | ± | |
|---|---|---|---|---|---|
| Unionist | Thomas Guy Frederick Paget | 11,251 | |||
| Labour | Clement James Bundock | 8,740 | |||
| National Liberal | Henry Duncan McLaren | 7,513 | |||
| Majority | |||||
| Turnout | |||||
Election in the 1910s
| Party | Candidate | Votes | % | ± | |
|---|---|---|---|---|---|
| Liberal | Henry Duncan McLaren | 12,545 | |||
| Labour | Thomas Richardson | 6,344 | |||
| Majority | |||||
| Turnout | |||||
See also
Notes and references
- Notes
- ↑ A county constituency (for the purposes of election expenses and type of returning officer)
- ↑ As with all constituencies, the constituency elects one Member of Parliament (MP) by the first past the post system of election at least every five years.
- References
- ↑ "Bosworth: Usual Resident Population, 2011". Neighbourhood Statistics. Office for National Statistics. Retrieved 1 February 2015.
- ↑ "Electorate Figures - Boundary Commission for England". 2011 Electorate Figures. Boundary Commission for England. 4 March 2011. Archived from the original on 6 November 2010. Retrieved 13 March 2011.
- ↑ Pegden, Tom (8 May 2015). "Police car explodes outside General Election count". Leicester Mercury. Retrieved 8 May 2015.
- ↑ Leigh Rayment's Historical List of MPs – Constituencies beginning with "B" (part 4)
- ↑ "Election Data 2015". Electoral Calculus. Archived from the original on 17 October 2015. Retrieved 17 October 2015.
- 1 2 3 4 http://electionresults.blogspot.co.uk/2013/04/bosworth-2015.html
- ↑ Ransome Mpini; Charlotte Thornton; John Walton; Marcelo Zanni (24 February 2014). "Election 2015: The political battleground". BBC News. Retrieved 29 January 2015.
- ↑ "Election Data 2010". Electoral Calculus. Archived from the original on 26 July 2013. Retrieved 17 October 2015.
- ↑ Brooks, Michael (30 March 2010). "Taking a stand for science". The Guardian. Retrieved 1 April 2010.
- ↑ "Election Data 2005". Electoral Calculus. Archived from the original on 15 October 2011. Retrieved 18 October 2015.
- ↑ "Election Data 2001". Electoral Calculus. Archived from the original on 15 October 2011. Retrieved 18 October 2015.
- ↑ "Election Data 1997". Electoral Calculus. Archived from the original on 15 October 2011. Retrieved 18 October 2015.
- ↑ "Election Data 1992". Electoral Calculus. Archived from the original on 15 October 2011. Retrieved 18 October 2015.
- ↑ "Politics Resources". Election 1992. Politics Resources. 9 April 1992. Retrieved 6 Dec 2010.
- ↑ "Election Data 1987". Electoral Calculus. Archived from the original on 15 October 2011. Retrieved 18 October 2015.
- ↑ "Election Data 1983". Electoral Calculus. Archived from the original on 15 October 2011. Retrieved 18 October 2015.
- ↑ "'Bosworth', Feb 1974 - May 1983". ElectionWeb Project. Cognitive Computing Limited. Retrieved 18 March 2016.
External links
- nomis Constituency Profile for Bosworth — presenting data from the ONS annual population survey and other official statistics.
Coordinates: 52°36′N 1°24′W / 52.6°N 1.4°W