Rutland and Melton (UK Parliament constituency)
| Rutland and Melton | |
|---|---|
|
County constituency for the House of Commons | |
|
Boundary of Rutland and Melton in Leicestershire and Rutland. | |
|
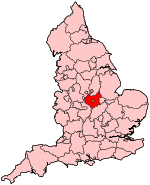
Location of Leicestershire and Rutland within England. | |
| County |
1983–1997 Leicestershire 1997–present Leicestershire and Rutland |
| Electorate | 77,324 (December 2010)[1] |
| Major settlements | Melton Mowbray, Oakham and Uppingham |
| Current constituency | |
| Created | 1983 |
| Member of parliament | Alan Duncan (Conservative) |
| Number of members | One |
| Created from | Rutland & Stamford, and Melton |
| Overlaps | |
| European Parliament constituency | East Midlands |

Rutland and Melton is a county constituency spanning Leicestershire and Rutland, represented in the House of Commons of the Parliament of the United Kingdom. It elects one Member of Parliament (MP) by the first-past-the-post system of election. The constituency was first contested in 1983. The current MP is Sir Alan Duncan. It has been considered a safe Conservative seat since its creation, continuing to elect a Conservative with a significant margin even with the 1997 national swing towards the Labour Party.
Boundaries
1983-1997: The District of Rutland, the Borough of Melton, and the Borough of Charnwood wards of East Goscote, Queniborough, Six Hills, Syston, and Thurmaston.
1997-2010: The District of Rutland, the Borough of Melton, and the District of Harborough wards of Billesdon, Easton, Houghton, Scraptoft, Thurnby, and Tilton.
2010-present: The District of Rutland, the Borough of Melton, and the District of Harborough wards of Billesdon, Nevill, Thurnby and Houghton, and Tilton.
The constituency was created in 1983 from the former seats of Rutland and Stamford and Melton. Initially it covered all of Rutland and Melton Borough and part of Charnwood. A boundary change implemented in 1997 saw the area of Charnwood replaced with part of Harborough District up to the boundary of the city of Leicester (for example Scraptoft).
Members of Parliament
| Election | Member[2] | Party | |
|---|---|---|---|
| 1983 | Michael Latham | Conservative | |
| 1992 | Sir Alan Duncan | Conservative | |
Elections
Elections in the 2010s
| Party | Candidate | Votes | % | ± | |
|---|---|---|---|---|---|
| Conservative | Alan Duncan | 30,383 | 55.6 | +4.5 | |
| UKIP | Richard Billington[5] | 8,678 | 15.9 | +11.3 | |
| Labour | James Moore | 8,383 | 15.4 | +1.1 | |
| Liberal Democrat | Ed Reynolds | 4,407 | 8.1 | -17.7 | |
| Green | Alastair McQuillan | 2,325 | 4.3 | +4.3 | |
| Independent | Marilyn Gordon | 427 | 0.8 | +0.8 | |
| Majority | 21,705 | 39.8 | +14.4 | ||
| Turnout | 54,603 | 68.4 | -3.3 | ||
| Conservative hold | Swing | -3.4 | |||
| Party | Candidate | Votes | % | ± | |
|---|---|---|---|---|---|
| Conservative | Alan Duncan | 28,228 | 51.2 | ±0.0 | |
| Liberal Democrat | Grahame Hudson | 14,228 | 25.8 | +7.2 | |
| Labour | John Morgan | 7,839 | 14.2 | −10.8 | |
| UKIP | Peter Baker | 2,526 | 4.6 | +1.4 | |
| BNP | Keith Addison | 1,757 | 3.2 | N/A | |
| Independent | Leigh Higgins | 588 | 1.1 | N/A | |
| Majority | 14,000 | 25.4 | −0.8 | ||
| Turnout | 55,166 | 71.7 | +6.7 | ||
| Conservative hold | Swing | -3.6 | |||
Elections in the 2000s
| Party | Candidate | Votes | % | ± | |
|---|---|---|---|---|---|
| Conservative | Alan Duncan | 25,237 | 51.2 | +3.1 | |
| Labour | Linda Arnold | 12,307 | 25.0 | −4.8 | |
| Liberal Democrat | Grahame Hudson | 9,153 | 18.6 | +0.8 | |
| UKIP | Peter Baker | 1,554 | 3.2 | +0.6 | |
| Veritas | Duncan Shelley | 696 | 1.4 | N/A | |
| Independent | Helen Pender | 337 | 0.7 | N/A | |
| Majority | 12,930 | 26.2 | +7.9 | ||
| Turnout | 49,284 | 65.0 | +0.8 | ||
| Conservative hold | Swing | +4.0 | |||
| Party | Candidate | Votes | % | ± | |
|---|---|---|---|---|---|
| Conservative | Alan Duncan | 22,621 | 48.1 | +2.3 | |
| Labour | Matthew O’Callaghan | 14,009 | 29.8 | +0.8 | |
| Liberal Democrat | Kim Lee | 8,386 | 17.8 | −1.4 | |
| UKIP | Peter Baker | 1,223 | 2.6 | +1.0 | |
| Green | Chris Davies | 817 | 1.7 | N/A | |
| Majority | 8,612 | 18.3 | +1.5 | ||
| Turnout | 47,056 | 64.2 | −10.7 | ||
| Conservative hold | Swing | +0.8 | |||
Elections in the 1990s
| Party | Candidate | Votes | % | ± | |
|---|---|---|---|---|---|
| Conservative | Alan Duncan | 24,107 | 45.8 | −15.6 | |
| Labour | John Meads | 15,271 | 29.0 | +8.2 | |
| Liberal Democrat | Kim Lee | 10,112 | 19.2 | +3.5 | |
| Referendum | Rupert King | 2,317 | 4.4 | N/A | |
| UKIP | Jeff Abbott | 823 | 1.6 | N/A | |
| Majority | 8,836 | 16.8 | −23.8 | ||
| Turnout | 52,630 | 75.0 | |||
| Conservative hold | Swing | -14.5 | |||
| Party | Candidate | Votes | % | ± | |
|---|---|---|---|---|---|
| Conservative | Alan Duncan | 38,603 | 59.0 | −3.0 | |
| Labour | Mrs Joan Taylor | 13,068 | 20.0 | +5.5 | |
| Liberal Democrat | Richard Lustig | 12,682 | 19.4 | −4.1 | |
| Green | Jim Berreen | 861 | 1.3 | N/A | |
| Natural Law | R Gray | 237 | 0.4 | N/A | |
| Majority | 25,535 | 39.0 | +0.5 | ||
| Turnout | 65,451 | 80.8 | +4.0 | ||
| Conservative hold | Swing | −4.2 | |||
Elections in the 1980s
| Party | Candidate | Votes | % | ± | |
|---|---|---|---|---|---|
| Conservative | Michael Latham | 37,073 | 62.0 | - | |
| Liberal | Robert Charles Renold | 14,051 | 23.5 | - | |
| Labour | Leslie Christopher Burke | 8,680 | 14.5 | - | |
| Majority | 23,022 | 38.50 | |||
| Turnout | 59,804 | 76.82 | - | ||
| Conservative hold | Swing | ||||
| Party | Candidate | Votes | % | ± | |
|---|---|---|---|---|---|
| Conservative | Michael Latham | 33,262 | 60.35 | - | |
| Liberal | David Farrer | 14,909 | 27.05 | - | |
| Labour | John Whitby | 6,414 | 11.64 | - | |
| Ecology | Heather Goddard | 532 | 0.97 | - | |
| Majority | 18,353 | 33.30 | - | ||
| Turnout | 59,804 | 73.31 | - | ||
| Conservative win (new seat) | |||||
See also
Notes and references
- ↑ "Electorate Figures - Boundary Commission for England". 2011 Electorate Figures. Boundary Commission for England. 4 March 2011. Retrieved 13 March 2011.
- ↑ Leigh Rayment's Historical List of MPs – Constituencies beginning with "R" (part 2)
- ↑ "Election Data 2015". Electoral Calculus. Archived from the original on 17 October 2015. Retrieved 17 October 2015.
- ↑ http://ukpollingreport.co.uk/2015guide/rutlandandmelton/
- ↑ http://ukpollingreport.co.uk/2015guide/rutlandandmelton/
- ↑ "Election Data 2010". Electoral Calculus. Archived from the original on 17 October 2015. Retrieved 17 October 2015.
- ↑ http://www.rutland.gov.uk/pp/pressrelease/pressdetail.asp?Id=8639
- ↑ "Politics Resources". Election 2010. Politics Resources. 6 May 2010. Retrieved 2011-01-07.
- ↑ "Election Data 2005". Electoral Calculus. Archived from the original on 15 October 2011. Retrieved 18 October 2015.
- ↑ "Election Data 2001". Electoral Calculus. Archived from the original on 15 October 2011. Retrieved 18 October 2015.
- ↑ "Election Data 1997". Electoral Calculus. Archived from the original on 15 October 2011. Retrieved 18 October 2015.
- ↑ "Politics Resources". Election 1997. Politics Resources. 1 May 1997. Retrieved 2011-01-07.
- ↑ C. Rallings & M. Thrasher, The Media Guide to the New Parliamentary Constituencies, p.142 (Plymouth: LGC Elections Centre, 1995)
- ↑ The 1997 election result is calculated relative to the notional, not the actual, 1992 result.
- ↑ "Election Data 1992". Electoral Calculus. Archived from the original on 15 October 2011. Retrieved 18 October 2015.
- ↑ "Politics Resources". Election 1992. Politics Resources. 9 April 1992. Retrieved 2010-12-06.
- ↑ "Election Data 1987". Electoral Calculus. Archived from the original on 15 October 2011. Retrieved 18 October 2015.
- ↑ "Election Data 1983". Electoral Calculus. Archived from the original on 15 October 2011. Retrieved 18 October 2015.
Coordinates: 52°42′N 0°48′W / 52.7°N 0.8°W