Leicester East (UK Parliament constituency)
| Leicester East | |
|---|---|
|
Borough constituency for the House of Commons | |
|
Boundary of Leicester East in Leicestershire. | |
|
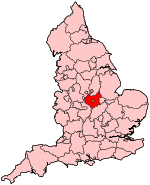
Location of Leicestershire within England. | |
| County | Leicestershire |
| Electorate | 74,377 (December 2010)[1] |
| Current constituency | |
| Created | 1974 |
| Member of parliament | Keith Vaz (Labour) |
| Number of members | One |
| Created from |
Leicester South East Leicester North East |
| 1918–1950 | |
| Number of members | One |
| Replaced by |
Leicester South East Leicester North East |
| Created from | Leicester |
| Overlaps | |
| European Parliament constituency | East Midlands |

Leicester East is a constituency[n 1] represented in the House of Commons of the UK Parliament since 1987 by Keith Vaz of the Labour Party and former Chairman of the Home Affairs Select Committee.[n 2]
Boundaries
1918-1950: The County Borough of Leicester wards of Belgrave, Latimer, Spinney Hill, and West Humberstone.
1974-1983: The County Borough of Leicester wards of Belgrave, Charnwood, Evington, Humberstone, and Latimer.
1983-2010: The City of Leicester wards of Belgrave, Charnwood, Coleman, Evington, Humberstone, Latimer, Rushey Mead, Thurncourt, and West Humberstone.
2010–2015: The City of Leicester wards of Belgrave, Charnwood, Coleman, Evington, Humberstone & Hamilton, Latimer, Rushey Mead, and Thurncourt.
Constituency profile
An urban seat in the commercial and engineering centre of Leicester. Leicester East has one of the highest Asian populations of any British constituency. In the 2001 census two-thirds of the population were non-white and 58% of people described themselves as Asian. Almost a third of the population here are Hindu, although there are also significant Muslim and Sikh minorities.
Leicester East is generally a safe Labour seat. It was briefly and narrowly held by the trenchant Conservative MP turned lay canon Peter Bruinvels at the height of the Tory party's popularity in 1983, but was regained by Labour in 1987 and has become increasingly safe since then.
History
The seat was created in 1918 and for the next four years was served by Sir Gordon Hewart KC, who in 1922 became Lord Chief Justice of England and Wales. In 1950 it was divided between two new constituencies; Leicester North East and Leicester South East, which also covered part of the present Charnwood seat and Rutland and Melton. In 1974 the seat was recreated and covers part of Leicester City Centre and its relatively compact eastern suburbs, compared to the remainder of the county.
Members of Parliament
MPs 1918–1950
MPs since 1974
| Year | Member[2] | Party | |
|---|---|---|---|
| Feb 1974 | Tom Bradley | Labour | |
| 1981 | Social Democrat | ||
| 1983 | Peter Bruinvels | Conservative | |
| 1987 | Keith Vaz | Labour | |
Elections
Elections in the 2010s
| Party | Candidate | Votes | % | ± | |
|---|---|---|---|---|---|
| Labour | Keith Vaz | 29,386 | 61.1 | +7.4 | |
| Conservative | Kishan Devani | 11,034 | 23.0 | -1.5 | |
| UKIP | Susanna Steptoe[4] | 4,290 | 8.9 | +7.4 | |
| Green | Nimit Jethwa [5] | 1,468 | 3.1 | +1.5 | |
| Liberal Democrat | Dave Raval | 1,233 | 2.6 | -11.6 | |
| TUSC | Michael Barker | 540 | 1.1 | N/A | |
| Independent | Tom Darwood | 117 | 0.2 | N/A | |
| Majority | 18,352 | 38.2 | |||
| Turnout | 48,599 | 63.7 | |||
| Labour hold | Swing | +4.5 | |||
| Party | Candidate | Votes | % | ± | |
|---|---|---|---|---|---|
| Labour | Keith Vaz | 25,804 | 53.8 | −5.0 | |
| Conservative | Jane Hunt | 11,722 | 24.4 | +4.6 | |
| Liberal Democrat | Ali Asghar | 6,817 | 14.2 | −2.3 | |
| BNP | Colin Gilmore[7] | 1,700 | 3.5 | N/A | |
| Green | Mo Taylor[8] | 733 | 1.5 | N/A | |
| UKIP | Felicity Ransome | 725 | 1.5 | N/A | |
| Unity for Peace and Socialism | Avtar Sadiq | 494 | 1.0 | N/A | |
| Majority | 14,082 | 29.3 | |||
| Turnout | 47,995 | 65.8 | +3.9 | ||
| Labour hold | Swing | −4.8 | |||
Elections in the 2000s
| Party | Candidate | Votes | % | ± | |
|---|---|---|---|---|---|
| Labour | Keith Vaz | 24,015 | 58.1 | +0.5 | |
| Conservative | Suella Fernandes | 8,139 | 19.7 | −4.8 | |
| Liberal Democrat | Susan Cooper | 7,052 | 17.1 | +4.8 | |
| Veritas | Colin Brown | 1,666 | 4.0 | N/A | |
| Socialist Labour | Valerie Smalley | 434 | 1.1 | −1.0 | |
| Majority | 15,876 | 38.4 | |||
| Turnout | 41,306 | 62.2 | +0.1 | ||
| Labour hold | Swing | +2.6 | |||
In 2005 this seat bucked the national trend as there was a swing to Labour whereas the national swing was 2.5% to the Conservatives.
| Party | Candidate | Votes | % | ± | |
|---|---|---|---|---|---|
| Labour | Keith Vaz | 23,402 | 57.6 | −7.9 | |
| Conservative | John Vincent Mugglestone | 9,960 | 24.5 | +0.5 | |
| Liberal Democrat | Harpinder Athwal | 4,989 | 12.3 | +5.3 | |
| Socialist Labour | David Paul Roberts | 837 | 2.1 | +1.1 | |
| BNP | Clive Potter | 772 | 1.9 | N/A | |
| Independent | Shirley Bennett | 701 | 1.7 | +1.5 | |
| Majority | 13,442 | 33.1 | |||
| Turnout | 40,661 | 62.1 | −7.1 | ||
| Labour hold | Swing | -4.2 | |||
Elections in the 1990s
| Party | Candidate | Votes | % | ± | |
|---|---|---|---|---|---|
| Labour | Keith Vaz | 29,083 | 65.50 | ||
| Conservative | Simon Milton | 10,661 | 24.01 | ||
| Liberal Democrat | Jay Matabudul | 3,105 | 6.99 | ||
| Referendum | Philip Iwaniw | 1,015 | 2.29 | ||
| Socialist Labour | Sohan Singh Sidhu | 436 | 0.98 | ||
| Independent | Neil Slack | 102 | 0.23 | ||
| Majority | 18,422 | 41.49 | |||
| Turnout | 69.11 | ||||
| Labour hold | Swing | +9.4 | |||
| Party | Candidate | Votes | % | ± | |
|---|---|---|---|---|---|
| Labour | Keith Vaz | 28,123 | 56.3 | +10.2 | |
| Conservative | Jeffery C. Stevens | 16,807 | 33.7 | −8.8 | |
| Liberal Democrat | Mrs Sheila A. Mitchell | 4,043 | 8.1 | −3.3 | |
| Green | Murray R. Frankland | 453 | 0.9 | +0.9 | |
| Independent | Dennis J. Taylor | 308 | 0.6 | +0.6 | |
| Natural Law | Miss ASK Mahaldar | 186 | 0.4 | +0.4 | |
| Majority | 11,316 | 22.7 | +19.0 | ||
| Turnout | 49,920 | 78.7 | +0.1 | ||
| Labour hold | Swing | +9.5 | |||
Elections in the 1980s
| Party | Candidate | Votes | % | ± | |
|---|---|---|---|---|---|
| Labour | Keith Vaz | 24,074 | 46.16 | ||
| Conservative | Peter Bruinvels | 22,150 | 42.47 | ||
| Social Democratic | Aileen Marina Ayres | 5,935 | 11.38 | ||
| Majority | 1,924 | 3.69 | |||
| Turnout | 78.59 | ||||
| Labour gain from Conservative | Swing | ||||
| Party | Candidate | Votes | % | ± | |
|---|---|---|---|---|---|
| Conservative | Peter Bruinvels | 19,117 | 38.94 | ||
| Labour | Patricia Hewitt | 18,184 | 37.04 | ||
| Social Democratic | Tom Bradley | 10,362 | 21.11 | ||
| Independent | RV Ganatra | 970 | 1.98 | ||
| BNP | RL Sutton | 459 | 0.93 | ||
| Majority | 933 | 1.90 | |||
| Turnout | 73.19 | ||||
| Conservative gain from Labour | Swing | ||||
Elections in the 1970s
| Party | Candidate | Votes | % | ± | |
|---|---|---|---|---|---|
| Labour | Tom Bradley | 23,844 | 46.90 | ||
| Conservative | M Waterhouse | 20,988 | 41.28 | ||
| Liberal | B Andrews | 4,623 | 9.09 | ||
| National Front | BJ Calver | 1,385 | 2.72 | ||
| Majority | 2,856 | 5.62 | |||
| Turnout | 75.58 | ||||
| Labour hold | Swing | ||||
| Party | Candidate | Votes | % | ± | |
|---|---|---|---|---|---|
| Labour | Tom Bradley | 20,688 | 44.78 | ||
| Conservative | KG Reeves | 16,877 | 36.53 | ||
| Liberal | W Capstick | 5,668 | 12.27 | ||
| National Front | A Reed-Herbert | 2,967 | 6.42 | ||
| Majority | 3,811 | 8.25 | |||
| Turnout | 72.30 | ||||
| Labour hold | Swing | ||||
| Party | Candidate | Votes | % | ± | |
|---|---|---|---|---|---|
| Labour | Tom Bradley | 23,474 | 47.7 | N/A | |
| Conservative | K.G. Reeves | 22,061 | 44.8 | N/A | |
| National Front | K. Sanders | 3,662 | 7.5 | N/A | |
| Majority | 1,413 | 2.9 | N/A | ||
| Turnout | 49,199 | 77.8 | N/A | ||
| Labour win (new seat) | |||||
Elections in the 1940s
| Party | Candidate | Votes | % | ± | |
|---|---|---|---|---|---|
| Labour | Terence Norbert Donovan | 28,414 | 56.94 | ||
| Conservative | Abraham Montagu Lyons | 15,182 | 30.42 | ||
| Liberal | David Goodwillie Galloway | 6,306 | 12.64 | ||
| Majority | 13,232 | 26.52 | |||
| Turnout | 76.05 | ||||
| Labour gain from Conservative | Swing | ||||
Elections in the 1930s
| Party | Candidate | Votes | % | ± | |
|---|---|---|---|---|---|
| Conservative | Abraham Montagu Lyons | 20,442 | 49.28 | ||
| Labour | F Gould | 17,532 | 42.62 | ||
| Liberal | Frederick Lawson | 3,509 | 8.46 | ||
| Majority | 2,910 | 7.01 | |||
| Turnout | 70.18 | ||||
| Conservative hold | Swing | ||||
| Party | Candidate | Votes | % | ± | |
|---|---|---|---|---|---|
| Conservative | Abraham Montagu Lyons | 30,265 | 68.67 | ||
| Labour | Edward Frank Wise | 13,811 | 31.33 | ||
| Majority | 16,454 | 37.33 | |||
| Turnout | 79.10 | ||||
| Conservative gain from Labour | Swing | ||||
Elections in the 1920s
| Party | Candidate | Votes | % | ± | |
|---|---|---|---|---|---|
| Labour | Edward Frank Wise | 22,533 | 50.8 | ||
| Unionist | John de Vere Loder | 13,801 | 31.1 | ||
| Liberal | Frederick Lawson | 8,054 | 18.1 | n/a | |
| Majority | 8,732 | 19.7 | |||
| Turnout | |||||
| Labour gain from Unionist | Swing | ||||
| Party | Candidate | Votes | % | ± | |
|---|---|---|---|---|---|
| Labour | George Banton | 13,162 | 44.8 | ||
| Unionist | Henry Arthur Evans | 8,247 | 28.0 | ||
| Liberal | James Henderson Stewart | 7,998 | 27.2 | n/a | |
| Majority | 4,915 | 16.8 | |||
| Turnout | 76.1 | ||||
| Labour gain from Unionist | Swing | ||||
| Party | Candidate | Votes | % | ± | |
|---|---|---|---|---|---|
| Labour | George Banton | 14,062 | 52.9 | +25.8 | |
| Coalition Liberal | Albert E. Marlow | 8,710 | 32.8 | n/a | |
| Liberal | Ronald Wilberforce Allen | 3,825 | 14.4 | n/a | |
| Majority | 5,352 | 20.1 | |||
| Turnout | 71.3 | +5.7 | |||
| Labour gain from Coalition Liberal | Swing | n/a | |||
See also
Notes
- ↑ A borough constituency (for the purposes of election expenses and type of returning officer)
- ↑ As with all constituencies, the constituency elects one Member of Parliament (MP) by the first past the post system of election at least every five years.
References
- ↑ "2011 Electorate Figures". Boundary Commission for England. 4 March 2011. Archived from the original on 6 November 2010. Retrieved 13 March 2011.
- 1 2 Leigh Rayment's Historical List of MPs – Constituencies beginning with "L" (part 2)
- ↑ "Election Data 2015". Electoral Calculus. Archived from the original on 17 October 2015. Retrieved 17 October 2015.
- ↑ "Leicester East 2015 Result". UK Polling Report. Retrieved 24 June 2016.
- ↑ "Nimit Jethwa". Green Party.
- ↑ "Election Data 2010". Electoral Calculus. Archived from the original on 26 July 2013. Retrieved 17 October 2015.
- ↑ "Full slate in Leicestershire as BNP candidate nominated in Leicester East". BNP. March 2010. Archived from the original on 30 March 2010.
- ↑ "Green Candidate Mo Taylor for Leicester East". Green Party. Archived from the original on 6 March 2012. Retrieved 24 June 2016.
- ↑ "Election Data 2005". Electoral Calculus. Archived from the original on 15 October 2011. Retrieved 18 October 2015.
- ↑ "Election Data 2001". Electoral Calculus. Archived from the original on 15 October 2011. Retrieved 18 October 2015.
- ↑ "Election Data 1997". Electoral Calculus. Archived from the original on 15 October 2011. Retrieved 18 October 2015.
- ↑ "Election Data 1992". Electoral Calculus. Archived from the original on 15 October 2011. Retrieved 18 October 2015.
- ↑ "General Election 1992". Politics Resources. 9 April 1992. Retrieved 6 December 2010.
- ↑ "Election Data 1987". Electoral Calculus. Archived from the original on 15 October 2011. Retrieved 18 October 2015.
- ↑ "Election Data 1983". Electoral Calculus. Archived from the original on 15 October 2011. Retrieved 18 October 2015.
- ↑ "UK General Election results: February 1974 [Archive]". Politics Resources. Retrieved 24 June 2016.
- 1 2 3 Craig, F. W. S. (1969). British Parliamentary Election Results 1918-1949. Glasgow: Political Reference Publications.
Coordinates: 52°38′N 1°05′W / 52.64°N 1.08°W