United Kingdom general election, 1964
|
|
|
|
|

|
| Colours denote the winning party, as shown in the main table of results. |
|
|
The United Kingdom general election of 1964 was won by the Labour Party with an overall majority of four seats. The election was held on 15 October 1964, just over five years after the previous election, and 13 years after the Conservative Party had retaken power.
Background
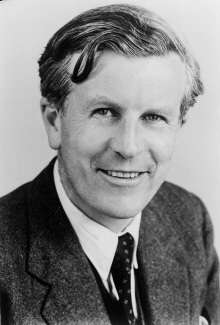
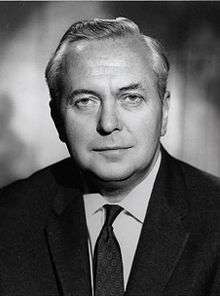
Both major parties had changed leaders in 1963: after the sudden death of Hugh Gaitskell early in the year, Labour chose Harold Wilson (who was then thought of as being on the party's centre-left), while Sir Alec Douglas-Home (then the Earl of Home) had taken over as Conservative leader and prime minister in the autumn after Harold Macmillan announced his resignation. Douglas-Home shortly afterwards disclaimed his title under the Peerage Act 1963 in order to lead the party from the Commons.
Macmillan had led the Conservatives in government since January 1957. Despite initial popularity and a resounding election victory in 1959, he had become increasingly unpopular in the early 1960s, and Douglas-Home faced a difficult task in rebuilding the party's popularity with just a year elapsing between taking office and having to face a general election. Wilson had begun to try to tie the Labour Party to the growing confidence of Britain in the 1960s, asserting that the "white heat of revolution" would sweep away "restrictive practices... on both sides of industry". The Liberal Party enjoyed a resurgence after a virtual wipeout in the 1950s, and doubled its share of the vote, primarily at the expense of the Conservatives. Although Labour did not increase its vote share significantly, the fall in support for the Conservatives led to Wilson securing an overall majority of four seats.[1] This proved to be unworkable and Wilson called a snap election in 1966.
Campaign
The pre-election campaign was prolonged, as Douglas-Home delayed calling a general election to give himself as much time as possible to improve the prospects of his party. The election campaign formally began on 15 September 1964 when Douglas-Home saw the Queen and asked for a dissolution of Parliament. The campaign was dominated by some of the more voluble characters of the political scene at the time. While George Brown, Deputy Leader of the Labour Party, toured the country making energetic speeches (and the occasional gaffe), Quintin Hogg was a leading spokesman for the Conservatives. The image of Hogg lashing out at a Wilson poster with his walking stick was one of the most striking of the campaign. Many party speakers, especially at televised rallies, had to deal with hecklers: in particular Douglas-Home was treated very roughly at a meeting in Birmingham.
The election night was broadcast live by the BBC, and was presented by Richard Dimbleby, with Robin Day, Ian Trethowan, Cliff Michelmore and David Butler.[2]
Opinion poll summary
NOP: Lab swing 3.5% (Lab majority of 12)
Gallup: Lab swing 4% (Lab majority of 23)
Research Services: Lab swing 2.75% (Con majority of 30)
Daily Express: Lab swing of 1.75% (Con majority of 60).[3]
Result
The election resulted in a very slim majority of four seats for the Labour Party, so they were in government for the first time since 1951. Labour achieved a swing of just over 3%, although its vote rose by only 0.2%. The main shift was the swing from the Conservatives to the Liberals of 5.7%. The Liberals won nearly twice as many votes as in 1959, partly because they had 150 more candidates. Wilson became Prime Minister, replacing Douglas-Home. The four-seat majority was not sustainable for a full Parliament, and Wilson called another general election in 1966. In particular, the small majority meant the government could not implement its policy of nationalising the steel industry, due to the opposition of two of its backbenchers, Woodrow Wyatt and Desmond Donnelly.
This was the only election in Britain's recent history when all seats were won by the three main parties: no minor parties, independents or splinter groups won any seats.
↓
| 317 |
304 |
9 |
| Labour |
Conservatives and Unionist allies |
Lib |
UK general election 1964
|
Candidates |
Votes |
| Party |
Leader |
Standing |
Elected |
Gained |
Unseated |
Net |
% of total |
% |
No. |
Net % |
| |
Labour |
Harold Wilson |
628 |
317 |
65 |
6 |
+ 59 |
50.3 |
44.1 |
12,205,808 |
|
| |
Conservative |
Alec Douglas-Home |
630 |
304 |
5 |
66 |
− 61 |
48.3 |
43.4 |
12,002,642 |
|
| |
Liberal |
Jo Grimond |
365 |
9 |
5 |
2 |
+ 3 |
1.4 |
11.2 |
3,099,283 |
|
| |
Independent Republican |
N/A |
12 |
0 |
0 |
0 |
0 |
|
0.4 |
101,628 |
|
| |
Plaid Cymru |
Gwynfor Evans |
23 |
0 |
0 |
0 |
0 |
|
0.3 |
69,507 |
|
| |
SNP |
Arthur Donaldson |
15 |
0 |
0 |
0 |
0 |
|
0.2 |
64,044 |
|
| |
Communist |
John Gollan |
36 |
0 |
0 |
0 |
0 |
|
0.2 |
46,442 |
|
| |
Independent |
N/A |
20 |
0 |
0 |
0 |
0 |
|
0.1 |
18,677 |
|
| |
Independent Liberal |
N/A |
4 |
0 |
0 |
0 |
0 |
|
0.1 |
16,064 |
|
| |
Republican Labour |
Gerry Fitt |
1 |
0 |
0 |
0 |
0 |
|
0.1 |
14,678 |
|
| |
Independent Conservative |
N/A |
5 |
0 |
0 |
1 |
- 1 |
|
0.0 |
6,459 |
|
| |
British National |
John Bean |
1 |
0 |
0 |
0 |
0 |
|
0.0 |
3,410 |
|
| |
Ind. Nuclear Disarmament |
Pat Arrowsmith |
2 |
0 |
0 |
0 |
0 |
|
0.0 |
1,534 |
|
| |
Fellowship |
Ronald Mallone |
1 |
0 |
0 |
0 |
0 |
|
0.0 |
1,112 |
|
| |
Patriotic Party |
Richard Hilton |
2 |
0 |
0 |
0 |
0 |
|
0.0 |
1,108 |
|
| |
League of Empire Loyalists |
Arthur K. Chesterton |
3 |
0 |
0 |
0 |
0 |
|
0.0 |
1,046 |
|
| |
Communist Anti-Revisionist |
Michael McCreery |
1 |
0 |
0 |
0 |
0 |
|
0.0 |
899 |
|
| |
True Conservative |
John E. Dayton |
1 |
0 |
0 |
0 |
0 |
|
0.0 |
709 |
|
| |
Agriculturalist |
N/A |
1 |
0 |
0 |
0 |
0 |
|
0.0 |
534 |
|
| |
National Democratic |
David Brown |
1 |
0 |
0 |
0 |
0 |
|
0.0 |
349 |
|
| |
Socialist (GB) |
None |
2 |
0 |
0 |
0 |
0 |
|
0.0 |
322 |
|
| |
World Government |
Gilbert Young |
1 |
0 |
0 |
0 |
0 |
|
0.0 |
318 |
|
| |
British and Commonwealth |
Miles Blair |
1 |
0 |
0 |
0 |
0 |
|
0.0 |
310 |
|
| |
Christian Socialist |
None |
1 |
0 |
0 |
0 |
0 |
|
0.0 |
265 |
|
All parties are shown. Conservative total includes Scottish Unionists, Ulster Unionists, and National Liberals.
| Government's new majority |
4 |
| Total votes cast |
27,657,148 |
| Turnout |
77% |
Votes summary
| Popular vote |
|---|
|
|
|
|
|
| Labour |
|
44.1% |
| Conservative and Allies |
|
43.4% |
| Liberal |
|
11.2% |
| Independent |
|
0.5% |
| Others |
|
0.7% |
Headline Swing: 3.1% to Labour
Seats summary
| Parliamentary seats |
|---|
|
|
|
|
|
| Labour |
|
50.3% |
| Conservative and Allies |
|
48.3% |
| Liberal |
|
1.4% |
| Others |
|
0% |
Regional Results
Great Britain
| Party |
Votes |
% of vote |
Candidates |
Seats |
% of seats |
+/– |
|---|
|
Labour | 12,103,049 | 44.8 | 618 | 317 | | |
|
Conservative & Unionist | 11,600,745 | 42.9 | 618 | 292 | | |
| |
Conservative | 10,292,974 | 38.1 | 599 | 286 | | |
| |
Unionist | 981,641 | 3.6 | 65 | 24 | | |
| |
National Liberal | 326,130 | 1.2 | 19 | 6 | | |
|
Liberal | 3,081,929 | 11.4 | 361 | 9 | | |
|
Plaid Cymru | 69,507 | 0.3 | 23 | 0 | 0.0 |  |
|
SNP | 64,044 | 0.2 | 15 | 0 | 0.0 | |
|
Communist | 46,442 | 0.2 | 36 | 0 | 0.0 | |
|
Other parties and independents | 53,116 | 0.2 | 47 | 0 | 0.0 | |
| Total (turnout: 77.2%) | 27,018,832 | 100.0 | 1,718 | 618 | 100.0 | |
| Did not vote | 7,984,670 | |
| Registered voters | 35,003,502 |
| British population | 52,608,000 |
| Source: Rallings & Thrasher |
England
| Party |
Votes |
% of vote |
Candidates |
Seats |
% of seats |
+/– |
|---|
|
Conservative & Unionist | 10,106,028 | 44.1 | 511 | 262 | | |
| |
Conservative | 9,894,014 | 43.1 | 500 | 256 | | |
| |
National Liberal | 212,014 | 0.9 | 11 | 6 | | |
|
Labour | 9,982,360 | 43.5 | 511 | 246 | | |
|
Liberal | 2,775,752 | 12.1 | 323 | 3 | | |
|
Communist | 24,824 | 0.1 | 22 | 0 | 0.0 | |
|
Other parties and independents | 48,287 | 0.2 | 42 | 0 | 0.0 | |
| Total (turnout: 77.0%) | 22,937,251 | 100.0 | 1,409 | 511 | 100.0 | |
| Did not vote | 6,867,376 | |
| Registered voters | 29,804,627 |
| English population | 44,610,500 |
| Source: Rallings & Thrasher |
Scotland
| Party |
Votes |
% of vote |
Candidates |
Seats |
% of seats |
+/– |
|---|
|
Labour | 1,283,667 | 48.7 | 71 | 43 | 60.6 |  5 5 |
|
Conservative & Unionist | 1,069,695 | 40.6 | 71 | 24 | 33.8 |  7 7 |
| |
Unionist | 981,641 | 37.3 | 65 | 24 | 33.8 | 1 |
| |
National Liberal | 88,054 | 3.3 | 6 | 0 | 0.0 | 6 |
|
Liberal | 200,063 | 7.6 | 26 | 4 | 5.6 | 3 |
|
SNP | 64,044 | 2.4 | 15 | 0 | 0.0 | |
|
Communist | 12,241 | 0.5 | 9 | 0 | 0.0 | |
|
Other parties and independents | 4,829 | 0.2 | 5 | 0 | 0.0 | |
| Total (turnout: 77.6%) | 2,634,539 | 100.0 | 197 | 71 | 100.0 | |
| Did not vote | 759,352 | |
| Registered voters | 3,393,891 |
| Scottish population | 5,209,000 |
| Source: Rallings & Thrasher |
Wales
| Party |
Votes |
% of vote |
Candidates |
Seats |
% of seats |
+/– |
|---|
|
Labour | 837,022 | 57.8 | 36 | 28 | 77.8 | |
|
Conservative & Unionist | 425,022 | 29.4 | 36 | 6 | 16.7 | |
| |
Conservative | 398,960 | 27.6 | 34 | 6 | 16.7 | |
| |
National Liberal | 26,062 | 1.8 | 2 | 0 | 0.0 | |
|
Liberal | 106,114 | 7.3 | 12 | 2 | 5.6 | |
|
Plaid Cymru | 69,507 | 4.8 | 23 | 0 | 0.0 | |
|
Communist | 9,377 | 0.6 | 5 | 0 | 0.0 | |
| Total (turnout: 80.1%) | 1,447,042 | 100.0 | 112 | 36 | 100.0 | |
| Did not vote | 358,453 | |
| Registered voters | 1,805,495 |
| Voting age population | 1,805,925 |
| Welsh population | 2,676,400 |
| Source: Rallings & Thrasher |
Northern Ireland
| Party |
Votes |
% of vote |
Candidates |
Seats |
% of seats |
+/– |
|---|
|
Conservative & Unionist |
401,897 |
63.0 |
12 |
12 |
100.0 |
|
|
Ulster Unionist Party |
|
Labour | 102,759 | 16.1 | 10 | 0 | 0.0 | |
|
Independent Republican | 101,628 | 15.9 | 12 | 0 | 0.0 | |
|
Ulster Liberal | 17,354 | 2.7 | 4 | 0 | 0.0 | |
|
Republican Labour | 14,678 | 2.3 | 1 | 0 | 0.0 | |
| Total (turnout: 71.7%) | 638,316 | 100.0 | | 12 | 100.0 | |
| Did not vote | 252,236 | |
| Registered voters | 890,552 |
| Voting age population | 891,043 |
| Northern Irish population | 1,458,000 |
| Source: Rallings & Thrasher |
Incumbents defeated
Conservative
Labour
Liberal
Televised declarations
These declarations were covered live by the BBC where the returning officer was heard to say "duly elected".
| Constituency |
Winning party 1959 |
Constituency result 1964 by party |
Winning party 1964 |
|---|
| Con |
Lab |
Lib |
Others |
| Cheltenham |
|
Conservative |
19,797 |
14,557 |
7,568 |
|
|
Conservative hold |
| Salford West |
|
Labour |
16,446 |
20,490 |
|
|
|
Labour hold |
| Billericay |
|
Conservative |
35,347 |
33,755 |
10,706 |
|
|
Conservative hold |
| Exeter |
|
Conservative |
18,035 |
16,673 |
8,815 |
|
|
Conservative hold |
| Battersea South |
|
Conservative |
10,615 |
12,263 |
3,294 |
|
|
Labour gain |
| Liverpool Exchange |
|
Labour |
7,239 |
16,985 |
|
|
|
Labour hold |
| Holborn and St Pancras South |
|
Conservative |
13,117 |
15,823 |
|
226 |
|
Labour gain |
| North Devon |
|
Liberal |
13,985 |
4,306 |
19,031 |
|
|
Liberal hold |
| Stockport South |
|
Conservative |
13,718 |
16,755 |
7,107 |
|
|
Labour gain |
| Barons Court |
|
Conservative |
14,800 |
15,966 |
2,821 |
|
|
Labour gain |
| Bolton West |
|
Liberal |
13,522 |
16,519 |
10,086 |
|
|
Labour gain |
| Smethwick |
|
Labour |
16,690 |
14,916 |
|
262 |
|
Conservative gain |
| Huyton |
|
Labour |
22,940 |
42,213 |
|
899 |
|
Labour hold |
| Orpington |
|
Conservative |
19,565 |
4,609 |
22,637 |
|
|
Liberal win |
| Torrington |
|
Conservative |
16,889 |
5,867 |
14,831 |
|
|
Conservative hold |
|
- Orpington was won by the Liberals in a by-election in 1962 and held in the general election. When this happens, it is described as a "win" as opposed to a "gain" or "hold".
See also
References
Further reading
- Barberis, Peter. "The 1964 General Election and the Liberals' False Dawn," Contemporary British History, (September 2007) 21#3 pp 373–387
- Butler, David E. et al. The British General Election of 1964 (1965) the standard scholarly study
- F. W. S. Craig, British Electoral Facts: 1832-1987
- Denver, David. "The 1964 General Election: Explaining Voting Behaviour Then and Now," Contemporary British History (2007) 21#3 pp 295–307
- Favretto, Ilaria. "'Wilsonism' reconsidered: Labour party revisionism 1952–64," Contemporary British History (2000) 14#4 pages 54–80 doi:10.1080/13619460008581603
- Fielding, Steven. "Rethinking Labour's 1964 Campaign," Contemporary British History, (September 2007) 21#3 pp 309–324
- Heppell, Timothy. "The Labour Party Leadership Election of 1963: Explaining the Unexpected Election of Harold Wilson," Contemporary British History, (2010) 24#2 pp 151–171
- Morgan, Austen. Harold Wilson (1992) 625pp
- Tomlinson, Jim. "It's the Economy, Stupid! Labour and the Economy, circa 1964," Contemporary British History, (September 2007) 21#3 pp 337–349
- Wrigley, Chris. "Trade Unions and the 1964 General Election," Contemporary British History, (September 2007) 21#3 pp 325–335
- Young, John W. "International Factors and the 1964 Election," Contemporary British History, (September 2007) 21#3 pp 351–371
External links
Manifestos
|
|---|
|
James Harold Wilson, Baron Wilson of Rievaulx |
|
| Premierships | | |
|---|
|
| General elections | |
|---|
|
| Party elections | |
|---|
|
| Constituencies | |
|---|
|
| Resignation Honours | |
|---|
|
| Family | |
|---|
|
| Related articles | |
|---|
|
-
 Book Book
-
 Category Category
|
.jpg)