Northampton South (UK Parliament constituency)
| Northampton South | |
|---|---|
|
Borough constituency for the House of Commons | |
|
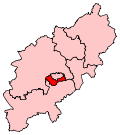
Boundary of Northampton South in Northamptonshire. | |
|
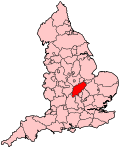
Location of Northamptonshire within England. | |
| County | Northamptonshire |
| Electorate | 63,748 (December 2010)[1] |
| Major settlements | Northampton (part) |
| Current constituency | |
| Created | 1974 |
| Member of parliament | David Mackintosh (Conservative) |
| Number of members | One |
| Created from | Northampton |
| Overlaps | |
| European Parliament constituency | East Midlands |
Northampton South is a constituency[n 1] represented in the House of Commons of the UK Parliament since 2015 by David Mackintosh a Conservative.[n 2]
History
This constituency was created for the election of February 1974 when the old constituency of Northampton was split into Northampton South and Northampton North.
Since creation it is generally a marginal and in elections since 1979 but one, in 2005, has been a bellwether, electing an MP from the winning (or largest governing) party.
The one-time Deputy Speaker of the House, Michael Morris, a Conservative, held this seat from its creation in 1974 until 1997, when Tony Clarke defeated Morris in a surprise result (one of many in the Labour landslide of that year) to gain the seat for Labour with a majority of just 744. Clarke only just increased his majority in 2001, but Brian Binley defeated Clarke to regain the seat for the Conservatives in 2005 with a comfortable majority, and held it until 2015 when he retired and fellow Conservative David Mackintosh held the seat.
Boundaries
1974-1983: The County Borough of Northampton wards of Castle, Delapre, Duston, St Crispin, South, and Weston.
1983-1997: The Borough of Northampton wards of Billing, Castle, Delapre, Nene Valley, New Duston, Old Duston, St Crispin, South, and Weston, and the District of South Northamptonshire wards of Blisworth, Brafield, Bugbrooke, Cogenhoe, Gayton, Hackleton, Harpole, Heyford, Kislingbury, Milton, Roade, Salcey, and Yardley.
1997-2010: The Borough of Northampton wards of Billing, Castle, Delapre, Nene Valley, New Duston, Old Duston, St Crispin, South, and Weston, and the District of South Northamptonshire wards of Brafield, Cogenhoe, Hackleton, Harpole, Kislingbury, Milton, Roade, Salcey, and Yardley.
2010-present: The Borough of Northampton wards of Billing, Castle, Delapre, Ecton Brook, New Duston, Old Duston, St Crispin, St James, Spencer, and Weston.
South Northamptonshire is the 2010-created constituency in the county which absorbed the southern part of the version (existing until that year) of this constituency.
Constituency profile
The constituency has income, social housing and unemployment statistics[2] close to the national average and a varied and dynamic service and engineering-centred economy typical of the East Midlands with significant foodstuffs, clothing and consumables manufacturing and processing operations.[3]
Members of Parliament
| Election | Member[4] | Party | |
|---|---|---|---|
| Feb 1974 | Michael Morris | Conservative | |
| 1997 | Tony Clarke | Labour | |
| 2005 | Brian Binley | Conservative | |
| 2015 | David Mackintosh | Conservative | |
Elections
Elections in the 2010s
| Party | Candidate | Votes | % | ± | |
|---|---|---|---|---|---|
| Conservative | David Mackintosh | 16,163 | 41.6 | +0.7 | |
| Labour | Kevin McKeever | 12,370 | 31.8 | +6.4 | |
| UKIP | Rose Gibbins | 7,114 | 18.3 | +13.4 | |
| Liberal Democrat | Sadik Chaudhury | 1,673 | 4.3 | -15.1 | |
| Green | Julie Hawkins | 1,403 | 3.6 | +2.7 | |
| Majority | 3,793 | 9.8% | |||
| Turnout | 38,884 | 63.4 | +5.2 | ||
| Conservative hold | Swing | -2.85 | |||
| Party | Candidate | Votes | % | ± | |
|---|---|---|---|---|---|
| Conservative | Brian Binley | 15,917 | 40.8 | -2.9 | |
| Labour | Clyde Loakes | 9,913 | 25.4 | -16.1 | |
| Liberal Democrat | Paul Varnsverry | 7,579 | 19.4 | +5.9 | |
| Independent | Tony Clarke | 2,242 | 5.8 | N/A | |
| UKIP | Derek Clark | 1,897 | 4.9 | +2.8 | |
| English Democrat | Kevin Sills | 618 | 1.6 | N/A | |
| Green | Julie Hawkins | 363 | 0.9 | N/A | |
| Northampton Save our Public Services | Dave Green | 325 | 0.8 | N/A | |
| Independent | Kevin Wilshire | 65 | 0.2 | N/A | |
| Scrap Members' Allowances | Liam Costello | 59 | 0.2 | N/A | |
| Majority | 6,004 | 15.4 | |||
| Turnout | 38,978 | 58.2 | -0.6 | ||
| Conservative hold | Swing | +6.6 | |||
Elections in the 2000s
| Party | Candidate | Votes | % | ± | |
|---|---|---|---|---|---|
| Conservative | Brian Binley | 23,818 | 43.7 | +2.6 | |
| Labour | Tony Clarke | 19,399 | 35.6 | −7.3 | |
| Liberal Democrat | Kevin Barron | 8,327 | 15.3 | +2.8 | |
| UKIP | Derek Clark | 1,032 | 1.9 | −0.5 | |
| Veritas | Tony Green | 508 | 0.9 | N/A | |
| S O S! Voters Against Overdevelopment of Northampton | John Harrison | 437 | 0.8 | N/A | |
| Monster Raving Loony | John Percival | 354 | 0.6 | N/A | |
| Independent | Fitzy Fitzpatrick | 346 | 0.6 | N/A | |
| Christian Peoples | Tim Webb | 260 | 0.5 | N/A | |
| Majority | 4,419 | 8.1 | |||
| Turnout | 54,481 | 60.7 | +1.1 | ||
| Conservative gain from Labour | Swing | +5.0 | |||
| Party | Candidate | Votes | % | ± | |
|---|---|---|---|---|---|
| Labour | Tony Clarke | 21,882 | 42.9 | +0.5 | |
| Conservative | Shailesh Vara | 20,997 | 41.1 | 0.0 | |
| Liberal Democrat | Andrew Simpson | 6,355 | 12.5 | +1.4 | |
| UKIP | Derek Clark | 1,237 | 2.4 | +0.4 | |
| Liberated Party | Tina Harvey | 362 | 0.7 | N/A | |
| ProLife Alliance | Clare Johnson | 196 | 0.4 | N/A | |
| Majority | 885 | 1.8 | |||
| Turnout | 51,029 | 59.6 | -12.1 | ||
| Labour hold | Swing | ||||
Elections in the 1990s
| Party | Candidate | Votes | % | ± | |
|---|---|---|---|---|---|
| Labour | Tony Clarke | 24,214 | 42.4 | +14.1 | |
| Conservative | Michael Morris | 23,470 | 41.1 | -14.6 | |
| Liberal Democrat | Anthony W Worgan | 6,316 | 11.1 | -3.1 | |
| Referendum | Christopher C Petrie | 1,405 | 2.5 | ||
| UKIP | Derek Clark | 1,159 | 2.0 | ||
| Natural Law | Graham D Woollcombe | 541 | 0.9 | ||
| Majority | 744 | 1.3 | +12.2 | ||
| Turnout | 55,946 | 71.7 | -8.2 | ||
| Labour gain from Conservative | Swing | +14.1 | |||
| Party | Candidate | Votes | % | ± | |
|---|---|---|---|---|---|
| Conservative | Michael Morris | 36,882 | 55.3 | −0.4 | |
| Labour | J Dickie | 19,909 | 29.8 | +5.3 | |
| Liberal Democrat | Graham A G Mabbutt | 9,912 | 14.9 | −3.7 | |
| Majority | 16,973 | 25.4 | −5.7 | ||
| Turnout | 66,703 | 79.9 | +4.7 | ||
| Conservative hold | Swing | −2.8 | |||
Elections in the 1980s
| Party | Candidate | Votes | % | ± | |
|---|---|---|---|---|---|
| Conservative | Michael Morris | 31,864 | 55.70 | ||
| Labour | J Dickie | 14,061 | 24.58 | ||
| Social Democratic | G Hopkins | 10,639 | 18.60 | ||
| Green | M Hamilton | 647 | 1.13 | ||
| Majority | 17,803 | 31.12 | |||
| Turnout | 75.21 | ||||
| Conservative hold | Swing | ||||
| Party | Candidate | Votes | % | ± | |
|---|---|---|---|---|---|
| Conservative | Michael Morris | 26,824 | 53.59 | ||
| Social Democratic | Keith Kyle | 11,698 | 23.37 | ||
| Labour | M Coleman | 11,533 | 23.04 | ||
| Majority | 15,126 | 30.22 | |||
| Turnout | 72.64 | ||||
| Conservative hold | Swing | ||||
Elections in the 1970s
| Party | Candidate | Votes | % | ± | |
|---|---|---|---|---|---|
| Conservative | Michael Morris | 19,125 | 49.67 | ||
| Labour | G Mason | 15,491 | 40.24 | ||
| Liberal | D Amey | 3,478 | 9.03 | ||
| National Front | M James | 407 | 1.06 | ||
| Majority | 3,634 | 9.44 | |||
| Turnout | 75.27 | ||||
| Conservative hold | Swing | ||||
| Party | Candidate | Votes | % | ± | |
|---|---|---|---|---|---|
| Conservative | Michael Morris | 14,393 | 42.98 | ||
| Labour | J Dilks | 14,252 | 42.56 | ||
| Liberal | RF Miller | 4,842 | 14.46 | ||
| Majority | 141 | 0.42 | |||
| Turnout | 75.52 | ||||
| Conservative hold | Swing | ||||
| Party | Candidate | Votes | % | ± | |
|---|---|---|---|---|---|
| Conservative | Michael Morris | 14,321 | 40.27 | ||
| Labour | J Dilks | 14,142 | 39.77 | ||
| Liberal | RF Miller | 7,099 | 19.96 | ||
| Majority | 179 | 0.50 | |||
| Turnout | 80.82 | ||||
| Conservative hold | Swing | ||||
See also
Notes and references
- Notes
- ↑ A borough constituency (for the purposes of election expenses and type of returning officer)
- ↑ As with all constituencies, the constituency elects one Member of Parliament (MP) by the first past the post system of election at least every five years.
- References
- ↑ "Electorate Figures - Boundary Commission for England". 2011 Electorate Figures. Boundary Commission for England. 4 March 2011. Retrieved 13 March 2011.
- ↑ Unemployment claimants by constituency The Guardian
- ↑ 2011 census interactive maps
- ↑ Leigh Rayment's Historical List of MPs – Constituencies beginning with "N" (part 3)
- ↑ "Election Data 2015". Electoral Calculus. Archived from the original on 17 October 2015. Retrieved 17 October 2015.
- ↑ "Election Data 2010". Electoral Calculus. Archived from the original on 17 October 2015. Retrieved 17 October 2015.
- ↑ BBC Election Results for Northampton South
- ↑ "Election Data 2005". Electoral Calculus. Archived from the original on 15 October 2011. Retrieved 18 October 2015.
- ↑ "Election Data 2001". Electoral Calculus. Archived from the original on 15 October 2011. Retrieved 18 October 2015.
- ↑ "Election Data 1997". Electoral Calculus. Archived from the original on 15 October 2011. Retrieved 18 October 2015.
- ↑ "Election Data 1992". Electoral Calculus. Archived from the original on 15 October 2011. Retrieved 18 October 2015.
- ↑ "Politics Resources". Election 1992. Politics Resources. 9 April 1992. Retrieved 2010-12-06.
- ↑ "Election Data 1987". Electoral Calculus. Archived from the original on 15 October 2011. Retrieved 18 October 2015.
- ↑ "Election Data 1983". Electoral Calculus. Archived from the original on 15 October 2011. Retrieved 18 October 2015.
The Borough of Northampton | |||||||||||||||||||
|---|---|---|---|---|---|---|---|---|---|---|---|---|---|---|---|---|---|---|---|
| Suburbs and villages | 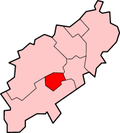 | ||||||||||||||||||
| Governance | |||||||||||||||||||
| Culture |
| ||||||||||||||||||
| Education | |||||||||||||||||||
| Sport |
| ||||||||||||||||||
| Transport | |||||||||||||||||||
| |||||||||||||||||||
Coordinates: 52°13′N 0°53′W / 52.22°N 0.89°W