Nottingham East (UK Parliament constituency)
| Nottingham East | |
|---|---|
|
Borough constituency for the House of Commons | |
|
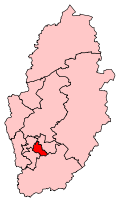
Boundary of Nottingham East in Nottinghamshire. | |
|
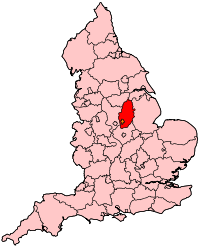
Location of Nottinghamshire within England. | |
| County | Nottinghamshire |
| Electorate | 58,705 (2010)[1] |
| Major settlements | Nottingham |
| Current constituency | |
| Created | 1974 |
| Member of parliament | Chris Leslie (Labour Co-op) |
| Number of members | One |
| Created from | Nottingham Central and Nottingham South |
| 1885–1955 | |
| Number of members | One |
| Type of constituency | Borough constituency |
| Created from | Nottingham |
| Overlaps | |
| European Parliament constituency | East Midlands |
Nottingham East is a constituency[n 1] represented in the House of Commons of the UK Parliament since 2010 by Chris Leslie, a member of the Labour Party who previously served as an MP for Shipley.[n 2]
Boundaries
1885-1918: The Municipal Borough of Nottingham wards of Byron, Manvers, Mapperley, Robin Hood, and St Ann's.
1918-1950: The County Borough of Nottingham wards of Byron, Manvers, Mapperley, and St Mary's.
1950-1955: The County Borough of Nottingham wards of Byron, Manvers, Mapperley, and St Ann's.
1974-1983: The County Borough of Nottingham wards of Bridge, Lenton, Manvers, Market, St Ann's, and Trent.
1983-2010: The City of Nottingham wards of Basford, Forest, Greenwood, Manvers, Mapperley, Radford, St Ann's, Sherwood, and Trent.
2010-present: The City of Nottingham wards of Arboretum, Berridge, Dales, Mapperley, St Ann's, and Sherwood.
The constituency covers the north-eastern part of the City of Nottingham. It includes the suburbs of Mapperley, Carrington and Sherwood, and the inner city areas of Hyson Green, St Ann's and Sneinton.
Constituency profile
On average earners' incomes are slightly lower than the national average[2] and in 2010 unemployment stood at 7.4%, which was higher than the East Midlands average at that date of 3.6%[3] however the picture is not uniform across all 2011 Census Output Areas, some of which have incomes at the national average or above and together with the affordability of property in the area, those on the national average way or above generally have the ability to save, purchase property or enjoy a high standard of living.[4][5]
History
The present Nottingham East constituency was created in 1974, and first elected Jack Dunnett who had been Labour MP for the abolished Nottingham Central seat. Michael Knowles won it for the Conservative Party in 1983, when some of the seat was transferred to the new Nottingham South constituency in boundary changes. Knowles held the seat with a reduced majority in 1987, but John Heppell gained it for Labour in 1992, and held the seat until he retired in 2010. It is presently held by Labour's Chris Leslie. Leslie previously represented the West Yorkshire constituency of Shipley from 1997 to 2005 and joined the front benches serving as a junior minister as part of the Tony Blair Government.
MPs 1885–1955
MPs 1974–present
| Event | Member[6] | Party | |
|---|---|---|---|
| Feb 1974 | Jack Dunnett | Labour | |
| 1983 | Michael Knowles | Conservative | |
| 1992 | John Heppell | Labour | |
| 2010 | Chris Leslie | Labour Co-operative | |
Elections
Elections in the 2010s
| Party | Candidate | Votes | % | ± | |
|---|---|---|---|---|---|
| Labour Co-op | Chris Leslie | 19,208 | 54.6 | +9.2 | |
| Conservative | Garry Hickton | 7,314 | 20.8 | -2.9 | |
| UKIP | Fran Loi[8] | 3,501 | 9.9 | +6.5 | |
| Green | Antonia Zenkevitch [9] | 3,473 | 9.9 | +7.1 | |
| Liberal Democrat | Tad Jones | 1,475 | 4.2 | -20.1 | |
| Independent | Seb Soar [10] | 141 | 0.4 | +0.4 | |
| Independent | James Stephenson | 97 | 0.3 | +0.3 | |
| Majority | 11,894 | 33.8 | +12.8 | ||
| Turnout | 58.2 | +1.8 | |||
| Labour Co-op hold | Swing | ||||
| Party | Candidate | Votes | % | ± | |
|---|---|---|---|---|---|
| Labour Co-op | Chris Leslie | 15,022 | 45.4 | −1.3 | |
| Liberal Democrat | Sam Boote | 8,053 | 24.3 | +2.5 | |
| Conservative | Ewan Lamont | 7,846 | 23.7 | +1.2 | |
| UKIP | Pat Wolfe | 1,138 | 3.4 | +0.9 | |
| Green | Benjamin Hoare | 928 | 2.8 | −2.4 | |
| Christian | Parvaiz Sardar | 125 | 0.4 | N/A | |
| Majority | 6,969 | 21.0 | −3.2 | ||
| Turnout | 33,112 | 56.4 | +7.5 | ||
| Labour Co-op hold | Swing | −1.3 | |||
Elections in the 2000s
| Party | Candidate | Votes | % | ± | |
|---|---|---|---|---|---|
| Labour | John Heppell | 13,787 | 45.8 | −13.2 | |
| Liberal Democrat | Issan Ghazni | 6,848 | 22.8 | +9.8 | |
| Conservative | Jim Thornton | 6,826 | 22.7 | −1.6 | |
| Green | Ashley Baxter | 1,517 | 5.0 | N/A | |
| UKIP | Anthony Ellwood | 740 | 2.5 | N/A | |
| Socialist Unity | Pete Radcliff | 373 | 1.2 | N/A | |
| Majority | 6,939 | 23.1 | |||
| Turnout | 30,091 | 49.6 | +4.1 | ||
| Labour hold | Swing | −11.5 | |||
| Party | Candidate | Votes | % | ± | |
|---|---|---|---|---|---|
| Labour | John Heppell | 17,530 | 59.0 | -3.3 | |
| Conservative | Richard Allan | 7,210 | 24.3 | +0.8 | |
| Liberal Democrat | Tim Ball | 3,874 | 13.0 | +2.9 | |
| Socialist Alliance | Pete Radcliff | 1,117 | 3.8 | N/A | |
| Majority | 10,320 | 34.7 | |||
| Turnout | 29,731 | 45.5 | -15.0 | ||
| Labour hold | Swing | −2.0 | |||
Elections in the 1990s
| Party | Candidate | Votes | % | ± | |
|---|---|---|---|---|---|
| Labour | John Heppell | 24,755 | 62.3 | ||
| Conservative | Andrew Raca | 9,336 | 23.5 | ||
| Liberal Democrat | Kevin Mulloy | 4,008 | 10.1 | ||
| Referendum | Ben Brown | 1,645 | 4.1 | ||
| Majority | 15,419 | 38.8 | |||
| Turnout | 39,744 | 60.5 | |||
| Labour hold | Swing | ||||
| Party | Candidate | Votes | % | ± | |
|---|---|---|---|---|---|
| Labour | John Heppell | 25,026 | 52.6 | +10.6 | |
| Conservative | Michael Knowles | 17,346 | 36.4 | −6.5 | |
| Liberal Democrat | Timothy Simon Ball | 3,695 | 7.8 | −6.9 | |
| Green | Andrew Guy Jones | 667 | 1.4 | +1.4 | |
| Liberal | Charles William Roylance | 598 | 1.3 | −13.4 | |
| Natural Law | John Ashforth | 283 | 0.6 | +0.6 | |
| Majority | 7,680 | 16.1 | +15.2 | ||
| Turnout | 47,615 | 70.1 | +1.3 | ||
| Labour gain from Conservative | Swing | +8.6 | |||
Elections in the 1980s
| Party | Candidate | Votes | % | ± | |
|---|---|---|---|---|---|
| Conservative | Michael Knowles | 20,162 | 42.93 | +2.49 | |
| Labour | Mohammed Aslam | 19,706 | 41.96 | +4.88 | |
| Liberal | Stephen Parkhouse | 6,887 | 14.66 | N/A | |
| Red Front | Kenan Malik | 212 | 0.45 | N/A | |
| Majority | 456 | 0.97 | |||
| Turnout | 68.80 | ||||
| Conservative hold | Swing | -1.20 | |||
| Party | Candidate | Votes | % | ± | |
|---|---|---|---|---|---|
| Conservative | Michael Knowles | 17,641 | 40.44 | +0.55 | |
| Labour | Martyn Sloman | 16,177 | 37.08 | -13.39 | |
| Social Democratic | Michael Bird | 8,385 | 19.22 | N/A | |
| Independent Conservative | David Steven Merrick | 1,421 | 3.26 | N/A | |
| Majority | 1,464 | 3.36 | |||
| Turnout | 63.56 | ||||
| Conservative gain from Labour | Swing | +6.97 | |||
Elections in the 1970s
| Party | Candidate | Votes | % | ± | |
|---|---|---|---|---|---|
| Labour | Jack Dunnett | 15,433 | 50.47 | -0.74 | |
| Conservative | Martin Brandon-Bravo | 12,199 | 39.89 | +7.13 | |
| Liberal | JD Hiley | 2,270 | 7.42 | -6.34 | |
| National Front | M Coles | 426 | 1.39 | N/A | |
| Socialist Unity | IB Juniper | 252 | 0.82 | N/A | |
| Majority | 3,234 | 10.58 | |||
| Turnout | 63.92 | ||||
| Labour hold | Swing | -3.94 | |||
| Party | Candidate | Votes | % | ± | |
|---|---|---|---|---|---|
| Labour | Jack Dunnett | 16,530 | 51.21 | ||
| Conservative | SM Swerling | 10,574 | 32.76 | ||
| Liberal | E Rowan | 4,442 | 13.76 | ||
| Ind. Labour Party | DW Peetz | 736 | 2.28 | ||
| Majority | 5,956 | 18.45 | |||
| Turnout | 60.02 | ||||
| Labour hold | Swing | ||||
| Party | Candidate | Votes | % | ± | |
|---|---|---|---|---|---|
| Labour | Jack Dunnett | 17,324 | 46.87 | ||
| Conservative | Richard Charles Scrimgeour Shepherd | 13,346 | 36.11 | ||
| Liberal | T Rowan | 6,294 | 17.03 | ||
| Majority | 3,978 | 10.76 | |||
| Turnout | 69.12 | ||||
| Labour hold | Swing | ||||
Elections in the 1950s
| Party | Candidate | Votes | % | ± | |
|---|---|---|---|---|---|
| Labour | James Harrison | 20,865 | 47.77 | ||
| Conservative | Sidney Shephard | 20,601 | 47.17 | ||
| Liberal | Lady Ruth Abrahams | 2,209 | 5.06 | ||
| Majority | 264 | 0.60 | |||
| Turnout | 83.34 | ||||
| Labour hold | Swing | ||||
| Party | Candidate | Votes | % | ± | |
|---|---|---|---|---|---|
| Labour | James Harrison | 20,404 | 46.53 | ||
| Conservative | Louis Halle Gluckstein | 18,079 | 41.23 | ||
| Liberal | Edward Anthony Brooke Fletcher | 5,368 | 12.24 | ||
| Majority | 2,325 | 5.30 | |||
| Turnout | 84.26 | ||||
| Labour hold | Swing | ||||
Elections in the 1940s
| Party | Candidate | Votes | % | ± | |
|---|---|---|---|---|---|
| Labour | James Harrison | 12,075 | 40.2 | ||
| Conservative | Louis Halle Gluckstein | 11,227 | 37.4 | ||
| Liberal | Arthur Patrick William Seely | 5,658 | 18.8 | ||
| Independent Labour | George Twells | 1,072 | 3.6 | ||
| Majority | 848 | 2.8 | |||
| Turnout | 72.0 | ||||
| Labour gain from Conservative | Swing | ||||
General Election 1939/40: Another general election was required to take place before the end of 1940. The political parties had been making preparations for an election to take place from 1939 and by the end of this year, the following candidates had been selected;
- Conservative: Louis Gluckstein
- Labour: George Twells
Elections in the 1930s
| Party | Candidate | Votes | % | ± | |
|---|---|---|---|---|---|
| Conservative | Louis Halle Gluckstein | 16,726 | 57.7 | ||
| Labour | M. Leon Freedman | 7,435 | 25.7 | ||
| Liberal | Arthur Strettell Comyns Carr | 4,819 | 16.6 | ||
| Majority | 9,291 | 32.1 | |||
| Turnout | 28,980 | 68.1 | |||
| Conservative hold | Swing | ||||
| Party | Candidate | Votes | % | ± | |
|---|---|---|---|---|---|
| Conservative | Louis Halle Gluckstein | 17,484 | 50.3 | ||
| Liberal | William Norman Birkett | 11,901 | 34.3 | ||
| Labour | Walter Windsor | 5,339 | 15.4 | ||
| Majority | 5,583 | 16.1 | |||
| Turnout | 34,724 | 78.8 | |||
| Conservative gain from Liberal | Swing | ||||
Elections in the 1920s
| Party | Candidate | Votes | % | ± | |
|---|---|---|---|---|---|
| Liberal | William Norman Birkett | 14,049 | 40.2 | -1.4 | |
| Unionist | Louis Halle Gluckstein | 11,110 | 31.8 | -15.8 | |
| Labour | James Henry Baum | 9,787 | 28.0 | +28.0 | |
| Majority | 2,939 | 8.4 | 14.4 | ||
| Turnout | 34,946 | 78.9 | +4.2 | ||
| Liberal gain from Unionist | Swing | +7.2 | |||
| Party | Candidate | Votes | % | ± | |
|---|---|---|---|---|---|
| Unionist | Clement Edmund Royds Brocklebank | 11,524 | 47.6 | +1.0 | |
| Liberal | William Norman Birkett | 10,078 | 41.6 | ||
| Communist | Thomas Mann | 2,606 | 10.8 | ||
| Majority | 1,446 | 6.0 | |||
| Turnout | 74.7 | ||||
| Unionist gain from Liberal | Swing | ||||
| Party | Candidate | Votes | % | ± | |
|---|---|---|---|---|---|
| Liberal | William Norman Birkett | 11,355 | 53.4 | +13.1 | |
| Unionist | John Plowright Houfton | 9,919 | 46.6 | -13.1 | |
| Majority | 1,436 | 6.8 | 26.2 | ||
| Turnout | 21,274 | 67.8 | +1.6 | ||
| Liberal gain from Unionist | Swing | +13.1 | |||
| Party | Candidate | Votes | % | ± | |
|---|---|---|---|---|---|
| Unionist | John Plowright Houfton | 12,082 | 59.7 | ||
| Liberal | Edward Ernest Henry Atkin | 8,170 | 40.3 | ||
| Majority | 3,912 | 19.4 | |||
| Turnout | 66.2 | ||||
| Unionist hold | Swing | ||||
| Party | Candidate | Votes | % | ± | |
|---|---|---|---|---|---|
| Unionist | John Plowright Houfton | 10,404 | 52.3 | -13.4 | |
| Labour | A.H. Jones | 5,431 | 27.3 | +7.9 | |
| Liberal | Thomas George Graham | 4,065 | 20.4 | n/a | |
| Majority | 4,973 | 25.0 | -21.3 | ||
| Turnout | 66.3 | +16.8 | |||
| Unionist hold | Swing | -10.6 | |||
Elections in the 1910s
| Party | Candidate | Votes | % | ± | |
|---|---|---|---|---|---|
| Unionist | 9,549 | 65.7 | |||
| Labour | Thomas Proctor | 2,817 | 19.4 | ||
| NFDDSS | Joseph N Dennis Brookes | 1,083 | 14.9 | ||
| Majority | |||||
| Turnout | 49.5 | ||||
| Unionist hold | Swing | ||||
- endorsed by Coalition Government
Election results 1885-1918
Elections in the 1880s
| Party | Candidate | Votes | % | ± | |
|---|---|---|---|---|---|
| Liberal | Arnold Morley | 5,239 | n/a | ||
| Conservative | Hon. Harold Heneage Finch-Hatton | 4,248 | n/a | ||
| Majority | 991 | n/a | |||
| Turnout | n/a | ||||
| Liberal win (new seat) | |||||
| Party | Candidate | Votes | % | ± | |
|---|---|---|---|---|---|
| Liberal | Arnold Morley | 4584 | |||
| Conservative | Hon. Harold Heneage Finch-Hatton | 4418 | |||
| Majority | 166 | ||||
| Turnout | |||||
| Liberal hold | Swing | ||||
Elections in the 1890s
| Party | Candidate | Votes | % | ± | |
|---|---|---|---|---|---|
| Liberal | Arnold Morley | 4861 | |||
| Conservative | Hon. Harold Heneage Finch-Hatton | 4284 | |||
| Majority | 577 | ||||
| Turnout | |||||
| Liberal hold | Swing | ||||

| Party | Candidate | Votes | % | ± | |
|---|---|---|---|---|---|
| Conservative | Edward Bond | 4,900 | |||
| Liberal | Rt Hon. Arnold Morley | 4,735 | |||
| Majority | 165 | ||||
| Turnout | |||||
| Conservative gain from Liberal | Swing | ||||
Elections in the 1900s
| Party | Candidate | Votes | % | ± | |
|---|---|---|---|---|---|
| Conservative | Edward Bond | 4,927 | |||
| Liberal | Edward Hervey Fraser | 4,148 | |||
| Majority | 779 | ||||
| Turnout | |||||
| Conservative hold | Swing | ||||
| Party | Candidate | Votes | % | ± | |
|---|---|---|---|---|---|
| Liberal | Sir Henry John Stedman Cotton | 6,020 | 58.4 | +12.7 | |
| Conservative | Edward Bond | 4,290 | 41.6 | -12.7 | |
| Majority | 1,730 | 16.8 | |||
| Turnout | 10,310 | 82.8 | +7.9 | ||
| Liberal gain from Conservative | Swing | 12.7 | |||
Elections in the 1910s
| Party | Candidate | Votes | % | ± | |
|---|---|---|---|---|---|
| Conservative | James Archibald Morrison | 5877 | |||
| Liberal | Sir Henry John Stedman Cotton | 5725 | |||
| Majority | |||||
| Turnout | |||||
| Conservative gain from Liberal | Swing | ||||
| Party | Candidate | Votes | % | ± | |
|---|---|---|---|---|---|
| Conservative | James Archibald Morrison | 6,274 | 56.6 | ||
| Liberal | Dudley Cautley Stewart-Smith | 4,804 | 43.4 | ||
| Majority | 13.2 | ||||
| Turnout | |||||
| Conservative hold | Swing | ||||

| Party | Candidate | Votes | % | ± | |
|---|---|---|---|---|---|
| Unionist | Sir John David Rees | 6,482 | |||
| Liberal | Thomas William Dobson | 5,158 | |||
| Majority | |||||
| Turnout | |||||
| Unionist hold | Swing | ||||
General Election 1914/15:
Another General Election was required to take place before the end of 1915. The political parties had been making preparations for an election to take place and by the July 1914, the following candidates had been selected;
- Unionist: Sir John David Rees
- Labour: Thomas Proctor
See also
Notes and references
- Notes
- ↑ A borough constituency (for the purposes of election expenses and type of returning officer)
- ↑ As with all constituencies, the constituency elects one Member of Parliament (MP) by the first past the post system of election at least every five years.
- References
- ↑ "Nottingham East". The Electoral Commission. Retrieved 28 December 2014.
- ↑ "2001 Census". Office for National Statistics. Retrieved 28 December 2014.
- ↑ Simon Rogers, John Burn-Murdoch and Ami Sedghi (15 May 2013). "Unemployment: the key UK data and benefit claimants for every constituency". The Guardian. Retrieved 28 December 2014.
- ↑ "2011 census interactive maps". Office for National Statistics. Retrieved 28 December 2014.
- ↑ "NG3 (Nottingham) area guide". Mouseprice. Retrieved 28 December 2014.
- 1 2 Leigh Rayment's Historical List of MPs – Constituencies beginning with "N" (part 3)
- ↑ "Election Data 2015". Electoral Calculus. Archived from the original on 17 October 2015. Retrieved 17 October 2015.
- ↑ "UKIP Nottingham East Parliamentary Candidate 2015". UK Independence Party. Retrieved 28 December 2014.
- ↑ http://eastmidlands.greenparty.org.uk/elections-candidates.html
- ↑ "Sebastian Soar". Retrieved 10 February 2015.
- ↑ "Election Data 2010". Electoral Calculus. Archived from the original on 17 October 2015. Retrieved 17 October 2015.
- ↑ "Election 2010: Nottingham East". BBC News. Retrieved 28 December 2014.
- ↑ "Election Data 2005". Electoral Calculus. Archived from the original on 15 October 2011. Retrieved 18 October 2015.
- ↑ "Election 2005: Nottingham East". BBC News. Retrieved 28 December 2014.
- ↑ "Election Data 2001". Electoral Calculus. Archived from the original on 15 October 2011. Retrieved 18 October 2015.
- 1 2 "Vote 2001: Nottingham East". BBC News. Retrieved 28 December 2014.
- ↑ "Election Data 1997". Electoral Calculus. Archived from the original on 15 October 2011. Retrieved 18 October 2015.
- ↑ "Election Data 1992". Electoral Calculus. Archived from the original on 15 October 2011. Retrieved 18 October 2015.
- ↑ "UK General Election results April 1992". Politics Resources. Retrieved 28 December 2014.
- ↑ "Election Data 1987". Electoral Calculus. Archived from the original on 15 October 2011. Retrieved 18 October 2015.
- ↑ "Election Data 1983". Electoral Calculus. Archived from the original on 15 October 2011. Retrieved 18 October 2015.
- ↑ F. W. S Craig (1977). British parliamentary election results 1918-1949. Macmillan. ISBN 0333230485.
- 1 2 3 4 5 6 The Liberal Year Book, 1907
- ↑ Debrett's House of Commons & Judicial Bench, 1886
- ↑ Debrett's House of Commons & Judicial Bench, 1901
- ↑ Debrett's House of Commons & Judicial Bench, 1901
- ↑ Debrett's House of Commons & Judicial Bench, 1916
- ↑ Debrett's House of Commons & Judicial Bench, 1916
- ↑ Debrett's House of Commons & Judicial Bench, 1916
Coordinates: 52°58′N 1°08′W / 52.96°N 1.13°W