United Kingdom general election, 1951
| | |||||||||||||||||||||||||||||||||||||||||||||||||||||||||||||||
| |||||||||||||||||||||||||||||||||||||||||||||||||||||||||||||||
| |||||||||||||||||||||||||||||||||||||||||||||||||||||||||||||||
|
| |||||||||||||||||||||||||||||||||||||||||||||||||||||||||||||||
| Colours denote the winning party, as shown in the main table of results. (Map does not show results in Northern Ireland) | |||||||||||||||||||||||||||||||||||||||||||||||||||||||||||||||
| |||||||||||||||||||||||||||||||||||||||||||||||||||||||||||||||


| 1945 election • MPs |
| 1950 election • MPs |
| 1951 election • MPs |
| 1955 election • MPs |
The 1951 United Kingdom general election was held twenty months after the 1950 general election, which the Labour Party had won with a slim majority of just five seats. Labour called the election for 25 October 1951 hoping to increase their majority.
Background
Clement Attlee had decided to call the election after the King's concerns over leaving the country to go on his Commonwealth tour in 1952 with a government that had such a slim majority that there was danger of a change of government in his absence.[1] (As it transpired the King became too ill to travel and delegated the tour to his daughter Princess Elizabeth shortly before his death in February 1952.)
The Labour government, which by now had implemented most of its 1945 manifesto, was now beginning to lose many cabinet ministers such as Ernest Bevin and Stafford Cripps due to old age. The Conservatives however, due to the previous year's election, looked fresher, with more new MPs.
Campaign
As Labour began to have some policy splits during the election campaign, the Conservatives ran an efficient campaign that was well funded and orchestrated. Their manifesto Britain Strong and Free stressed that safeguarding "our traditional way of life" was integral to the Conservative purpose. They did not propose to dismantle the welfare state or the National Health Service which the Labour Government had established.[2] As for the Liberals, the poor election results in 1950 only got worse.[3]
The subsequent Labour defeat was significant for several reasons: the party polled almost a quarter of a million votes more than the Conservatives and their National Liberal allies combined, won the most votes that Labour had ever won (and has ever won as of 2015) and won the most votes of any political party in any election in British political history, a record not surpassed until the Conservative Party's victory in 1992. Despite this, it was the Conservatives who formed the next government with a majority of 16. In addition, under the first past the post electoral system, Labour votes translated into increased majorities for MPs in safe seats, rather than into gaining new seats. This was the second of three elections in the 20th century where a party lost the popular vote but won the most seats, the others being 1929 and February 1974; it also happened in 1874.
Four candidates were returned unopposed, all in Northern Ireland. This was the last general election in which any candidates were returned unopposed, although there have since been unopposed by-elections.[4]
Result
| 321 | 295 | 6 | 3 |
| Conservative/Liberal National | Labour | Lib | O |
| Candidates | Votes | ||||||||||
|---|---|---|---|---|---|---|---|---|---|---|---|
| Party | Leader | Standing | Elected | Gained | Unseated | Net | % of total | % | No. | Net % | |
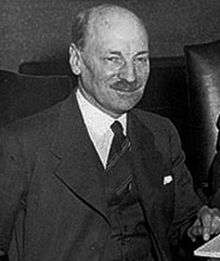
| Labour | Clement Attlee | 617 | 295 | 2 | 22 | − 20 | 47.20 | 48.78 | 13,948,883 | ||
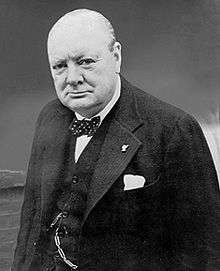
| Conservative | Winston Churchill | 562 | 302 | 20 | 1 | + 19 | 48.32 | 44.27 | 12,659,712 | ||
| National Liberal | James Stuart | 55 | 191 | 3 | 0 | + 3 | 3.041 | 3.701 | 1,058,1381 | ||
| Liberal | Clement Davies | 109 | 6 | 1 | 4 | − 3 | 0.96 | 2.55 | 730,546 | ||
| Independent Nationalist | N/A | 3 | 2 | 0 | 0 | 0 | 0.32 | 0.32 | 92,787 | ||
| Irish Labour | William Norton | 1 | 1 | 1 | 0 | + 1 | 0.16 | 0.12 | 33,174 | ||
| Communist | Harry Pollitt | 10 | 0 | 0 | 0 | 0 | 0.00 | 0.08 | 21,640 | ||
| Independent | N/A | 6 | 0 | 0 | 0 | 0 | 0.00 | 0.07 | 19,791 | ||
| Plaid Cymru | Gwynfor Evans | 4 | 0 | 0 | 0 | 0 | 0.00 | 0.04 | 10,920 | ||
| SNP | Robert McIntyre | 2 | 0 | 0 | 0 | 0 | 0.00 | 0.03 | 7,299 | ||
| Independent Conservative | N/A | 1 | 0 | 0 | 0 | 0 | 0.00 | 0.02 | 5,904 | ||
| Ind. Labour Party | Fred Barton | 3 | 0 | 0 | 0 | 0 | 0.00 | 0.014 | 4,057 | ||
| British Empire | P. J. Ridout | 1 | 0 | 0 | 0 | 0 | 0.00 | 0.006 | 1,643 | ||
| Anti-Partition | James McSparran | 1 | 0 | 0 | 0 | 0 | 0.00 | 0.005 | 1,340 | ||
| United Socialist | Guy Aldred | 1 | 0 | 0 | 0 | 0 | 0.00 | 0.001 | 411 | ||
Total votes cast: 28,596,594. All parties shown. Conservative result includes the Ulster Unionists.
1 The National Liberals were in alliance with the Conservatives, bringing total Conservative strength to 321 seats (51.36%); votes total 13,717,850 (47.97%).
| Government's new majority | 17 |
| Total votes cast | 28,596,594 |
| Turnout | 82.6% |
Votes summary
Headline Swing: 1.13% to Conservative
Seats summary
Seats changing hands
- From Conservative to Liberal (0 seats):
- From Labour to Conservative (21 seats): Barry, Battersea South, Bedfordshire South, Berwick and East Lothian, Bolton East, Buckingham, Conway, Darlington, Doncaster, Dulwich, King's Lynn, Manchester Blackley, Middlesbrough West, Norfolk South West, Oldham East, Plymouth Sutton, Reading North, Rochdale, Rutherglen, Wycombe and Yarmouth
- From Labour to Liberal (1 seat): Bolton West
- From Liberal to Conservative (2 seats): Eye and Roxburgh
- From Liberal to Labour (2 seats): Anglesey and Meirioneth
- From Ulster Unionist to Irish Labour (1 seat): Belfast West
See also
References
- ↑ Judd, Dennis (2012). George VI. I.B. Tauris (paperback). p. 238. ISBN 978-1-78076-071-1. Judd writes that Attlee confirmed the king's anxiety in his own autobiography.
- ↑ Kynaston, David (2009). Family Britain 1951-7. London: Bloomsbury. p. 32. ISBN 9780747583851.
- ↑ "UK | UK Politics | The Basics | past_elections | 1951: Churchill back in power at last". BBC News. 2005-04-05. Retrieved 2013-10-05.
- ↑ "General Election Results 1885-1979". Election.demon.co.uk. Retrieved 2013-10-05.
Further reading
- David E, Butler The British General Election of 1951 (1952). the standard study
- F. W. S. Craig, British Electoral Facts: 1832–1987
- United Kingdom election results - summary results 1885–1979
Manifestos
- CONSERVATIVE PARTY: 1951- 1951 Conservative manifesto.
- Labour Party Election Manifesto - 1951 Labour Party manifesto.
- The Nation's Task - 1951 Liberal Party manifesto.
| General elections |
|
|---|---|
| Local elections |
|
| European elections | |
| Referendums | |
| |