United Kingdom general election, 1922
|
|
|
|
All 615 seats Constituency results
308 seats needed for a majority |
| Turnout |
73.0% ( 15.8%) 15.8%) |
| |
First party |
Second party |
| |
 |
 |
| Leader |
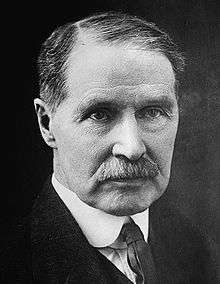
Andrew Bonar Law |
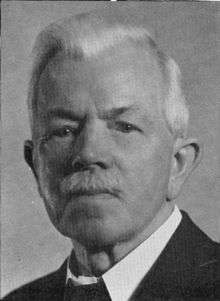
J. R. Clynes |
| Party |
Conservative |
Labour |
| Leader since |
23 October 1922 |
14 February 1921 |
| Leader's seat |
Glasgow Central |
Manchester Platting |
| Last election |
379 seats, 39.2% (including Conservatives not elected under the Coalition coupon) |
57 seats, 21.5% |
| Seats won |
344 |
142 |
| Seat change |
 35 35 |
85 |
| Popular vote |
5,294,465 |
4,076,665 |
| Percentage |
38.5% |
29.7% |
| Swing |
0.7% |
8.9% |
|
| |
Third party |
Fourth party |
| |
 |
 |
| Leader |
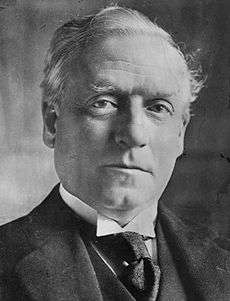
H. H. Asquith |
David Lloyd George |
| Party |
Liberal |
National Liberal |
| Leader since |
30 April 1908 |
7 December 1916 |
| Leader's seat |
Paisley |
Caernarvon Boroughs |
| Last election |
36 seats, 13.3% |
127 seats, 12.6% |
| Seats won |
62 |
53 |
| Seat change |
26 |
74 |
| Popular vote |
2,601,486 |
1,355,366 |
| Percentage |
18.9% |
9.9% |
| Swing |
5.9% |
2.7% |
|
|
|
The United Kingdom general election of 1922 was held on Wednesday 15 November 1922. It was the first election held after most of the Irish counties left the United Kingdom to form the Irish Free State, and was won by Andrew Bonar Law's Conservatives, who gained an overall majority over Labour, led by J. R. Clynes, and a divided Liberal Party.
Background
The Liberal Party were split between the "National Liberals" following David Lloyd George, who had been ousted as Prime Minister the previous month, and the "Liberals" following former Prime Minister H. H. Asquith. The Conservatives had been in coalition with the Lloyd George Liberals until the previous month, at which point Bonar Law had formed a purely Conservative government.
Although still Liberal leader and a frequent public speaker, Asquith was no longer a particularly influential figure in the national political debate, and he had played no part in the downfall of the Lloyd George coalition. Most attention was focussed on the new and most recent Prime Ministers. Asquith's daughter Violet Bonham-Carter, a prominent Liberal campaigner, likened the election to a contest between a man with sleeping sickness (Bonar Law) and a man with St Vitus Dance (Lloyd George).[1]
Some Lloyd George Liberals were not opposed by Conservative candidates (e.g. Winston Churchill, who was defeated at Dundee nonetheless) whilst many leading Conservatives (e.g. former leaders Sir Austen Chamberlain and Arthur Balfour and former Lord Chancellor Lord Birkenhead) were not members of Bonar Law's government and hoped to hold the balance of power after the election (comparisons were made with the Peelite group - the ousted Conservative front bench of the late 1840s and 1850s); this was not to be, as Bonar Law won an overall majority.
Some Liberal candidates stood calling for a reunited Liberal party whilst others appear to have backed both Asquith and Lloyd George. Few sources are able to agree on exact numbers, and even in contemporary records held by the two groups some MPs were claimed for both sides. It was the first election where Labour surpassed the combined strength of both Liberal parties in votes and seats.
By one estimate there were 29 seats where Liberals stood against one another. This is thought to have cost them at least 14 seats, 10 of them to Labour, so in theory a reunited Liberal Party would have been much closer to, and perhaps even ahead of, Labour in terms of seats. However, in reality the two factions were on poor terms and Lloyd George was still hoping for a renewed coalition with the Conservatives.[2]
Results
↓
| 344 |
142 |
62 |
53 |
14 |
| Conservative |
Labour |
Lib |
NL |
O |
UK General Election 1922
|
Candidates |
Votes |
| Party |
Leader |
Standing |
Elected |
Gained |
Unseated |
Net |
% of total |
% |
No. |
Net % |
| |
Conservative |
Andrew Bonar Law |
482 |
344 |
|
|
+ 12 |
55.9 |
38.5 |
5,294,465 |
+6.0 |
| |
Labour |
J. R. Clynes |
414 |
142 |
|
|
+ 85 |
23.1 |
29.7 |
4,076,665 |
+8.9 |
| |
Liberal |
H. H. Asquith |
334 |
62 |
|
|
+ 26 |
10.1 |
18.9 |
2,601,486 |
+5.9 |
| |
National Liberal |
David Lloyd George |
155 |
53 |
|
|
– 74 |
8.6 |
9.9 |
1,355,366 |
−2.7 |
| |
Independent Conservative |
N/A |
20 |
3 |
3 |
1 |
+ 2 |
0.5 |
0.9 |
116,861 |
+0.5 |
| |
Independent |
N/A |
15 |
3 |
3 |
2 |
+ 1 |
0.5 |
0.8 |
114,697 |
−0.2 |
| |
Nationalist |
Joseph Devlin |
4 |
3 |
2 |
6 |
– 4 |
0.5 |
0.4 |
57,641 |
−1.8 |
| |
Communist |
Albert Inkpin |
5 |
2 |
2 |
0 |
+ 2 |
0.17 |
0.2 |
30,684 |
N/A |
| |
Agriculturalist |
Harry German |
4 |
0 |
0 |
0 |
0 |
|
0.2 |
21,510 |
0.0 |
| |
Independent Labour |
N/A |
4 |
1 |
0 |
1 |
– 1 |
0.17 |
0.1 |
18,419 |
−1.0 |
| |
Constitutionalist |
N/A |
1 |
1 |
1 |
0 |
+ 1 |
0.17 |
0.1 |
16,662 |
N/A |
| |
Scottish Prohibition |
Edwin Scrymgeour |
1 |
1 |
1 |
0 |
+ 1 |
0.17 |
0.1 |
16,289 |
+0.1 |
| |
Independent Liberal |
N/A |
3 |
1 |
1 |
1 |
0 |
0.17 |
0.1 |
13,197 |
−0.1 |
| |
Independent Unionist |
N/A |
1 |
0 |
0 |
0 |
0 |
|
0.1 |
9,861 |
N/A |
| |
Independent Communist |
N/A |
1 |
0 |
0 |
0 |
0 |
|
0.0 |
4,027 |
N/A |
| |
Anti-Parliamentary Communist |
Guy Aldred |
1 |
0 |
0 |
0 |
0 |
|
0.0 |
470 |
N/A |
Total votes cast: 13,748,300. Turnout 73.0%.[3] All parties shown. Conservatives include Ulster Unionists. National Liberals were party formed by Lloyd George's Coalition Liberals after leaving the government. Their net seat change is compared with the Coalition Liberals' number of seats after the 1918 election.
Votes summary
| Popular vote |
|---|
|
|
|
|
|
| Conservative |
|
38.51% |
| Labour |
|
29.65% |
| Liberal |
|
18.92% |
| National Liberal |
|
9.86% |
| Independent |
|
2.01% |
| Nationalist |
|
0.42% |
| Communist |
|
0.22% |
| Others |
|
0.41% |
Seats summary
| Parliamentary seats |
|---|
|
|
|
|
|
| Conservative |
|
55.93% |
| Labour |
|
23.09% |
| Liberal |
|
10.08% |
| National Liberal |
|
8.62% |
| Independent |
|
1.3% |
| Nationalist |
|
0.49% |
| Communist |
|
0.16% |
| Others |
|
0.33% |
See also
References
External links