Broxtowe (UK Parliament constituency)
| Broxtowe | |
|---|---|
|
County constituency for the House of Commons | |
|
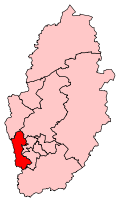
Boundary of Broxtowe in Nottinghamshire. | |
|
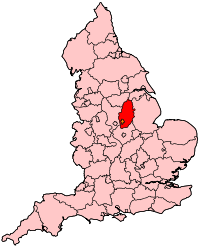
Location of Nottinghamshire within England. | |
| County | Nottinghamshire |
| Population | 94,971 (2011 census)[1] |
| Electorate | 71,961 (December 2010)[2] |
| Current constituency | |
| Created | 1983 |
| Member of parliament | Anna Soubry (Conservative) |
| Number of members | One |
| Created from | Beeston[3] |
| 1918–1955 | |
| Number of members | One |
| Type of constituency | County constituency |
| Overlaps | |
| European Parliament constituency | East Midlands |
Broxtowe is a constituency[n 1] represented in the House of Commons of the UK Parliament since 2010 by Anna Soubry of the Conservative Party.[n 2]
Constituency profile
Broxtowe constituency is a suburban constituency located in Nottinghamshire, to the west of the city of Nottingham, almost identical in character to the seat of Gedling to the east of Nottingham. The constituency's name is derived from the old Broxtowe wapentake of Nottinghamshire, which covered a larger area.
The most recent two election results suggest it is a marginal seat between the Labour and the Conservative parties.
Boundaries
1918-1950: The Urban Districts of Arnold, Eastwood, Hucknall, and Kirkby-in-Ashfield, and in the Rural District of Basford the civil parishes of Annesley, Bestwood Park, Brinsley, Calverton, Felley, Greasley, Kimberley, Lambley, Linby, Newstead, Papplewick, Selston, and Woodborough.
1950-1955: The Urban Districts of Eastwood, Hucknall, and Kirkby-in-Ashfield, and in the Rural District of Basford the civil parishes of Annesley, Awsworth, Bestwood Park, Brinsley, Cossall, Felley, Greasley, Kimberley, Linby, Newstead, Nuthall, Papplewick, Selston, Strelley, and Trowell.
1983-2010: The Borough of Broxtowe wards of Attenborough, Awsworth and Cossall, Beeston Central, Beeston North East, Beeston North West, Beeston Rylands, Bramcote, Chilwell East, Chilwell West, Greasley, Kimberley, Nuthall, Stapleford East, Stapleford North, Stapleford West, Strelley and Trowell, and Toton.
2010-present: The Borough of Broxtowe wards of Attenborough, Awsworth, Beeston Central, Beeston North, Beeston Rylands, Beeston West, Bramcote, Chilwell East, Chilwell West, Cossall and Kimberley, Greasley Giltbrook and Newthorpe, Nuthall East and Strelley, Nuthall West and Greasley Watnall, Stapleford North, Stapleford South East, Stapleford South West, Toton and Chilwell Meadows, and Trowell.
Members of Parliament
When the seat was recreated in 1983, the Conservative Sir Jim Lester represented it until the seat was gained in 1997 by Labour's Nick Palmer, but the Conservatives' Anna Soubry only just regained it in 2010. She held the seat with a much-increased majority in 2015.
MPs 1918–1955
| Election | Member[4][5] | Party | Notes | |
|---|---|---|---|---|
| 1918 | George Spencer | Labour | ||
| 1929 | Seymour Cocks | Labour | Died in office May 1953 | |
| 1953 by-election | Will Warbey | Labour | ||
| 1955 | constituency abolished | |||
MPs since 1983
| Election | Member[5][6] | Party | |
|---|---|---|---|
| 1983 | Jim Lester | Conservative | |
| 1997 | Nick Palmer | Labour | |
| 2010 | Anna Soubry | Conservative | |
Elections
Elections in the 2010s
| Party | Candidate | Votes | % | ± | |
|---|---|---|---|---|---|
| Conservative | Anna Mary Soubry | 24,163 | 45.2 | +6.2 | |
| Labour | Nicholas Douglas Palmer | 19,876 | 37.2 | -1.1 | |
| UKIP | Frank Dunne | 5,674 | 10.6 | +8.4 | |
| Liberal Democrat | Stanley Heptinstall | 2,120 | 4.0 | -12.9 | |
| Green | David Kirwan | 1,544 | 2.9 | +2.1 | |
| Justice for Men and Boys | Ray Barry | 63 | 0.1 | N/A | |
| Majority | 4,287 | 8.0 | +7.3 | ||
| Turnout | 53,440 | 74.4 | +1.2 | ||
| Conservative hold | Swing | +3.65 | |||
| Party | Candidate | Votes | % | ± | |
|---|---|---|---|---|---|
| Conservative | Anna Mary Soubry | 20,585 | 39.0 | +1.8 | |
| Labour | Nicholas Douglas Palmer | 20,196 | 38.3 | -3.4 | |
| Liberal Democrat | David Watts | 8,907 | 16.9 | +0.8 | |
| BNP | Michael Shore | 1,422 | 2.7 | +2.7 | |
| UKIP | Chris Cobb | 1,194 | 2.3 | +0.8 | |
| Green | David Mitchell | 423 | 0.8 | -1.1 | |
| Majority | 389 | 0.7 | |||
| Turnout | 52,727 | 73.2 | +4.2 | ||
| Conservative gain from Labour | Swing | +2.6 | |||
Elections in the 2000s
| Party | Candidate | Votes | % | ± | |
|---|---|---|---|---|---|
| Labour | Nicholas Douglas Palmer | 20,457 | 41.9 | -6.7 | |
| Conservative | Bob Seely | 18,161 | 37.2 | +0.5 | |
| Liberal Democrat | David Watts | 7,837 | 16.1 | +1.4 | |
| Green | Paul Anderson | 896 | 1.8 | N/A | |
| UKIP | Patricia Wolfe | 695 | 1.4 | N/A | |
| Veritas | Damian Hockney | 590 | 1.2 | N/A | |
| Independent | Mark Gregory | 170 | 0.3 | N/A | |
| Majority | 2,296 | 4.7 | |||
| Turnout | 48,806 | 68.6 | +2.1 | ||
| Labour hold | Swing | -3.6 | |||
| Party | Candidate | Votes | % | ± | |
|---|---|---|---|---|---|
| Labour | Nicholas Douglas Palmer | 23,836 | 48.6 | +1.6 | |
| Conservative | Pauline Elizabeth Latham | 17,963 | 36.7 | -0.8 | |
| Liberal Democrat | David K. Watts | 7,205 | 14.7 | +2.8 | |
| Majority | 5,873 | 11.9 | |||
| Turnout | 49,004 | 66.5 | -11.8 | ||
| Labour hold | Swing | ||||
Elections in the 1990s
| Party | Candidate | Votes | % | ± | |
|---|---|---|---|---|---|
| Labour | Nicholas Douglas Palmer | 27,343 | 47.0 | +12.2 | |
| Conservative | James Theodore Lester | 21,768 | 37.4 | -13.6 | |
| Liberal Democrat | Terence P. Miller | 6,934 | 11.9 | -1.9 | |
| Referendum | Roy Tucker | 2,092 | 3.6 | N/A | |
| Majority | 5,575 | 9.6 | |||
| Turnout | 58,133 | 78.3 | -5.1 | ||
| Labour gain from Conservative | Swing | ||||
| Party | Candidate | Votes | % | ± | |
|---|---|---|---|---|---|
| Conservative | James Theodore Lester | 31,096 | 51.0 | -2.6 | |
| Labour | James R.W. Walker | 21,205 | 34.8 | +10.4 | |
| Liberal Democrat | John D. Ross | 8,395 | 13.8 | -8.3 | |
| Natural Law | David Lukehurst | 293 | 0.5 | N/A | |
| Majority | 9,891 | 16.2 | −13.1 | ||
| Turnout | 60,989 | 83.4 | +4.2 | ||
| Conservative hold | Swing | −6.6 | |||
Elections in the 1980s
| Party | Candidate | Votes | % | ± | |
|---|---|---|---|---|---|
| Conservative | James Theodore Lester | 30,462 | 53.6 | +0.1 | |
| Labour | Ken Fleet | 13,811 | 24.3 | +3.0 | |
| Liberal | Keith M. Melton | 12,562 | 22.1 | −2.1 | |
| Majority | 16,651 | 29.3 | +1.0 | ||
| Turnout | 71,780 | 79.2 | +2.7 | ||
| Conservative hold | Swing | ||||
| Party | Candidate | Votes | % | ± | |
|---|---|---|---|---|---|
| Conservative | James Theodore Lester | 28,522 | 53.5 | N/A | |
| Liberal | Keith M. Melton | 13,444 | 25.2 | N/A | |
| Labour | M. Warner | 11,368 | 21.3 | N/A | |
| Majority | 15,078 | 28.3 | N/A | ||
| Turnout | 69,760 | 76.5 | N/A | ||
| Conservative win (new seat) | |||||
Elections in the 1950s
| Party | Candidate | Votes | % | ± | |
|---|---|---|---|---|---|
| Labour | William Noble Warbey | 27,356 | 74.1 | +1.4 | |
| Conservative | Anthony J Gorman | 9,559 | 25.9 | -1.4 | |
| Majority | 17,797 | 48.2 | +2.8 | ||
| Turnout | 63.5 | -20.6 | |||
| Labour hold | Swing | +1.4 | |||
| Party | Candidate | Votes | % | ± | |
|---|---|---|---|---|---|
| Labour | Frederick Seymour Cocks | 35,317 | 72.68 | ||
| Conservative | Anthony J Gorman | 13,274 | 27.32 | ||
| Majority | 22,043 | 45.36 | |||
| Turnout | 84.09 | ||||
| Labour hold | Swing | ||||
| Party | Candidate | Votes | % | ± | |
|---|---|---|---|---|---|
| Labour | Frederick Seymour Cocks | 35,471 | 72.51 | ||
| Conservative | C Peter B Bailey | 13,445 | 27.49 | ||
| Majority | 22,026 | 45.03 | |||
| Turnout | 86.10 | ||||
| Labour hold | Swing | ||||
Election in the 1940s
| Party | Candidate | Votes | % | ± | |
|---|---|---|---|---|---|
| Labour | Frederick Seymour Cocks | 39,545 | 72.05 | ||
| Conservative | Gerald Stanley Moore Bowman | 15,344 | 27.95 | ||
| Majority | 24,201 | 44.09 | |||
| Turnout | 78.45 | ||||
| Labour hold | Swing | ||||
Elections in the 1930s
| Party | Candidate | Votes | % | ± | |
|---|---|---|---|---|---|
| Labour | Frederick Seymour Cocks | 26,854 | 62.95 | ||
| Conservative | Paul Eyre Springman | 15,804 | 37.05 | ||
| Majority | 11,050 | 25.90 | |||
| Turnout | 73.49 | ||||
| Labour hold | Swing | ||||
| Party | Candidate | Votes | % | ± | |
|---|---|---|---|---|---|
| Labour | Frederick Seymour Cocks | 21,917 | 51.88 | ||
| Conservative | Paul Eyre Springman | 20,327 | 48.12 | ||
| Majority | 1,590 | 3.76 | |||
| Turnout | 78.57 | ||||
| Labour hold | Swing | ||||
Elections in the 1920s
| Party | Candidate | Votes | % | ± | |
|---|---|---|---|---|---|
| Labour | Frederick Seymour Cocks | 24,603 | 59.2 | ||
| Liberal | Ernest George Cove | 9,814 | 23.6 | ||
| Unionist | Gervas Evelyn Pierrepont | 7,119 | 17.2 | ||
| Majority | 14,789 | 35.6 | |||
| Turnout | |||||
| Labour hold | Swing | ||||
| Party | Candidate | Votes | % | ± | |
|---|---|---|---|---|---|
| Labour | George Alfred Spencer | 13,219 | 54.5 | +3.7 | |
| Liberal | George Julian Selwyn Scovell | 11,049 | 45.5 | -3.7 | |
| Majority | 2,170 | 9.0 | +7.4 | ||
| Turnout | 62.0 | +2.2 | |||
| Labour hold | Swing | +3.7 | |||
See also
- List of Parliamentary constituencies in Nottinghamshire
- Opinion polling for the next United Kingdom general election in individual constituencies
Notes
- ↑ A county constituency (for the purposes of election expenses and type of returning officer)
- ↑ As with all constituencies, the constituency elects one Member of Parliament (MP) by the first past the post system of election at least every five years.
References
- ↑ "Broxtowe: Usual Resident Population, 2011". Neighbourhood Statistics. Office for National Statistics. Retrieved 7 February 2015.
- ↑ "Electorate Figures - Boundary Commission for England". 2011 Electorate Figures. Boundary Commission for England. 4 March 2011. Archived from the original on 6 November 2010. Retrieved 13 March 2011.
- ↑ "'Beeston', Feb 1974 - May 1983". ElectionWeb Project. Cognitive Computing Limited. Retrieved 16 March 2016.
- ↑ "Broxtowe 1918-1955". Hansard 1803-2005. UK Parliament. Retrieved 7 February 2015.
- 1 2 Leigh Rayment's Historical List of MPs – Constituencies beginning with "B" (part 6)
- ↑ "Broxtowe 1983-". Hansard 1803-2005. UK Parliament. Retrieved 7 February 2015.
- ↑ "Election Data 2015". Electoral Calculus. Archived from the original on 17 October 2015. Retrieved 17 October 2015.
- ↑ http://www.bbc.co.uk/news/politics/constituencies/E14000607
- ↑ "Election Data 2010". Electoral Calculus. Archived from the original on 17 October 2015. Retrieved 17 October 2015.
- ↑ "Election Data 2005". Electoral Calculus. Archived from the original on 15 October 2011. Retrieved 18 October 2015.
- ↑ "Election Data 2001". Electoral Calculus. Archived from the original on 15 October 2011. Retrieved 18 October 2015.
- ↑ "Election Data 1997". Electoral Calculus. Archived from the original on 15 October 2011. Retrieved 18 October 2015.
- 1 2 3 4 "Broxtowe [Archive]". politicsresources.net.
- ↑ "Election Data 1992". Electoral Calculus. Archived from the original on 15 October 2011. Retrieved 18 October 2015.
- ↑ "Election Data 1987". Electoral Calculus. Archived from the original on 15 October 2011. Retrieved 18 October 2015.
- ↑ "Election Data 1983". Electoral Calculus. Archived from the original on 15 October 2011. Retrieved 18 October 2015.
- ↑ British Parliamentary Election Results 1918-1949, FWS Craig
- ↑ British Parliamentary Election Results 1918-1973, FWS Craig
External links
- nomis Constituency Profile for Broxtowe — presenting data from the ONS annual population survey and other official statistics.
Coordinates: 52°54′N 1°15′W / 52.90°N 1.25°W