United Kingdom general election, 1832
| | |||||||||||||||||||||||||||||||||||||||||||||||||||
| |||||||||||||||||||||||||||||||||||||||||||||||||||
| |||||||||||||||||||||||||||||||||||||||||||||||||||
|
| |||||||||||||||||||||||||||||||||||||||||||||||||||
| Colours denote the winning party. | |||||||||||||||||||||||||||||||||||||||||||||||||||
| |||||||||||||||||||||||||||||||||||||||||||||||||||


| 1830 election • MPs |
| 1831 election • MPs |
| 1832 election • MPs |
| 1835 election • MPs |
| 1837 election • MPs |
The 1832 United Kingdom general election, the first after the Reform Act, saw the Whigs win a large majority, with the Tories winning less than 30% of the vote.
Parties and leaders at the general election
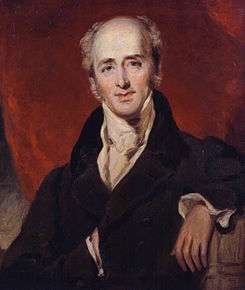
The Earl Grey had been Prime Minister since 22 November 1830. His headed the first predominantly Whig administration since the Ministry of all the Talents in 1806–1807.
In addition to the Whigs themselves, Grey was supported by Radical and other allied politicians. The Whigs and their allies were gradually coming to be referred to as Liberals, but no formal Liberal Party had been established at the time of this election, so all the politicians supporting the ministry are referred to as Whig in the above results.
The government Leader of the House of Commons since 1830, was Viscount Althorp (the heir of the Earl Spencer), who also served as Chancellor of the Exchequer.
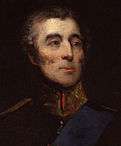
The last Tory Prime Minister, at the time of the 1832 election, was the Duke of Wellington. After leaving government office, Wellington continued to lead the Tory peers and was the overall Leader of the Opposition.
The Tory Leader of the Opposition in the House of Commons, was Sir Robert Peel, Bt.
John Wilson Croker had used the term conservative in 1830, but the Tories at the time of this general election had not yet become generally known as the Conservative Party. This distinction would finally take hold after the Liberal Party was officially created.
In Irish politics, Daniel O'Connell was continuing his campaign for repeal of the Act of Union. He had founded the Irish Repeal Association and it presented candidates independent of the two principal parties.
Dates of election
Following the passage of the Reform Act 1832 and related legislation to reform the electoral system and redistribute constituencies, the tenth United Kingdom Parliament was dissolved on 3 December 1832. The new Parliament was summoned to meet on 29 January 1833, for a maximum seven-year term from that date. The maximum term could be and normally was curtailed, by the monarch dissolving the Parliament, before its term expired.
At this period there was not one election day. After receiving a writ (a royal command) for the election to be held, the local returning officer fixed the election timetable for the particular constituency or constituencies he was concerned with. Polling in seats with contested elections could continue for many days.
The general election took place between December 1832 and January 1833. The first nomination was on 8 December, with the first contest on 10 December and the last contest on 8 January 1833. It was usual for polling in the University constituencies and in Orkney and Shetland to take place about a week after other seats. Disregarding contests in the Universities and Orkney and Shetland, the last poll was on 1 January 1833.
Summary of the constituencies
For the distribution of constituencies in the Unreformed House of Commons, before this general election, see the United Kingdom general election, 1831. Apart from the disenfranchisement of Grampound for corruption in 1821 and the transfer of its two seats as additional members for Yorkshire from 1826, there had been no change in the constituencies of England since the 1670s. In some cases the county and borough seats had remained unaltered since the thirteenth century. Welsh constituencies had been unchanged since the sixteenth century. Those in Scotland had remained the same since 1708 and in Ireland since 1801.
In 1832 politicians were facing an unfamiliar electoral map, as well as an electorate including those qualified under a new uniform householder franchise in the boroughs. However the reform legislation had not removed all the anomalies in the electoral system.
Table of largest and smallest electorates 1832, by country, type and number of seats
| Country | Type | Seats | Largest constituency | Largest electorate | Smallest constituency | Smallest electorate |
|---|---|---|---|---|---|---|
| England | Borough | 1 | Salford | 1,497 | Reigate | 153 |
| 2 | Westminster | 11,576 | Thetford | 146 | ||
| 4 | City of London | 18,584 | ... | ... | ||
| County | 1 | Isle of Wight | 1,167 | ... | ... | |
| 2 | West Riding of Yorkshire | 18,056 | Rutland | 1,296 | ||
| 3 | Cambridgeshire | 6,435 | Oxfordshire | 4,721 | ||
| University | 2 | Oxford University | 2,496 | Cambridge University | 2,319 | |
| Wales | Borough | 1 | Flint Boroughs | 1,359 | Brecon | 242 |
| County | 1 | Pembrokeshire | 3,700 | Merionethshire | 580 | |
| 2 | Carmarthenshire | 3,887 | Denbighshire | 3,401 | ||
| Scotland | Burgh | 1 | Aberdeen | 2,024 | Wigtown Burghs | 316 |
| 2 | Glasgow | 6,989 | Edinburgh | 6,048 | ||
| County | 1 | Perthshire | 3,180 | Sutherland | 84 | |
| Ireland | Borough | 1 | Carrickfergus | 1,024 | Lisburn | 91 |
| 2 | Dublin | 7,008 | Waterford | 1,241 | ||
| County | 2 | County Cork | 3,835 | County Kildare | 1,112 | |
| University | 2 | Dublin University | 2,073 | ... | ... | |
Key to categories in the following tables: BC – Borough/Burgh constituencies, CC – County constituencies, UC – University constituencies, Total C – Total constituencies, BMP – Borough/Burgh Members of Parliament, CMP – County Members of Parliament, UMP – University Members of Parliament.
Monmouthshire (1 County constituency with 2 MPs and one single member Borough constituency) is included in Wales in these tables. Sources for this period may include the county in England.
Table 1: Constituencies and MPs, by type and country
| Country | BC | CC | UC | Total C | BMP | CMP | UMP | Total MPs |
|---|---|---|---|---|---|---|---|---|
| England | 186 | 68 | 2 | 256 | 322 | 142 | 4 | 468 |
| Wales | 15 | 13 | 0 | 28 | 15 | 17 | 0 | 32 |
| Scotland | 21 | 30 | 0 | 51 | 23 | 30 | 0 | 53 |
| Ireland | 33 | 32 | 1 | 66 | 39 | 64 | 2 | 105 |
| Total | 255 | 143 | 3 | 401 | 399 | 253 | 6 | 658 |
Table 2: Number of seats per constituency, by type and country
| Country | BCx1 | BCx2 | BCx4 | CCx1 | CCx2 | CCx3 | UCx2 | Total C |
|---|---|---|---|---|---|---|---|---|
| England | 52 | 133 | 1 | 1 | 60 | 7 | 2 | 256 |
| Wales | 15 | 0 | 0 | 9 | 4 | 0 | 0 | 28 |
| Scotland | 19 | 2 | 0 | 30 | 0 | 0 | 0 | 51 |
| Ireland | 27 | 6 | 0 | 0 | 32 | 0 | 1 | 66 |
| Total | 113 | 141 | 1 | 40 | 96 | 7 | 3 | 401 |
Results
| United Kingdom general election 1832 | |||||||||||||||
|---|---|---|---|---|---|---|---|---|---|---|---|---|---|---|---|
| Candidates | Votes | ||||||||||||||
| Party | Standing | Elected | Gained | Unseated | Net | % of total | % | № | Net % | ||||||
| Whig | 636 | 441 | 67.02 | 67.01 | 554,719 | ||||||||||
| Tory | 350 | 175 | 26.60 | 29.15 | 241,284 | ||||||||||
| Irish Repeal | 51 | 42 | 6.38 | 3.84 | 31,773 | ||||||||||
Total votes cast: 827,776
| Party | Candidates | Unopposed | Seats | |
|---|---|---|---|---|
| Whig | 636 | 109 | 441 | |
| Tory | 350 | 66 | 175 | |
| Irish Repeal | 51 | 14 | 42 | |
| Total | 1,037 | 189 | 658 | |
Voting summary
Seats summary
Regional results
Great Britain
| Party | Seats | Seats change | Votes | % | % Change | |
|---|---|---|---|---|---|---|
| Whig | 408 | 525,706 | 71.1 | |||
| Tory | 147 | 213,254 | 28.9 | |||
| Total | 555 | 738,960 | 100 | |||
England
| Party | Seats | Seats change | Votes | % | % Change | |
|---|---|---|---|---|---|---|
| Whig | 347 | 474,542 | 70.8 | |||
| Tory | 117 | 193,442 | 29.2 | |||
| Total | 464 | 667,984 | 100 | |||
Scotland
| Party | Seats | Seats change | Votes | % | % Change | |
|---|---|---|---|---|---|---|
| Whig | 43 | 44,003 | 79.0 | |||
| Tory | 10 | 9,752 | 21.0 | |||
| Total | 53 | 53,755 | 100 | |||
Wales
| Party | Seats | Seats change | Votes | % | % Change | |
|---|---|---|---|---|---|---|
| Whig | 18 | 6,348 | 46.6 | |||
| Tory | 14 | 7,466 | 53.4 | |||
| Total | 32 | 13,814 | 100 | |||
Ireland
| Party | Seats | Seats change | Votes | % | % Change | |
|---|---|---|---|---|---|---|
| Irish Repeal | 42 | 31,773 | 34.6 | |||
| Whig | 33 | 29,013 | 33.3 | |||
| Tory | 28 | 28,030 | 32.1 | |||
| Total | 103 | 88,816 | 100 | |||
Universities
| Party | Seats | Seats change | Votes | % | % Change | |
|---|---|---|---|---|---|---|
| Tory | 6 | 2,594 | 76.2 | |||
| Whig | 0 | 813 | 23.8 | |||
| Total | 6 | 3,407 | 100 | |||
See also
- List of United Kingdom general elections
- List of MPs elected in the United Kingdom general election, 1832
References
- F. W. S. Craig, British Electoral Facts: 1832–1987
- British Electoral Facts 1832–1999, compiled and edited by Colin Rallings and Michael Thrasher (Ashgate Publishing Ltd 2000)
- Parliamentary Election Results in Ireland 1801–1922, edited by B.M. Walker (Royal Irish Academy 1978)
- Spartacus: Political Parties and Election Results
| General elections |
|
|---|---|
| Local elections |
|
| European elections | |
| Referendums | |
| |