Election results in 2005
January
January 2: Croatia
| Candidates and nominating parties | Votes | % | Votes | % |
|---|---|---|---|---|
| Stjepan Mesić - Croatian People's Party and others | 1,089,398 | 48.92 | 1,454,451 | 65.93 |
| Jadranka Kosor - Croatian Democratic Union | 452,218 | 20.31 | 751,692 | 34.07 |
| Boris Mikšić | 396,093 | 17.78 | - | - |
| Đurđa Adlešič - Croatian Social Liberal Party | 59,795 | 2.68 | - | - |
| Slaven Letica - Croatian Party of Rights | 57,748 | 2.59 | - | - |
| Ljubo Ćesić | 41,216 | 1.85 | - | - |
| Ivić Pašalić - Croatian Bloc - Movement for a Modern Croatia | 40,637 | 1.82 | - | - |
| Anto Kovačević - Croatian Christian Democratic Union | 19,145 | 0.86 | - | - |
| Miroslav Blažević | 17,847 | 0.80 | - | - |
| Miroslav Rajh - Croatian Youth Party | 14,766 | 0.66 | - | - |
| Doris Košta | 8,721 | 0.37 | - | - |
| Mladen Kešer | 7,056 | 0.32 | - | - |
| Tomislav Petrak - Croatian Popular Party | 2,614 | 0.12 | - | - |
| Invalid votes | 20,269 | 35,617 | ||
| Total (turnout 50.57 %) | 2,227,073 | 100.0 | 2,241,760 | 100.0 |
| Registered voters | 4,403,933 | 4,392,220 | ||
| Source: State Election Committee (Državno izborno povjerenstvo) Official results | ||||
January 9: Palestine
.svg.png) |
| This article is part of a series on the politics and government of Palestine |
|
Officeholders whose status is disputed are shown in italics |
|
National symbols |
|
Legislative Council |
|
Administrative divisions |
| Candidates – Nominating parties | Votes | % |
|---|---|---|
| Mahmoud Abbas – Fatah or Liberation Movement of Palestine (Harakat al-Tahrâr al-Filistini) | 501,448 | 62.52 |
| Mustafa Barghouti – Independent | 156,227 | 19.48 |
| Taysir Khalid – Democratic Front for the Liberation of Palestine (Al-Jabhah al-Dimuqratiyah Li-Tahrir Filastin) | 26,848 | 3.35 |
| Abdel Halim al-Ashqar – Independent | 22,171 | 2.76 |
| Bassam al-Salhi – Palestinian People's Party (Hizb al-Sha'b al-Filastini) | 21,429 | 2.67 |
| Sayyid Barakah – Independent | 10,406 | 1.30 |
| Abdel Karim Shubeir – Independent | 5,717 | 0.71 |
| Invalid Ballots | 30,672 | 3.82 |
| Blank Ballots | 27,159 | 3.39 |
| Total (turnout %) | 802,077 | 100.0 |
| Source: Central Elections Commission | ||
January 12: Abkhazia
 |
| This article is part of a series on the politics and government of Abkhazia |
| See also |
| Presidential candidate | Vice presidential candidate | Votes | % |
|---|---|---|---|
| Sergei Bagapsh | Raul Khadjimba | 69,328 | 91.54 |
| Iakub Lakoba | Stella Gunia | 3,549 | 4.69 |
| Against all | 1,988 | 2.63 | |
| Invalid | 868 | 1.15 | |
| Total amount of votes cast | 75,733 | 100.00 | |
| Turnout | 75,733 | 58.65 | |
| Abstention | 53,394 | 41.35 | |
| Total number of registered voters | 129,127 | 100.00 | |
| Source: Протокол N 7 Центральной избирательной комиссии по выборам Президента Республики Абхазия от 14 января 2005 г. | |||
January 22: Maldives
 |
| This article is part of a series on the politics and government of the Maldives |
| Government |
|
Legislature
|
|
|
|
| Candidates | Seats |
|---|---|
| Non-partisans supporting the government | 28 |
| Non-partisans endorsed by the Maldivian Democratic Party | 10 |
| Others | 2 |
| Appointed members | 8 |
| Total | 48 |
| Source: Adam Carr | |
January 30: Iraq
_of_Iraq_2008.svg.png) |
| This article is part of a series on the politics and government of Iraq |
| Constitution |
|
Legislature |
|
Judiciary |
|
February
February 6: Thailand
 |
| This article is part of a series on the politics and government of Thailand |
|
|
|
|
|
| Parties | Votes | % | Seats |
|---|---|---|---|
| Thai Loves Thais Party (Phak Thai Rak Thai) | 60.7 | 375 | |
| Democrat Party (Phak Prachatipat) | 18.3 | 96 | |
| Thai Nation Party (Phak Chart Thai) | 11.4 | 27 | |
| Great People's Party (Phak Machacon) | 8.3 | 2 | |
| Phak Khonkhoplodnee (Khonkhoplodnee Party) | 0.6 | - | |
| New Aspiration Party (Phak Khwam Wang Mai) | 0.4 | - | |
| Total (turnout 72%) | 500 | ||
| Source: Angus Reid, The Nation and Adam Carr's Electoral Archives | |||
February 8: Denmark
 |
| This article is part of a series on the politics and government of Denmark |
|
|
| Parties | Leaders | Votes | % | Seats | +/- |
|---|---|---|---|---|---|
| Venstre (Liberals) (V) | Anders Fogh Rasmussen | 974,657 | 29.0 | 52 | −4 |
| Social Democrats (Socialdemokraterne) (A) | Mogens Lykketoft | 867,933 | 25.9 | 47 | −5 |
| Danish People's Party (Dansk Folkeparti) (O) | Pia Kjærsgaard | 444,205 | 13.2 | 24 | 2 |
| Conservative People's Party (Det Konservative Folkeparti) (C) | Bendt Bendtsen | 345,132 | 10.3 | 18 | 2 |
| Danish Social Liberal Party (Det Radikale Venstre) (B) | Marianne Jelved | 307,132 | 9.2 | 17 | 8 |
| Socialist People's Party (Socialistisk Folkeparti) (F) | Holger K. Nielsen | 201,162 | 6.0 | 11 | −1 |
| Red-Green Alliance (Enhedslisten) (Ø) | Collective Leadership | 111,394 | 3.4 | 6 | 2 |
| Christian Democrats (Kristendemokraterne) (K) | Marianne Karlsmose | 57,836 | 1.7 | 0 | −4 |
| Centre Democrats (Centrum-Demokraterne) (D) | Mimi Jakobsen | 33,635 | 1.0 | 0 | 0 |
| Minority Party (Minoritetspartiet) (M) | Rune Engelbreth Larsen | 8,883 | 0.3 | 0 | N/A |
| Siumut (Forward) (Greenland) | Lars Emil Johansen | 7,775 | 33.6 | 1 | N/A |
| Inuit Ataqatigiit (Inuit Community) (Greenland) | Kuupik Kleist | 5,785 | 25.0 | 1 | N/A |
| Republican Party (Tjóðveldisflokkurin) (Faroe Islands) | Høgni Hoydal | 6,301 | 25.3 | 1 | N/A |
| People's Party (Fólkaflokkurin) (Faroe Islands) | Anfinn Kallsberg | 5,997 | 24.1 | 1 | N/A |
| Total (Turnout 84.4 %) | 179 | 0 |
February 20: Portugal
 |
| This article is part of a series on the politics and government of Portugal |
| Constitution |
|
Legislature |
| Foreign relations |
| Parties | Votes | % | ± | MPs | MPs %/ votes % | |||||
|---|---|---|---|---|---|---|---|---|---|---|
| 2002 | 2005 | ± | % | ± | ||||||
| Socialist | 2,588,312 | 45.03 | 96 | 121 | 52.61 | 1.17 | ||||
| Social Democratic[A] | 1,653,425 | 28.77 | 105 | 75 | 32.61 | 1.13 | ||||
| Unitary Democratic Coalition[B] | 433,369 | 7.54 | 12 | 14 | 6.09 | 0.81 | ||||
| People's | 416,415 | 7.24 | 14 | 12 | 5.22 | 0.72 | ||||
| Left Bloc | 364,971 | 6.35 | 3 | 8 | 3.48 | 0.55 | ||||
| Portuguese Workers' Communist | 48,186 | 0.84 | 0 | 0 | 0.00 | 0.0 | ||||
| New Democracy | 40,358 | 0.70 | N/A | N/A | 0 | N/A | 0.00 | N/A | 0.0 | |
| Humanist Party | 17,056 | 0.30 | 0 | 0 | 0.00 | 0.0 | ||||
| National Renovator Party | 9,374 | 0.16 | 0 | 0 | 0.00 | 0.0 | ||||
| Workers Party of Socialist Unity | 5,535 | 0.10 | 0 | 0 | 0.00 | 0.0 | ||||
| Democratic Party of the Atlantic[C] | 1,681 | 0.03 | N/A | N/A | 0 | N/A | 0.00 | N/A | 0.0 | |
| Total valid | 5,578,782 | 97.06 | 230 | 230 | 100.00 | — | ||||
| Blank ballots | 103,537 | 1.80 | ||||||||
| Invalid ballots | 65,515 | 1.14 | ||||||||
| Total (turnout 64.26%) | 5,747,834 | 100.00 | ||||||||
| A From the Social Democratic electoral lists were elected two MPs from the People's Monarchist Party and other two MPs from Earth Party. B Portuguese Communist Party (12 MPs) and "The Greens" (2 MPs) ran in coalition.[1] C Democratic Party of the Atlantic electoral list only in Azores. | ||||||||||
| Source: Comissão Nacional de Eleições | ||||||||||
February 20: Northern Cyprus
 |
| This article is part of a series on the politics and government of Northern Cyprus |
| Parties | Votes | % | Seats |
|---|---|---|---|
| Republican Turkish Party (Cumhuriyetçi Türk Partisi) | 44.5 | 25 | |
| National Unity Party (Ulusal Birlik Partisi) | 31.7 | 16 | |
| Democratic Party (Demokrat Partisi) | 13.5 | 5 | |
| Peace and Democracy Movement (Barış ve Demokrasi Hareketi) | 5.8 | 1 | |
| Communal Liberation Party (Toplumcu Kurtuluş Partisi) | 2.4 | - | |
| New Party (Yeni Parti) | 1.6 | - | |
| Independents | 3 | ||
| Total (turnout 80.8 %) | 50 | ||
| Source: TurkishPress.com. The results include the two new MPs elected during by-elections held in 2006, filling two vacancies opened when MPs Mehmet Ali Talat became president and Salih Miroğlu died. | |||
February 21: Anguilla
 |
| This article is part of a series on the politics and government of Anguilla |
| Parties | Votes | % | Seats | ||
|---|---|---|---|---|---|
| Anguilla United Front | 2,177 | 39.1 | 4 | ||
| Anguilla Strategic Alliance | 1,203 | 21.6 | 2 | ||
| Anguilla United Movement | 1,088 | 19.5 | 1 | ||
| Anguilla Progressive Party | 370 | 6.6 | - | ||
| Independents | 731 | 13.1 | - | ||
| Appointed members | - | - | 4 | ||
| Total (turnout 74.6 %) | 5,569 | 100 | 11 | ||
| Source: The Anguillian | |||||
February 27: Kyrgyzstan
 |
| This article is part of a series on the politics and government of Kyrgyzstan |
| Constitution |
| Legislative |
|
Related topics |
| Parties | Seats |
|---|---|
| Results not available, elected members | 75 |
| Total (turnout %) | 75 |
February 27: Tajikistan
 |
| This article is part of a series on the politics and government of Tajikistan |
|
Government |
|
Legislature
|
| Foreign relations |
| Parties | Votes 1st round | % | Seats | |
|---|---|---|---|---|
| People's Democratic Party of Tajikistan (Hizbi Demokrati-Khalkii Tojikston) | 1,666,909 | 64.51 | 49 | |
| Communist Party of Tajikistan (Hizbi Kommunistīi Tojikston) | 533,066 | 20.63 | 4 | |
| Islamic Renaissance Party of Tajikistan (Nahzati Islomi Tojikiston) | 193,532 | 7.48 | 2 | |
| Others | Democratic Party (Hizbi Demokrati) | 190,412 | 7,36 | N/A |
| Justice Party (Hizb Adolatkhoh) | N/A | |||
| Socialist Party (Hizbi Sotsialistīi Tojikston) | N/A | |||
| Other parties | - | |||
| Non-partisans (pro-HDKT) | 5 | |||
| Total (turnout %) | 2,583,919 | 63 | ||
| Registered voters | 2,771,528 | |||
| Source: IFES, Angus Reid en Eurasia.org | ||||
March
March 6: Moldova
 |
| This article is part of a series on the politics and government of Moldova |
|
Judiciary |
|
Executive
|
| Administrative divisions |
|
Foreign policy |
| Parties and coalitions | % | Seats | +/- | |
|---|---|---|---|---|
| Party of Communists of the Republic of Moldova (Partidul Comuniştilor din Republica Moldova) | 45.98 | 56 | −15 | |
Electoral Bloc Democratic Moldova (Blocul Electoral Moldova Democrată)
|
28.53 | 22 | +22 | |
| 8 | +8 | |||
| 4 | +4 | |||
| Christian Democratic People's Party (Partidul Popular Creştin Democrat) | 9.07 | 11 | 0 | |
| Total (turnout 63.7%) | 101 | 0 | ||
March 13: Central African Republic
President
| Candidate | Party | First round | Second round | ||
|---|---|---|---|---|---|
| Votes | % | Votes | % | ||
| François Bozizé | Independent | 382,241 | 42.97 | 610,903 | 64.60 |
| Martin Ziguélé | Movement for the Liberation of the Central African People | 209,357 | 23.53 | 334,716 | 35.40 |
| André Kolingba | Central African Democratic Rally | 145,495 | 16.36 | ||
| Jean-Paul Ngoupandé | National Unity Party | 45,182 | 5.08 | ||
| Charles Massi | Democratic Forum for Modernity | 28,618 | 3.22 | ||
| Abel Goumba | Patriotic Front for Progress | 22,297 | 2.51 | ||
| Henri Pouzère | Independent | 18,647 | 2.10 | ||
| Josué Binoua | Independent | 13,559 | 1.52 | ||
| Jean-Jacques Démafouth | Independent | 11,279 | 1.27 | ||
| Auguste Boukanga | Union for Renewal and Democracy | 7,085 | 0.80 | ||
| Olivier Gabirault | Alliance for Democracy and Progress | 5,834 | 0.66 | ||
| Invalid/blank votes | 57,022 | – | 32,111 | – | |
| Total | 946,616 | 100 | 977,730 | 100 | |
| Registered voters/turnout | 1,302,930 | 72.7 | 1,452,211 | 67.3 | |
| Source: African Elections Database | |||||
National Assembly
| Alliance | Party | Votes | % | Seats | +/– |
|---|---|---|---|---|---|
| National Convergence "Kwa Na Kwa" | Party for Democracy in Central Africa | 8 | New | ||
| National Party for a New Central Africa | 7 | New | |||
| Liberal Democratic Party | 3 | +1 | |||
| Action Party for Development | 2 | New | |||
| National Union for Democracy and Rally | 2 | New | |||
| Movement for Democracy and Development | 2 | –6 | |||
| Movement for Unity, Peace and Security | 1 | New | |||
| National Democratic Front | 1 | New | |||
| Independents | 16 | New | |||
| Movement for the Liberation of the Central African People | 11 | –36 | |||
| Consultation of Opposition Political Parties | Social Democratic Party | 5 | –1 | ||
| National Unity Party | 3 | 0 | |||
| Movement for Democracy, Independence and Social Progress | 3 | New | |||
| Central African Democratic Rally | 7 | –13 | |||
| Patriotic Front for Progress | 2 | –5 | |||
| Alliance for Democracy and Progress | 2 | –3 | |||
| Democratic Forum for Modernity | 1 | –1 | |||
| Löndö Association | 1 | New | |||
| Social Democratic Party–Congress of Central African Social Democrats | 1 | New | |||
| African Party for a Radical Transformation and Integration of the State | 0 | – | |||
| Alliance for Solidarity and Progress | 0 | – | |||
| Central African Democratic Decision for Development | 0 | – | |||
| Central African Greens Movement | 0 | – | |||
| Central African Party for Development | 0 | – | |||
| Central African People's National Democratic Union | 0 | – | |||
| Central African Republican Party | 0 | 0 | |||
| Central African Socialist Movement | 0 | – | |||
| Civic Forum | 0 | –1 | |||
| Congress of Democrats for Central African Renewal | 0 | – | |||
| Democratic Movement for the Renaissance and Evolution of Central Africa | 0 | 0 | |||
| Democratic Republicans' Union | 0 | – | |||
| Liberal Effort in Black Africa | 0 | – | |||
| Liberal Republican Party | 0 | – | |||
| Movement for Democracy and Social Evolution | 0 | – | |||
| Movement for the Social Evolution of Black Africa | 0 | 0 | |||
| Movement for the Social Evolution of Black Africa–Boganda | 0 | 0 | |||
| Movement for Unity and Democracy | 0 | – | |||
| National Convention | 0 | 0 | |||
| National Movement for Renewal | 0 | – | |||
| National Union for the Defence of Democracy | 0 | – | |||
| National Movement for Development | 0 | – | |||
| New Perspectives Central Africa | 0 | – | |||
| Patriotic Movement for Renewal | 0 | – | |||
| People's Union for Social and Economic Development | 0 | – | |||
| Republican Progress Party | 0 | – | |||
| Union for a Popular Central African Movement | 0 | – | |||
| Union for Progress in Central Africa | 0 | – | |||
| Union for Renewal and Democracy | 0 | – | |||
| Union for the Republic | 0 | – | |||
| Union of Democrats for Panafrican Renewal | 0 | – | |||
| Independents | 27 | New | |||
| Total | 105 | –4 | |||
| Source: EISA, EISA | |||||
March 13: Micronesia
 |
| This article is part of a series on the politics and government of the Federated States of Micronesia |
|
| Members | Seats |
|---|---|
| Non-partisans | 14 |
| Total (turnout %) | 14 |
March 13: Liechtenstein
 |
| This article is part of a series on the politics and government of Liechtenstein |
| Parties | Votes | % | Seats | |
|---|---|---|---|---|
| Progressive Citizens' Party (Fortschrittliche Bürgerpartei) | 94,547 | 48.7 | 12 | |
| Patriotic Union (Vaterländische Union) | 74,162 | 38.2 | 10 | |
| Free List (Freie Liste) | 25,286 | 13.0 | 3 | |
| Total votes (turnout 86.5%) | 193,995 | 25 | ||
| Source: landtagswahlen.li | ||||
March 17: Tonga
 |
| This article is part of a series on the politics and government of Tonga |
| Parties | Votes | % | Seats |
|---|---|---|---|
| Human Rights and Democracy Movement | 30,501 | 38.9 | 7 |
| Other candidates | 47,816 | 61.1 | 2 |
| members elected by and among the 33 hereditary nobles of Tonga | 9 | ||
| members of the Privy Council (appointed by the King) | 10 | ||
| Governors (appointed by the King) | 2 | ||
| Total | 78,317 | 30 | |
| Source: http://psephos.adam-carr.net/countries/t/tonga/tonga2005.txt | |||
March 31: Zimbabwe
 |
| This article is part of a series on the politics and government of Zimbabwe |
|
Legislature |
|
Judiciary |
|
National symbols |
| Parties | Votes | % | Seats |
|---|---|---|---|
| Zimbabwe African National Union-Patriotic Front | 1,569,867 | 59.6 | 78 |
| Movement for Democratic Change | 1,041,292 | 39.5 | 41 |
| Independents | 16,223 | 0.6 | 1 |
| Zimbabwe African National Union-Ndonga | 6,608 | 0.3 | 0 |
| Zimbabwe Youth in Alliance | 594 | 0.0 | 0 |
| Zimbabwe People's Democratic Party | 61 | 0.0 | 0 |
| Presidential appointees | 20 | ||
| Ex-officio members (Chiefs) | 10 | ||
| Total (turnout 47.7%) | 2,634,645 | 100.0 | 150 |
| Registered voters | 5,658,624 | ||
| Total votes cast | 2,696,670 | ||
| Invalid votes | 62,025 | ||
| |||
April
April 8: Djibouti
 |
| This article is part of a series on the politics and government of Djibouti |
| Constitution |
|
Legislature
|
| Candidates - Nominating parties | Votes | % | ||
|---|---|---|---|---|
| Ismail Omar Guelleh - People's Rally for Progress | 144,433 | 100.00 | ||
| Total valid votes (turnout 71.7%) | 144,433 | 100.00 | ||
| Invalid votes | 4,692 | |||
| Total votes | 149,125 | |||
| Registered voters | 208,098 | |||
| Source: African Elections Database | ||||
April 17: Northern Cyprus
|
| This article is part of a series on the politics and government of Northern Cyprus |
| Candidate | Party | Votes | % |
|---|---|---|---|
| Mehmet Ali Talat | Republican Turkish Party | 55,943 | 55.60 |
| Derviş Eroğlu | National Unity Party (UBP) | 22,869 | 22.73 |
| Mustafa Arabacıoğlu | Democrat Party (DP) | 13,302 | 13.22 |
| Nuri Çevikel | New Party (YP) | 4816 | 4.79 |
| Zeki Beşiktepeli | Independent | 1728 | 1.72 |
| Hüseyin Angolemli | Communal Liberation Party (TKP) | 1054 | 1.05 |
| Zehra Cengiz | Cyprus Socialist Party | 439 | 0.44 |
| Arif Salih Kırdağ | Independent | 306 | 0.30 |
| Ayhan Kaymak | Independent | 168 | 0.17 |
| Total (turnout 69.58%) | 100,186 | 100 | |
| Source: Adam Carr | |||
April 24: Andorra
 |
| This article is part of a series on the politics and government of Andorra |
| Constitution |
|
Executive
|
|
Legislature |
|
| Foreign relations |
| Party | Constituency | PR | Total Seats |
+/- | |||||
|---|---|---|---|---|---|---|---|---|---|
| Votes | % | Seats | Votes | % | Seats | ||||
| Liberal Party of Andorra | 5,473 | 46.2 | 8 | 5,100 | 40.0 | 6 | 14 | -1 | |
| Social Democratic Party | – | – | 0 | 4,711 | 36.9 | 6 | 12 | – | |
| Democratic Renewal | – | – | 0 | 772 | 6.0 | 0 | 0 | New | |
| Andorran Democratic Centre+Century 21 | 1,127 | 9.5 | 0 | 1,360 | 10.7 | 2 | 2 | New | |
| Greens of Andorra | – | – | 0 | 433 | 3.4 | 0 | 0 | New | |
| Social Democratic Party-Democratic Renewal coalition | 5,235 | 44.2 | 6 | – | – | 0 | 6 | – | |
| Invalid/blank votes | 1,045 | – | – | 503 | – | – | – | – | |
| Total | 12,880 | 100 | 14 | 12,879 | 100 | 14 | 28 | 0 | |
| Source: Nohlen & Stöver, IPU | |||||||||
April 24: Togo
 |
| This article is part of a series on the politics and government of Togo |
|
Constitution |
|
Parliament |
| Foreign relations |
| Candidates - nominating parties | Votes | % |
|---|---|---|
| Faure Gnassingbé - Rally for the Togolese People (Rassemblement du Peuple Togolais) | 60.15 | |
| Emmanuel Bob-Akitani - Union of Forces for Change (Union des Forces du Changement), supported by Alliance of Democrats for Integral Development (Alliance des Démocrates pour le Développement Intégral), Action Committee for Renewal (Comité d'Action pour la Renouveau), Democratic Convention of African Peoples (Convention Démocratique des Peoples Africains) and Socialist Pact for Renewal (Pacte Socialiste pour le Renouveau) | 38.25 | |
| Nicolas Lawson - Party for Renewal and Redemption (Parti pour le Renouveau et la Rédemption) | 1.04 | |
| Harry Olympio - Rally for the Support of Democracy and Development (Rassemblement pour le soutien de la démocratie et du développement) | 0.55 | |
| Total (turnout 63.6 %) | 2,200,274 | |
| Registered voters | 3,599,306 | |
| Total votes | 2,288,279 | |
| Invalid or blank votes | 88,005 |
April 30: Niue
 |
| This article is part of a series on the politics and government of Niue |
| Members | Seats |
|---|---|
| Non-partisan members elected on a common roll | 6 |
| Representatives of the villages | 14 |
| Total (turnout %) | 20 |
May
May 5: United Kingdom
.svg.png) |
| This article is part of a series on the politics and government of the United Kingdom |
|
|
|
|
| Political party |
Leader |
Candidates |
Elected |
Seats gained |
Seats lost |
Net change in seats |
% of seats |
Number of votes |
% of votes |
Change in % of vote |
Votes per seat won | |
|---|---|---|---|---|---|---|---|---|---|---|---|---|
| Labour | Tony Blair | 627 | 355 | 0 | 47 | –47 | 55.2 | 9,552,436 | 35.2 | –5.5 | 26,908 | |
| Conservative | Michael Howard | 630 | 198 | 36 | 3 | +33 | 30.7 | 8,784,915 | 32.4 | +0.7 | 44,368 | |
| Liberal Democrat | Charles Kennedy | 626 | 62 | 16 | 5 | +11 | 9.6 | 5,985,454 | 22.0 | +3.8 | 96,540 | |
| UKIP | Roger Knapman | 496 | 0 | 0 | 0 | 0 | 0.0 | 605,973 | 2.2 | +0.8 | N/A | |
| SNP | Alex Salmond | 59 | 6 | 2 | 0 | +2 | 0.9 | 412,267 | 1.5 | –0.2 | 68,711 | |
| Green | Caroline Lucas and Keith Taylor | 182 | 0 | 0 | 0 | 0 | 0.0 | 257,758 | 1.0 | +0.4 | N/A | |
| DUP | Ian Paisley | 18 | 9 | 4 | 0 | +4 | 1.4 | 241,856 | 0.9 | +0.2 | 26,873 | |
| BNP | Nick Griffin | 119 | 0 | 0 | 0 | 0 | 0.0 | 192,745 | 0.7 | +0.5 | N/A | |
| Plaid Cymru | Dafydd Iwan | 40 | 3 | 0 | 1 | –1 | 0.5 | 174,838 | 0.6 | –0.1 | 58,279 | |
| Sinn Féin | Gerry Adams | 18 | 5 | 1 | 0 | +1 | 0.8 | 174,530 | 0.6 | –0.1 | 34,906 | |
| UUP | David Trimble | 18 | 1 | 0 | 5 | –5 | 0.2 | 127,414 | 0.5 | –0.3 | 127,414 | |
| SDLP | Mark Durkan | 18 | 3 | 1 | 1 | 0 | 0.5 | 125,626 | 0.5 | –0.1 | 41,875 | |
| Independent | N/A | 180 | 1 | 1 | 0 | +1 | 0.2 | 122,416 | 0.5 | +0.1 | 122,416 | |
| Respect | Linda Smith | 26 | 1 | 1 | 0 | +1 | 0.2 | 68,094 | 0.3 | N/A | 68,094 | |
| Scottish Socialist | Colin Fox | 58 | 0 | 0 | 0 | 0 | 0.0 | 43,514 | 0.2 | –0.1 | N/A | |
| Veritas | Robert Kilroy-Silk | 65 | 0 | 0 | 0 | 0 | 0.0 | 40,607 | 0.1 | N/A | N/A | |
| Alliance | David Ford | 12 | 0 | 0 | 0 | 0 | 0.0 | 28,291 | 0.1 | 0.0 | N/A | |
| Scottish Green | Shiona Baird and Robin Harper | 19 | 0 | 0 | 0 | 0 | 0.0 | 25,760 | 0.1 | +0.1 | N/A | |
| Socialist Labour | Arthur Scargill | 49 | 0 | 0 | 0 | 0 | 0.0 | 20,167 | 0.1 | 0.0 | N/A | |
| Liberal | Michael Meadowcroft | 14 | 0 | 0 | 0 | 0 | 0.0 | 19,068 | 0.1 | 0.0 | N/A | |
| Health Concern | Richard Taylor | 1 | 1 | 0 | 0 | 0 | 0.2 | 18,739 | 0.1 | 0.0 | 18,739 | |
| Speaker | N/A | 1 | 1 | 0 | 0 | 0 | 0.2 | 15,153 | 0.1 | 0.0 | 15,153 | |
| English Democrat | Robin Tilbrook | 24 | 0 | 0 | 0 | 0 | 0.0 | 15,149 | 0.1 | N/A | N/A | |
| Socialist Alternative | Peter Taaffe | 17 | 0 | 0 | 0 | 0 | 0.0 | 9,398 | 0.0 | N/A | N/A | |
| National Front | Tom Holmes | 13 | 0 | 0 | 0 | 0 | 0.0 | 8,079 | 0.0 | N/A | N/A | |
| Legalise Cannabis | Alun Buffry | 21 | 0 | 0 | 0 | 0 | 0.0 | 6,950 | 0.0 | 0.0 | N/A | |
| Monster Raving Loony | Howling Laud Hope | 19 | 0 | 0 | 0 | 0 | 0.0 | 6,311 | 0.0 | 0.0 | N/A | |
| Community Action | Peter Franzen | 3 | 0 | 0 | 0 | 0 | 0.0 | 5,984 | 0.0 | N/A | N/A | |
| Christian Vote | George Hargreaves | 10 | 0 | 0 | 0 | 0 | 0.0 | 4,004 | 0.0 | N/A | N/A | |
| Mebyon Kernow | Dick Cole | 4 | 0 | 0 | 0 | 0 | 0.0 | 3,552 | 0.0 | 0.0 | N/A | |
| Forward Wales | John Marek | 6 | 0 | 0 | 0 | 0 | 0.0 | 3,461 | 0.0 | N/A | N/A | |
| Christian Peoples | Alan Craig | 9 | 0 | 0 | 0 | 0 | 0.0 | 3,291 | 0.0 | N/A | N/A | |
| Rainbow Dream Ticket | Rainbow George Weiss | 23 | 0 | 0 | 0 | 0 | 0.0 | 2,463 | 0.0 | N/A | N/A | |
| Community Group | Martin Williams | 1 | 0 | 0 | 0 | 0 | 0.0 | 2,365 | 0.0 | N/A | N/A | |
| Ashfield Independents | Roy Adkins | 1 | 0 | 0 | 0 | 0 | 0.0 | 2,292 | 0.0 | N/A | N/A | |
| Alliance for Green Socialism | Mike Davies | 5 | 0 | 0 | 0 | 0 | 0.0 | 1,978 | 0.0 | N/A | N/A | |
| Residents | Malvin Brown | 2 | 0 | 0 | 0 | 0 | 0.0 | 1,850 | 0.0 | N/A | N/A | |
| Workers' Party | Seán Garland | 6 | 0 | 0 | 0 | 0 | 0.0 | 1,669 | 0.0 | 0.0 | N/A | |
| Socialist Environmental | Goretti Horgan | 1 | 0 | 0 | 0 | 0 | 0.0 | 1,649 | 0.0 | N/A | N/A | |
| Scottish Unionist | Daniel Houston | 1 | 0 | 0 | 0 | 0 | 0.0 | 1,266 | 0.0 | 0.0 | N/A | |
| Workers Revolutionary | Sheila Torrance | 10 | 0 | 0 | 0 | 0 | 0.0 | 1,241 | 0.0 | 0.0 | N/A | |
| New England | Michael Tibby | 1 | 0 | 0 | 0 | 0 | 0.0 | 1,224 | 0.0 | N/A | N/A | |
| Communist | Robert Griffiths | 6 | 0 | 0 | 0 | 0 | 0.0 | 1,124 | 0.0 | 0.0 | N/A | |
| Community Group | 1 | 0 | 0 | 0 | 0 | 0.0 | 1,118 | 0.0 | N/A | N/A | ||
| Peace and Progress | Chris Cooper | 3 | 0 | 0 | 0 | 0 | 0.0 | 1,036 | 0.0 | N/A | N/A | |
| Scottish Senior Citizens | John Swinburne | 2 | 0 | 0 | 0 | 0 | 0.0 | 1,017 | 0.0 | N/A | N/A | |
| Your Party | Daniel Thompson | 2 | 0 | 0 | 0 | 0 | 0.0 | 1,006 | 0.0 | N/A | N/A | |
| SOS! Northampton | Yvonne Dale | 2 | 0 | 0 | 0 | 0 | 0.0 | 932 | 0.0 | N/A | N/A | |
| Independent Working Class | None | 1 | 0 | 0 | 0 | 0 | 0.0 | 892 | 0.0 | N/A | N/A | |
| Democratic Labour | Brian Powell | 1 | 0 | 0 | 0 | 0 | 0.0 | 770 | 0.0 | N/A | N/A | |
| British Public Party | Kashif Rana | 1 | 0 | 0 | 0 | 0 | 0.0 | 763 | 0.0 | N/A | N/A | |
| Free Scotland | Brian Nugent | 3 | 0 | 0 | 0 | 0 | 0.0 | 743 | 0.0 | N/A | N/A | |
| Pensioners Party Scotland | George Rodger | 1 | 0 | 0 | 0 | 0 | 0.0 | 716 | 0.0 | N/A | N/A | |
| Publican Party | Kit Fraser and Don Lawson | 1 | 0 | 0 | 0 | 0 | 0.0 | 678 | 0.0 | N/A | N/A | |
| English Independence Party | Andrew Constantine | 1 | 0 | 0 | 0 | 0 | 0.0 | 654 | 0.0 | N/A | N/A | |
| Socialist Unity | None | 2 | 0 | 0 | 0 | 0 | 0.0 | 581 | 0.0 | N/A | N/A | |
| Local Community Party | Jack Crossfield | 1 | 0 | 0 | 0 | 0 | 0.0 | 570 | 0.0 | N/A | N/A | |
| Clause 28 | David Braid | 3 | 0 | 0 | 0 | 0 | 0.0 | 516 | 0.0 | N/A | N/A | |
| UK Community Issues Party | Michael Osman | 3 | 0 | 0 | 0 | 0 | 0.0 | 502 | 0.0 | N/A | N/A | |
| Total | 646 | Turnout | 27,148,510 | 61.4 | 42,026 | |||||||
May 5: Dominica
 |
| This article is part of a series on the politics and government of Dominica |
|
Executive |
| Administrative divisions (parishes) |
| Foreign relations |
| Parties | Votes | % | Seats | ||
|---|---|---|---|---|---|
| Dominica Labour Party | 19,741 | 52.1 | 12 | ||
| United Workers' Party | 16,529 | 43.6 | 8 | ||
| Dominica Freedom Party | 1,194 | 3.2 | - | ||
| Others | 449 | 1.1 | 1 | ||
| Total (turnout 57.5%) | 37,913 | 100.0 | 21 | ||
| Source: Dominica: legislative election of 5 May 2005 | |||||
May 11: Cayman Islands
 |
| This article is part of a series on the politics and government of the Cayman Islands |
| Parties | Seats |
|---|---|
| People's Progressive Movement | 9 |
| United Democratic Party | 5 |
| West Bay Alliance | - |
| People's Democratic Alliance | - |
| Independents | 1 |
| Total (turnout 80.25%) | 15 |
| Source: Elections Office | |
May 14: Republic of China/Taiwan
| Parties | Votes | Percentage (%) | Seats | |
|---|---|---|---|---|
| Parties in favor of the amendments | 249 | |||
| 1,647,791 | 42.52 |  |
127 | |
| 1,508,384 | 38.92 |  |
117 | |
| ___ Chinese People's Party | 41,940 | 1.08 |  |
3 |
| ___ Peasant Party | 15,516 | 0.40 |  |
1 |
| ___ Civil Party | 8,609 | 0.22 |  |
1 |
| Parties not in favor of the amendments | 51 | |||
| 273,147 | 7.05 |  |
21 | |
| 236,716 | 6.11 |  |
18 | |
| ___ 150 persons union led by Jhang Ya Jhong | 65,081 | 1.68 |  |
5 |
| 34,253 | 0.88 |  |
3 | |
| 25,162 | 0.65 |  |
2 | |
| 11,500 | 0.30 |  |
1 | |
| ___ 20 persons union led by Wang Ting Sing | 7,499 | 0.19 |  |
1 |
| Total (turnout ) | 300 | |||
| This article is part of a series on the |
| Politics of the Republic of China |
|---|
 |
| Commonly known as Taiwan |
|
Leadership |
|
|
|
Other branches 
|
|
Related topics |
|
Taiwan portal |
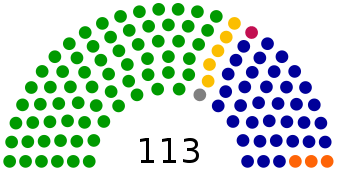
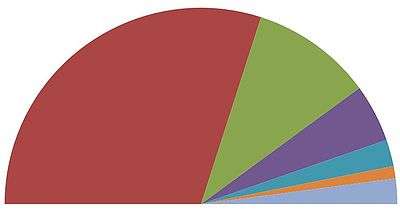
May 15: Ethiopia
 |
| This article is part of a series on the politics and government of Ethiopia |
|
|
Judiciary
|
| Coalitions and parties | Votes | % | Seats |
|---|---|---|---|
| Ethiopian People's Revolutionary Democratic Front | 59.8% | 327 | |
| Coalition for Unity and Democracy | 19.9% | 109 | |
| United Ethiopian Democratic Forces | 9.5% | 52 | |
| Somali People's Democratic Party | 4.3% | 24 | |
| Oromo Federalist Democratic Movement | 2.0% | 11 | |
| Benishangul-Gumuz People's Democratic Unity Front | 1.4% | 8 | |
| Afar National Democratic Party | 1.4% | 8 | |
| Gambela People's Democratic Movement | negligible | 3 | |
| Sheko and Mezenger People's Democratic Unity Organization | negligible | 1 | |
| Hareri National League | negligible | 1 | |
| Argoba Nationality Democratic Organization | negligible | 1 | |
| Independent | negligible | 1 | |
| Total | 100% | 546 |
Ethiopian 2005 general election results. Only parties with more than 10 seats shown.
Red: EPRDF
Green: CUD
Purple: UEDF
Dark blue: SPDP
Orange: OFDM
Light blue: Others
Red: EPRDF
Green: CUD
Purple: UEDF
Dark blue: SPDP
Orange: OFDM
Light blue: Others
May 20: Mongolia
 |
| This article is part of a series on the politics and government of Mongolia |
|
Legislature |
|
Judiciary |
| Candidates – Nominating party | Votes | % |
|---|---|---|
| Nambaryn Enkhbayar – Mongolian People's Revolutionary Party | 495,730 | 54.2% |
| Mendsaikhany Enkhsaikhan – Democratic Party | 184,743 | 20.2% |
| Bazarsad Jargalsaikhan – Republican Party | 129,147 | 14.1% |
| Badarchiin Erdenebat – Motherland Party | 105,171 | 11.5% |
| Total (turnout 74.9%) | 914,791 | 100.00% |
| Source: General Election Commission of Mongolia | ||
May 25: Suriname
 |
| This article is part of a series on the politics and government of Suriname |
| Constitution |
|
Government |
|
Legislature |
|
| Alliances and parties | Votes | % | Seats |
|---|---|---|---|
New Front for Democracy and Development (Nieuwe Front voor Democratie en Ontwikkeling):
|
41.2 | 23 | |
| National Democratic Party (Nationale Democratische Partij) | 23.1 | 15 | |
People's Alliance for Progress (Volksalliantie Voor Vooruitgang)
|
14.5 | 5 | |
A-Com
|
7.3 | 5 | |
A1
|
6.2 | 3 | |
| Union of Progressive Surinamese (Unie van Progressieve Surinamers) | 4.9 | - | |
| Party for Democracy and Development through Unity (Partij voor Democratie en Ontwikkeling door Eenheid) | |||
| Progressive Workers' and Farmers' Union (Progressieve Arbeiders- en Landbouwersunie) | PALU | 1.0 | - |
| Total (turnout 65.1 %) | 51 |
May 30: Lebanon
 |
| This article is part of a series on the politics and government of Lebanon |
|
| Alliances | Seats | Parties | Votes | % | Seats |
|---|---|---|---|---|---|
| March 14 Alliance | 69 | Future Movement (Tayyar Al Mustaqbal) | 36 | ||
| Progressive Socialist Party (Hizb al-Taqadummi al-Ishtiraki) | 16 | ||||
| Lebanese Forces (al-Quwāt al-Lubnāniyya) | 6 | ||||
Qornet Shehwan Gathering
|
6 | ||||
| Independents (Tripoli Bloc) | 3 | ||||
| Democratic Renewal (Tripoli Bloc) | 1 | ||||
| Democratic Left (Tripoli Bloc) | 1 | ||||
| March 8 Alliance | 57 | Hope Movement (Harakat Amal) | 14 | ||
| Hezbollah | 14 | ||||
| Syrian Social Nationalist Party (al-Hizb al-Qawmi al-souri al ijtima'i) | 2 | ||||
| Others | 5 | ||||
| Free Patriotic Movement (Tayyar Al-Watani Al-Horr) | 15 | ||||
| Skaff Bloc | 5 | ||||
| Murr Bloc | 2 | ||||
| Independents | 2 | Independents | 2 | ||
| Total | 128 | ||||
June
June 19: Guinea-Bissau
 |
| This article is part of a series on the politics and government of Guinea-Bissau |
|
|
Legislature |
|
Judiciary
|
| Candidates - Nominating parties | Votes 1st round |
% 1st round |
Votes 2nd round |
% 2nd round |
|---|---|---|---|---|
| Malam Bacai Sanhá - African Independence Party of Guinea and Cape Verde | 158,276 | 35.45% | 196,759 | 47.65% |
| João Bernardo "Nino" Vieira - Independent | 128,918 | 28.87% | 216,167 | 52.35% |
| Mohamed Ialá Embaló - Party for Social Renewal | 111,606 | 25.00% | - | - |
| Francisco Fadul - United Social Democratic Party | 12,733 | 2.85% | - | - |
| Aregado Mantenque Té - Workers' Party | 9,000 | 2.02% | - | - |
| Mamadú Iaia Djaló - Independent | 7,112 | 1.59% | - | - |
| Mário Lopes da Rosa - Independent | 4,863 | 1.09% | - | - |
| Idrissa Djaló - National Unity Party | 3,604 | 0.81% | - | - |
| Adelino Mano Queta - Independent | 2,816 | 0.63% | - | - |
| Faustino Fadut Imbali - Manifest Party of the People | 2,330 | 0.52% | - | - |
| Paulino Empossa Ié - Independent | 2,215 | 0.50% | - | - |
| Antonieta Rosa Gomes - Guinean Civic Forum-Social Democracy | 1,642 | 0.37% | - | - |
| João Tátis Sá - Guinean People's Party | 1,378 | 0.31% | - | - |
| Total (turnout 87.6% / 78.6%) | 446,493 | 412,926 |
June 19: Nagorno Karabakh
 |
| This article is part of a series on the politics and government of Nagorno-Karabakh |
| See also |
| Parties | Votes PR Lists |
% | Seats | ||
|---|---|---|---|---|---|
| Democratic Party of Artsakh (Artsakhi Demokratakan Kusaktsutyun) | 22,393 | 37.6% | 12 | ||
| Free Motherland (Azat Hayrenik) | 15,931 | 26.7% | 10 | ||
ARF/Movement 88
|
14,534 | 24.4% | 3 | ||
| Communist Party of Artsakh (Artsakhi Komunistakan Kusaktsutyun) | 2,432 | 4.0% | - | ||
| Moral Revival (Baroyakan Veratsnund) | 2,192 | 3.6% | - | ||
| Armenia Our Home (Mer Tun' Hayastan) | 1,265 | 2.1% | - | ||
| Social Justice Party | 788 | 1.2% | - | ||
| Non-partisans | 8 | ||||
| Total (Turnout 78%) | 66776 | 100.0 | 33 | ||
| Source: Ruling Party Wins Karabakh Vote Amid Opposition Outcry | |||||
June 17: Iran
| This article is part of a series on the |
| Politics of the Islamic Republic of Iran |
|---|
 |
| Government of Islamic Republic of Iran |
|
Supreme Councils |
|
Local governments |
|
|
|
| Candidates | Votes 1st round | % | Votes 2nd round | % |
|---|---|---|---|---|
| Mahmoud Ahmadinejad | 5,711,696 | 19.43 | 17,284,782 | 61.69 |
| Akbar Hashemi Rafsanjani | 6,211,937 | 21.13 | 10,046,701 | 35.93 |
| Mehdi Karroubi | 5,070,114 | 17.24 | - | - |
| Mohammad Bagher Ghalibaf | 4,095,827 | 13.93 | - | - |
| Mostafa Moeen | 4,083,951 | 13.89 | - | - |
| Ali Larijani | 1,713,810 | 5.83 | - | - |
| Mohsen Mehralizadeh | 1,288,640 | 4.38 | - | - |
| Blank or invalid votes | 1,224,882 | 4.17 | 663,770 | 2.37 |
| Total (turnout 62.66% and 59.6%) | 29,400,857 | 100 | 27,959,253 | 100 |
June 25: Bulgaria
 |
| This article is part of a series on the politics and government of Bulgaria |
|
Presidency |
|
| Party | Votes | % | Seats | +/− | |
|---|---|---|---|---|---|
| Coalition for Bulgaria | 1,129,196 | 31.0 | 82 | +34 | |
| National Movement Simeon II | 725,314 | 19.9 | 53 | −67 | |
| Movement for Rights and Freedoms | 467,400 | 12.8 | 34 | +13 | |
| National Union Attack | 296,848 | 8.1 | 21 | +21 | |
| United Democratic Forces | 280,323 | 7.7 | 20 | −31 | |
| Democrats for a Strong Bulgaria | 234,788 | 6.4 | 17 | +17 | |
| People's Union | 189,268 | 5.2 | 13 | +13 | |
| Others | 324,050 | 8.8 | 0 | - | |
| Total valid votes | 3,648,177 | 100.0 | 240 | - | |
| Invalid votes | 99,616 | ||||
| Votes cast (turnout: 55.8%) | 3,747,793 | ||||
| Registered voters in the main list | 6,720,941 | ||||
| Source: Electoral Commission of Bulgaria and Adam Carr's Electoral Archive | |||||
June: Tokelau
| This article is part of a series on the politics and government of Tokelau |
|
| Members | Seats |
|---|---|
| Non-partisans | 15 |
| Total | 15 |
July
July 3: Albania
 |
| This article is part of a series on the politics and government of Albania |
|
|
| Parties | Votes PR | % | Seats | ||
|---|---|---|---|---|---|
| Constituencies | PR | Total | |||
| Democratic Party of Albania (Partia Demokratike e Shqipërisë) | 104,796 | 7.67 | 56 | 0 | 56 |
| Socialist Party of Albania (Partia Socialiste e Shqipërisë) | 121,412 | 8.89 | 42 | 0 | 42 |
| ALDM-National Front (Partia Balli Kombëtar Shqiptar) | 457,143 | 33,46 | 0 | 18 | 18 |
| ALDM-Republican Party of Albania (Partia Republikane e Shqipërisë) | - | 11 | 11 | ||
| ALDM-New Democratic Party (Partia Demokrate e Re) | - | 4 | 4 | ||
| ALDM-Christian Democratic Party of Albania (Partia Demokristiane e Shqipërisë) | - | 2 | 2 | ||
| ALDM-Liberal Democratic Union (Bashkimi Liberal Demokrat) | - | 1 | 1 | ||
| ALDM-Democratic National Front Party (Partia Ballik Kombëtar Demokrat) | - | - | - | ||
| ALDM-Albanian Democratic Union Party (Partia e Bashkimit Demokrat Shqiptar) | - | - | - | ||
| ALDM-Human Rights Liberation Movement (Lëvizja për të Drejtat dhe Liritë e Njeriut) | - | - | - | ||
| Social Democratic Party of Albania (Partia Socialdemokrate e Shqipërisë) | 174,103 | 12.74 | 0 | 7 | 7 |
| Socialist Movement for Integration (Lëvizja Socialiste për Intigrim) | 114,798 | 8.40 | 1 | 4 | 5 |
| Environmentalist Agrarian Party (Partia Agrare Ambientaliste) | 89,635 | 6.56 | - | 4 | 4 |
| Democratic Alliance Party (Partia Aleanca Demokratike) | 65,093 | 4.76 | - | 3 | 3 |
| Social Democracy Party of Albania (Partia Demokracia Sociale e Shqipërisë) | 57,998 | 4.25 | - | 2 | 2 |
| Unity for Human Rights Party (Partia Bashkimi për të Drejtat e Njeriut) | 56,403 | 4.13 | - | 2 | 2 |
| Non-partisans | 1 | 1 | |||
| Total | 1,366,226 | 100.0 | 100 | 40 | 140 |
| Source: OSCE The candidates of the Alliance for Freedom, Justice and Welfare (Aliansa për Liri, Drejtësi dhe Mirëqenie;;, Republican Party of Albania and allies) supported the candidates of the PDS in the constituencies, as did some of the informal PS allie with the PS candidates. Given the number of irregularities in the first ballot, re-elections were held in two constituencies in Shkodra and Lushnja on 21 August. These results have been included. | |||||
July 3: Mauritius
.svg.png) |
| This article is part of a series on the politics and government of Mauritius |
| Constitution |
|
Presidency |
|
| Parties and alliances | Votes | % | Seats | Additional seats | total seats |
|---|---|---|---|---|---|
Alliance Sociale:
|
948,766 | 48.8 | 38 | 4 | 42 |
| Alliance MSM-MMM | 829,460 | 42.6 | 22 | 2 | 24 |
| Organisation du Peuple Rodriguais (OPR) | 10,184 | 0.8 | 2 | 2 | 4 |
| All others | 156,538 | 8.0 | |||
| Total (Turnout 81.5 %) | 1,944,948 | 100.0 | 62 | 8 | 70 |
| Source: Adam Carr | |||||
July 4: Burundi
| Party | Votes | % | Seats | |||
|---|---|---|---|---|---|---|
| Elected | Co-opted | Total | ||||
| CNDD–FDD | 1,417,800 | 58.55 | 59 | 5 | 64 | |
| Front for Democracy in Burundi | 525,336 | 21.70 | 25 | 5 | 30 | |
| Union for National Progress | 174,575 | 7.21 | 10 | 5 | 15 | |
| National Council for the Defense of Democracy | 100,366 | 4.14 | 4 | 0 | 4 | |
| Movement for the Rehabilitation of Citizens – Rurenzangemero | 51,730 | 2.14 | 2 | 0 | 2 | |
| Party for National Recovery | 42,223 | 1.74 | 0 | 0 | 0 | |
| Other parties and independents | 109,396 | 4.51 | 0 | 0 | 0 | |
| Reserved seats for Twas | – | – | – | 3 | 3 | |
| Invalid/blank votes | 24,575 | – | – | – | – | |
| Total | 2,446,001 | 100 | 100 | 18 | 118 | |
| Registered voters/turnout | 3,167,124 | 77.23 | – | – | – | |
| Source: African Elections Database | ||||||
July 10: Hong Kong
 |
|
Politics and government of Hong Kong |
|
Legislature |
| Foreign relations |
|---|
|
Related topics
|
Template:Hong Kong Chief Executive election, 2005
July 10: Kyrgyzstan
|
| This article is part of a series on the politics and government of Kyrgyzstan |
| Constitution |
| Legislative |
|
Related topics |
| Candidates | Votes | % |
|---|---|---|
| Kurmanbek Bakiyev | 1,312,174 | 88.9 |
| Tursunbai Bakir Uulu | 56,065 | 3.8 |
| Akbaraly Aitikeev | 52,671 | 3.6 |
| Zhapar Dzheksheyev | 13,821 | 0.9 |
| Toktayym Ümötalieva | 8,111 | 0.6 |
| Keneshbek Dushebaev | 7,424 | 0.5 |
| Against all candidates | 12,771 | 0.9 |
| Total (turnout %) | 100.0 |
July 29: Burundi
| Party | Votes | % | Seats | |||
|---|---|---|---|---|---|---|
| Elected | Co-opted | Total | ||||
| CNDD–FDD | 30 | 2 | 32 | |||
| Front for Democracy in Burundi | 3 | 2 | 5 | |||
| National Council for the Defense of Democracy | 1 | 2 | 3 | |||
| Union for National Progress | 0 | 2 | 2 | |||
| Reserved seats for Twas | – | – | – | 3 | 3 | |
| Former presidents | – | – | – | 4 | 4 | |
| Invalid/blank votes | 1,064 | – | – | – | – | |
| Total | 2,161 | 100 | 100 | 18 | 118 | |
| Registered voters/turnout | 3,225 | 67.01 | – | – | – | |
| Source: African Elections Database, IPU | ||||||
August
August 27: Singapore
.svg.png) |
| This article is part of a series on the politics and government of Singapore |
| Constitution |
| Foreign relations |
|
Related topics |
| Candidate | Votes |
|---|---|
| S. R. Nathan | Without ballot |
August 30: Saint Helena
 |
| This article is part of a series on the politics and government of Saint Helena, Ascension and Tristan da Cunha |
|
| Candidates | Seats |
|---|---|
| Non-partisans | 12 |
| Ex officio members | 3 |
| Total (turnout %) | 15 |
September
September 7: Egypt
.svg.png) |
| This article is part of a series on the politics and government of Egypt |
| Constitution (history) |
|
Government |
|
Legislature |
| Political parties (former) |
| Candidates, Nominating parties | Votes | % |
|---|---|---|
| Hosni Mubarak, National Democratic Party (Al-Hizb Al-Watani Al-Dimuqrati) | 6,316,714 | 88.6 |
| Ayman Nour, Tomorrow Party (Hizb al-Ghad) | 540,405 | 7.3 |
| Numan Gomaa, New Wafd Party (Hizb al-Wafd al-Jadid) | 201,891 | 2.8 |
| Total (Turnout 22.9 %) | 7,059,010 |
September 11: Japan
 |
| This article is part of a series on the politics and government of Japan |
|
Related topics |
|
|
| Alliances and parties | Local constituency vote | PR block vote | Total seats | +/− | ||||||
|---|---|---|---|---|---|---|---|---|---|---|
| Votes[3] | % | Seats | Votes | % | Seats | (last election) | (pre- election) | |||
| Liberal Democratic Party (LDP) Jiyū Minshutō | 32,518,389 | 47.8% | 219 | 25,887,798 | 38.2% | 77 | 296 | | | |
| New Komeito Party (NKP) Kōmeitō ("Justice Party") | 981,105 | 1.4% | 8 | 8,987,620 | 13.3% | 23 | 31 | | | |
| Ruling coalition | 33,499,494 | 49.2% | 227 | 34,875,418 | 51.5% | 100 | 327 | | | |
| People's New Party (PNP) Kokumin Shintō | 432,679 | 0.6% | 2 | 1,183,073 | 1.7% | 2 | 4 | | | |
| New Party Nippon (NPN) Shintō Nippon | 137,172 | 0.2% | 0 | 1,643,506 | 2.4% | 1 | 1 | | | |
| Postal privatization rebel parties | 569,851 | 0.7% | 2 | 2,826,579 | 4.1% | 3 | 5 | | | |
| Democratic Party of Japan (DPJ) Minshutō ("Democratic Party") | 24,804,786 | 36.4% | 52 | 21,036,425 | 31.0% | 61 | 113 | | | |
| Japanese Communist Party (JCP) Nihon Kyōsantō | 4,937,375 | 7.3% | 0 | 4,919,187 | 7.3% | 9 | 9 | | | |
| Social Democratic Party (SDP) Shakai Minshutō | 996,007 | 1.5% | 1 | 3,719,522 | 5.5% | 6 | 7 | | | |
| New Party Daichi (NPD) Shintō Daichi | 16,698 | 0.0% | 0 | 433,938 | 0.6% | 1 | 1 | | | |
| Others | 1,557 | 0.0 % | 0 | – | 0 | | | |||
| Other opposition parties | 30,756,423 | 45.2% | 53 | 30,109,072 | 44.4% | 77 | 130 | | | |
| Independents (including most postal privatization rebels) | 3,240,521 | 4.8% | 18 | – | 18 | | | |||
| Totals | 68,066,291 | 100.00% | 300 | 67,811,069 | 100.00% | 180 | 480 | | | |
| Turnout | 67.51% | 67.46%, overseas: 25.78% | *(vacant seats) | |||||||
September 12: Norway
 |
| This article is part of a series on the politics and government of Norway |
| Constitution |
|
Government |
|
Parliament
|
| Parties | Votes | Seats | ||||
|---|---|---|---|---|---|---|
| # | % | ± % | # | ± | ||
| Norwegian Labour Party (Det norske Arbeiderparti) | 862,757 | 32.7 | +8.4 | 61 | +18 | |
| Progress Party (Fremskrittspartiet) | 582,284 | 22.1 | +7.4 | 38 | +12 | |
| Conservative Party (Høyre) | 372,008 | 14.1 | −7.1 | 23 | −15 | |
| Socialist Left Party (Sosialistisk Venstreparti) | 233,069 | 8.8 | −3.7 | 15 | −8 | |
| Christian Democratic Party (Kristelig Folkeparti) | 178,889 | 6.8 | −5.6 | 11 | −11 | |
| Centre Party (Senterpartiet) | 171,124 | 6.5 | +0.9 | 11 | +1 | |
| Liberal Party (Venstre) | 156,081 | 5.9 | +2.0 | 10 | +8 | |
| Red Electoral Alliance (Rød Valgallianse) | 32,365 | 1.2 | 0.0 | 0 | 0 | |
| Coastal Party (Kystpartiet) | 21,946 | 0.8 | −0.9 | 0 | −1 | |
| Pensioners' Party (Pensjonistpartiet) | 13,559 | 0.5 | –0.2 | 0 | 0 | |
| Christian Unity Party (Kristent Samlingsparti) | 3,865 | 0.1 | –0.2 | 0 | 0 | |
| Environment Party The Greens (Miljøpartiet De Grønne) | 3,652 | 0.1 | 0.0 | 0 | 0 | |
| The Democrats (Demokratene) | 2,706 | 0.1 | – | 0 | – | |
| Abortion Opponents' List (Abortmotstandernes Liste) | 1,932 | 0.1 | – | 0 | – | |
| Communist Party of Norway (Norges Kommunistiske Parti) | 1,066 | 0.0 | 0.0 | 0 | 0 | |
| Reform Party (Reformpartiet) | 727 | 0.0 | – | 0 | – | |
| Sami People Party (Sámeálbmot bellodat, Samefolkets Parti) | 660 | 0.0 | 0.0 | 0 | 0 | |
| Liberal People's Party (Det Liberale Folkeparti) | 213 | 0.0 | 0.0 | 0 | 0 | |
| Norwegian Republican Alliance (Norsk Republikansk Allianse) | 94 | 0.0 | – | 0 | – | |
| Beer Unity Party (Pilsens Samlingsparti) | 65 | 0.0 | – | 0 | – | |
| Society Party (Samfunnspartiet) | 43 | 0.0 | 0.0 | 0 | 0 | |
| 2,639,105 | 100% | 169 | ||||
September 17: New Zealand
 |
| This article is part of a series on the politics and government of New Zealand |
| Constitution |
|
|
|
|
Related topics |
| party | votes | % of votes | seats | |||||
|---|---|---|---|---|---|---|---|---|
| % | change | electorate | list | total | change | |||
| Labour | 935,319 | 41.10 | -0.16 | 31 | 19 | 50 | -2 | |
| National | 889,813 | 39.10 | +18.17 | 31 | 17 | 48 | +21 | |
| NZ First | 130,115 | 5.72 | -4.66 | 0 | 7 | 7 | -6 | |
| Green | 120,521 | 5.30 | -1.70 | 0 | 6 | 6 | -3 | |
| Māori | 48,263 | 2.12 | +2.12 | 4 | 0 | 4 | +4 | |
| United Future | 60,860 | 2.67 | -4.02 | 1 | 2 | 3 | -5 | |
| ACT | 34,469 | 1.51 | -5.63 | 1 | 1 | 2 | -7 | |
| Progressive | 26,441 | 1.16 | -0.54 | 1 | 0 | 1 | -1 | |
| other parties | 29,828 | 1.31 | -3.58 | 0 | 0 | 0 | 0 | |
| total | 2,275,629 | 100.00 | 69 | 52 | 121 | +1 | ||
| informal votes | 10,561 | |||||||
| disallowed special votes | 17,815 | |||||||
| total votes cast | 2,304,005 | |||||||
| turnout | 80.92% | |||||||
September 18: Afghanistan
 |
| This article is part of a series on the politics and government of Afghanistan |
|
Legislature |
|
Judiciary |
| Foreign relations |
| Candidates | Seats |
|---|---|
| Non-partisans | 249 |
| Total | 249 |
September 18: Germany
 |
| This article is part of a series on the politics and government of Germany |
|
Constitution ("Fundamental Law Code") |
|
| Foreign relations |
| Parties | Constituency | Party list | Total seats | |||||||||||||
|---|---|---|---|---|---|---|---|---|---|---|---|---|---|---|---|---|
| Votes | % | +/− | Seats | +/− | Votes | % | +/− | Seats | +/− | Seats | +/− | % | ||||
| Social Democratic Party (SPD) | 18,129,100 | 38.4 | −3.5 | 145 | −26 | 16,194,665 | 34.2 | −4.3 | 77 | −3 | 222 | −29 | 36.2 | |||
| Christian Democratic Union (CDU) | 15,390,950 | 32.6 | +0.6 | 106 | +24 | 13,136,740 | 27.8 | −1.7 | 74 | −34 | 180 | −10 | 29.3 | |||
| Free Democratic Party (FDP) | 2,208,531 | 4.7 | −1.1 | 0 | ±0 | 4,648,144 | 9.8 | +2.5 | 61 | +14 | 61 | +14 | 9.9 | |||
| The Left Party.PDS | 3,764,168 | 8.0 | +3.7 | 3 | +1 | 4,118,194 | 8.7 | +4.7 | 51 | +51 | 54 | +52 | 8.8 | |||
| Alliance '90/The Greens (Grüne) | 2,538,913 | 5.4 | −0.2 | 1 | ±0 | 3,838,326 | 8.1 | −0.5 | 50 | −4 | 51 | −4 | 8.3 | |||
| Christian Social Union (CSU) | 3,889,990 | 8.2 | −0.8 | 44 | +1 | 3,494,309 | 7.4 | −1.6 | 2 | −13 | 46 | −12 | 7.5 | |||
| National Democratic Party (NPD) | 857,777 | 1.8 | +1.6 | 0 | ±0 | 748,568 | 1.6 | +1.2 | 0 | ±0 | 0 | ±0 | 0 | |||
| The Republicans (REP) | 38,678 | 0.1 | ±0 | 0 | ±0 | 266,101 | 0.6 | ±0 | 0 | ±0 | 0 | ±0 | 0 | |||
| The Grays – Gray Panthers (GRAUE) | 6,340 | 0.0 | −0.2 | 0 | ±0 | 198,601 | 0.4 | +0.2 | 0 | ±0 | 0 | ±0 | 0 | |||
| Family Party (FAMILIE) | 76,064 | 0.2 | +0.2 | 0 | ±0 | 191,842 | 0.4 | +0.3 | 0 | ±0 | 0 | ±0 | 0 | |||
| Animal Protection Party | 7,341 | 0.0 | ±0 | 0 | ±0 | 110,603 | 0.2 | −0.1 | 0 | ±0 | 0 | ±0 | 0 | |||
| Party of Bible-abiding Christians (PBC) | 57,027 | 0.1 | ±0 | 0 | ±0 | 108,605 | 0.2 | ±0 | 0 | ±0 | 0 | ±0 | 0 | |||
| Marxist-Leninist Party (MLPD) | 16,480 | 0.0 | +0.0 | 0 | ±0 | 45,238 | 0.1 | +0.1 | 0 | ±0 | 0 | ±0 | 0 | |||
| Solidarity (BüSo) | 40,984 | 0.1 | +0.1 | 0 | ±0 | 35,649 | 0.1 | +0.1 | 0 | ±0 | 0 | ±0 | 0 | |||
| Bavaria Party (BP) | 16,047 | 0.0 | ±0 | 0 | ±0 | 35,543 | 0.1 | +0.1 | 0 | ±0 | 0 | ±0 | 0 | |||
| Feminist Party (DIE FRAUEN) | 1,327 | 0.0 | ±0 | 0 | ±0 | 27,497 | 0.1 | ±0 | 0 | ±0 | 0 | ±0 | 0 | |||
| Alliance for Health, Peace and Social Justice (AGFG) | 570 | 0.0 | +0.0 | 0 | ±0 | 21,350 | 0.0 | +0.0 | 0 | ±0 | 0 | ±0 | 0 | |||
| Social Equality Party (PSG) | – | – | – | – | – | 15,605 | 0.0 | +0.0 | 0 | ±0 | 0 | ±0 | 0 | |||
| 50Plus | – | – | – | – | – | 10,536 | 0.0 | +0.0 | 0 | ±0 | 0 | ±0 | 0 | |||
| The Party | 6,923 | 0.0 | +0.0 | 0 | ±0 | 10,379 | 0.0 | +0.0 | 0 | ±0 | 0 | ±0 | 0 | |||
| Pro DM | – | – | – | – | – | 10,269 | 0.0 | +0.0 | 0 | ±0 | 0 | ±0 | 0 | |||
| Alliance for Germany (Deutschland) | 1,473 | 0.0 | ±0 | 0 | ±0 | 9,643 | 0.0 | +0.0 | 0 | ±0 | 0 | ±0 | 0 | |||
| Anarchist Pogo Party (APPD) | 3,018 | 0.0 | +0.0 | 0 | ±0 | 4,233 | 0.0 | +0.0 | 0 | ±0 | 0 | ±0 | 0 | |||
| Centre Party (Zentrum) | 1,297 | 0.0 | ±0 | 0 | ±0 | 4,010 | 0.0 | ±0 | 0 | ±0 | 0 | ±0 | 0 | |||
| Party for a Rule of Law Offensive (Offensive D) | 5,401 | 0.0 | −0.3 | 0 | ±0 | 3,338 | 0.0 | −0.8 | 0 | ±0 | 0 | ±0 | 0 | |||
| Independents (UNABHÄNGIGE) | 11,703 | 0.0 | +0.0 | 0 | ±0 | – | – | – | – | – | 0 | ±0 | 0 | |||
| Humanist Party (HP) | 2,029 | 0.0 | ±0 | 0 | ±0 | – | – | – | – | – | 0 | ±0 | 0 | |||
| German Social Union (DSU) | 1,655 | 0.0 | ±0 | 0 | ±0 | – | – | – | – | – | 0 | ±0 | 0 | |||
| Christian Centre (CM) | 1,011 | 0.0 | ±0 | 0 | ±0 | – | – | – | – | – | 0 | ±0 | 0 | |||
| Human Economy Party | 639 | 0.0 | +0.0 | 0 | ±0 | – | – | – | – | – | 0 | ±0 | 0 | |||
| Statt Party | 496 | 0.0 | +0.0 | 0 | ±0 | – | – | – | – | – | 0 | ±0 | 0 | |||
| Electoral groups and independents | 118,130 | 0.3 | +0.2 | 0 | ±0 | – | – | – | – | – | 0 | ±0 | 0 | |||
| Invalid/blank votes | 850,072 | — | — | — | — | 756,146 | — | — | — | — | — | — | — | |||
| Totals | 48,044,134 | 100 | ±0 | 299 | ±0 | 48,044,134 | 100 | ±0 | 315 | +11 | 614 | +11 | 100 | |||
| Registered voters/turnout | 61,870,711 | 77.7 | — | — | — | 61,870,711 | 77.7 | — | — | — | — | — | — | |||
| Source: Federal Returning Officer | ||||||||||||||||
*The Christian Democratic Union and Christian Social Union of Bavaria call themselves sister parties. They do not operate in the same regions and form one group in the Bundestag.
September 23: Aruba
 |
| This article is part of a series on the politics and government of Aruba |
|
| Parties | Votes | % | Seats |
|---|---|---|---|
| People's Electoral Movement (Movimiento Electoral di Pueblo) | 43 | 11 | |
| Aruban People's Party (Arubaanse Volkspartij) | 32 | 8 | |
| Aruban Patriotic Movement (Movimento Patriotico Arubano) | 7 | 1 | |
| Network (RED) | 7 | 1 | |
| Real Democracy (Democracia Real) | 6 | 0 | |
| Aruban Liberal Organization (Organisacion Liberal Arubiano) | 4 | 0 | |
| Aruban Patriotic Party (Partido Patriótico Arubano) | 2 | 0 | |
| Total | 21 |
September 25: Poland
 |
| This article is part of a series on the politics and government of Poland |
|
|
Related topics
|
| Parties | Votes | % | Seats Sejm | +/- | Seats Senate | |
|---|---|---|---|---|---|---|
| Law and Justice (Prawo i Sprawiedliwość, PiS) | 3,185,714 | 27.0 | 155 | +111 | 49 | |
| Civic Platform (Platforma Obywatelska, PO) | 2,849,259 | 24.1 | 133 | +68 | 34 | |
| Self-Defence of the Republic of Poland (Samoobrona RP) | 1,347,355 | 11.4 | 56 | +3 | 3 | |
| Democratic Left Alliance (Sojusz Lewicy Demokratycznej, SLD) | 1,335,257 | 11.3 | 55 | -161 | - | |
| League of Polish Families (Liga Polskich Rodzin, LPR) | 940,726 | 8.0 | 34 | -4 | 7 | |
| Polish People's Party (Polskie Stronnictwo Ludowe, PSL) | 821,656 | 7.0 | 25 | -17 | 2 | |
| Social Democracy of Poland (Socjaldemokracja Polska, SDPL) | 459,380 | 3.9 | - | - | ||
| Democratic Party (Partia Demokratyczna) | 289,276 | 2.5 | - | - | ||
| Janusz Korwin-Mikke Platform (Platforma Janusza Korwin-Mikke, PJKM) | 185,885 | 1.6 | - | - | ||
| Patriotic Movement (Ruch Patriotyczny) | 124,038 | 1.1 | - | - | ||
| Polish Labor Party (Polska Partia Pracy, PPP) | 91,266 | 0.8 | - | - | ||
| German Minority Electoral Committee (Komitet Wyborczy Mniejszość Niemiecka) | 34,469 | 0.3 | 2 | |||
| Polish National Party (Polska Partia Narodowa) | 34,127 | 0.3 | - | |||
| Native House (Dom Ojczysty) | 32,863 | 0.3 | - | |||
| Centre (Centrum) | 21,893 | 0.2 | - | |||
| All-Poland Civic Coalition (Ogólnopolska Koalicja Obywatelska) | 16,251 | 0.1 | - | |||
| Party Initiative of the Republic of Poland (Partia Inicjatywa Rzeczypospolitej Polskiej) | 11,914 | 0.1 | - | |||
| Polish Confederation – Dignity and Work (Polska Konfederacja – Godność i Praca) | 8,353 | 0.1 | - | |||
| National Rebirth of Poland (Narodowe Odrodzenie Polski) | 7,376 | 0.1 | - | |||
| German Minority of Silesia (Mniejszość Niemiecka Śląska) | 5,581 | 0.1 | - | |||
| Labour Party (Stronnictwo Pracy) | 1,019 | 0.01 | - | |||
| Social Rescuers (Społeczni Ratownicy) | 982 | 0.01 | - | |||
| Independents | 5 | |||||
| Total (turnout 40.6 %) | 11,804,676 | 460 | 100 | |||
| ||||||
September 25: Macau

| Lists | Votes | % | Seats | |
|---|---|---|---|---|
| United Citizens Association of Macau (Associação dos Cidadãos Unidos de Macau) (澳門民聯協進會) |
20,695 | 16.58 | 2 | |
| Alliance for the Development of Macau (Aliança para Desenvolvimento de Macau) (澳門發展聯盟) |
11,642 | 9.33 | 1 | |
| General Union for the Good of Macau (União Geral para O Bem-querer de Macau) (愛澳聯盟) |
8,517 | 6.82 | 1 | |
| Convergence for Development (Convergência para o Desenvolvimento) (繁榮澳門同盟) |
6,079 | 4.87 | 1 | |
| Vision Macau (Associação Visão de Macau) (澳門前瞻協進會) |
1,973 | 1.58 | 0 | |
| União dos Trabalhadores dos Jogos de Fortuna e Azar de Macau | 922 | 0.74 | 0 | |
| Union for Development (União para o Desenvolvimento) (同心協進會) |
16,588 | 13.29 | 2 | |
| Union for Promoting Progress (União Promotora para o Progresso) (群力促進會) |
11,985 | 9.60 | 2 | |
| Association for Democracy and Social Well-Being of Macau (Associação Pela Democracia e Bem-estar Social de Macau) (澳門民主民生協進會) |
4,356 | 3.49 | 0 | |
| New Youth of Macau (Nova Juventude de Macau) (澳門新青年) |
3,060 | 2.45 | 0 | |
| Association for Helping the Community and Engagement with the People (Associação de Apoio à Comunidade e Proximidade do Povo) (親民愛群協會) |
2,941 | 2.36 | 0 | |
| Associação Direitos dos Cidadãos | 191 | 0.15 | 0 | |
| Pro-establishment camp | 88,949 | 71.26 | 9 | |
| New Democratic Macau Association (Associação Novo Macau Democrático) (民主新澳門) |
23,472 | 18.80 | 2 | |
| New Hope (Nova Esperança) (新希望) |
9,973 | 7.99 | 1 | |
| Por Macau | 892 | 0.71 | 0 | |
| Associação do Activismo para a Democracia | 654 | 0.52 | 0 | |
| União dos Operários | 457 | 0.37 | 0 | |
| Um Novo Vigor Para Macau | 448 | 0.36 | 0 | |
| Pro-democratic camp | 35,896 | 28.75 | 3 | |
| Subtotal (turnout 58.4%) | 124,845 | 100.00 | 12 | |
| Functional constituencies and appointed members | ||||
| Macau Business Interest Union (União dos Interesses Empresariais de Macau) (澳門僱主利益聯會) for employers |
4 | |||
| Employees Association Joint Candidature Commission (Comissão Conjunta da Candidatura das Associações de Empregados) (僱員團體聯合) for labour |
2 | |||
| Macau professional Interest Union (União dos Interesses Profissionais de Macau) (澳門專業利益聯會) special interests |
2 | |||
| Excellent Culture and Sports Union Association (Associação União Cultural e Desportiva Excelente) (優裕文康聯合會) charity, culture, education and sport |
2 | |||
| Members appointed by the Chief Executive | 7 | |||
| Total | 29 | |||
September 28: Somaliland
 |
| This article is part of a series on the politics and government of Somaliland |
|
Constitution |
|
|
Judiciary |
|
|
|
Other |
|
|
| Parties | Votes | % | Seats |
|---|---|---|---|
| UDUB For Unity, Democracy, and Independence (Ururka dimuqraadiga ummadda bahawday) | 261,449 | 39.0 | 33 |
| KULMIYE Peace, Unity, and Development Party (KULMIYE Nabad, Midnimo iyo horumar) | 228,328 | 34.1 | 28 |
| UCID For Justice and Development (Ururka Caddaalada iyo Daryeelka) | 180,545 | 26.9 | 21 |
| Total | 680,322 | 100.0 | 82 |
| Invalid votes | 4,585 | ||
| Total votes cast | 674,907 | ||
| Source: IRI | |||
October
October 9: Poland
|
| This article is part of a series on the politics and government of Poland |
|
|
Related topics
|
| Candidates and nominating parties | Votes 1st round | % | Votes 2nd round | % | |
|---|---|---|---|---|---|
| Lech Kaczyński - Law and Justice | 4,947,927 | 33.1 | 8,257,468 | 54.04 | |
| Donald Tusk - Civic Platform | 5,429,666 | 36.3 | 7,022,319 | 45.96 | |
| Andrzej Lepper - Self-Defense of the Republic of Poland | 2,259,094 | 15.1 | |||
| Marek Borowski - Social Democracy of Poland | 1,544,642 | 10.3 | |||
| Jarosław Kalinowski - Polish People's Party | 269,316 | 1.8 | |||
| Janusz Korwin-Mikke - Real Politics Union | 214,116 | 1.4 | |||
| Henryka Bochniarz - Democratic Party | 188,598 | 1.3 | |||
| Liwiusz Ilasz | 31,691 | 0.2 | |||
| Stanisław Tymiński - All-Polish Citizens Coalition | 23,545 | 0.2 | |||
| Leszek Bubel - Polish National Party | 18,828 | 0.1 | |||
| Jan Pyszko - Organization of the Polish Nation - Polish League | 10,371 | 0.1 | |||
| Adam Słomka - The Polish Confederation-Freedom and the Work | 8,895 | 0.1 | |||
| Total | 15,046,350 | 100.00 | 15,279,787 | 100.00 | |
| Total valid votes | 15,046,350 | 15,279,787 | |||
| Total invalid votes | 155,233 | 159,897 | |||
| Total votes cast | 15,435,020 | 15,439,684 | |||
| Turnout | 49.7% | 50.99% | |||
| Source: National Electoral Commission | |||||
October 11: Liberia
 |
| This article is part of a series on the politics and government of Liberia |
|
Judiciary |
| Political Party |
Candidates |
Number of Votes |
% of Votes |
Number of Seats |
% of Seats |
|---|---|---|---|---|---|
| Congress for Democratic Change | 58 | 157,753 | 15.97% | 15 | 23.44% |
| Liberty Party | 62 | 125,469 | 12.70% | 9 | 14.06% |
| Coalition for the Transformation of Liberia | 61 | 137,897 | 13.97% | 8 | 12.50% |
| Unity Party | 58 | 123,373 | 12.49% | 8 | 12.50% |
| Alliance for Peace and Democracy | 24 | 38,285 | 3.86% | 5 | 7.81% |
| National Patriotic Party | 50 | 78,751 | 7.97% | 4 | 6.25% |
| New Deal Movement | 21 | 35,721 | 3.62% | 3 | 4.69% |
| All Liberia Coalition Party | 13 | 19,471 | 1.97% | 2 | 3.13% |
| National Democratic Party of Liberia | 28 | 29,402 | 2.98% | 1 | 1.56% |
| National Reformation Party | 24 | 22,542 | 2.28% | 1 | 1.56% |
| United Democratic Alliance | 9 | 14,078 | 1.43% | 1 | 1.56% |
| Free Democratic Party | 12 | 19,326 | 1.96% | 0 | 0 |
| Progressive Democratic Party | 12 | 11,997 | 1.21% | 0 | 0 |
| Freedom Alliance Party of Liberia | 16 | 11,126 | 1.13% | 0 | 0 |
| Union of Liberian Democrats | 9 | 10,089 | 1.02% | 0 | 0 |
| Labor Party of Liberia | 9 | 7,811 | 0.79% | 0 | 0 |
| Liberia Equal Rights Party | 3 | 7,256 | 0.73% | 0 | 0 |
| Reformed United Liberia Party | 8 | 6,252 | 0.63% | 0 | 0 |
| Liberian Destiny Party | 8 | 5,493 | 0.60% | 0 | 0 |
| National Vision Party of Liberia | 2 | 3,443 | 0.35% | 0 | 0 |
| National Party of Liberia | 1 | 1,532 | 0.16% | 0 | 0 |
| Independents | 25 | 65,073 | 6.59% | 7 | 10.94% |
| Invalid or blank votes | - | 52,550 | 5.32% | - | - |
| Totals | 513 | 987,911 | 100% | 64 | 100% |
| Political Party |
Candidates |
Number of Votes |
% of Votes |
Number of Seats |
% of Seats |
|---|---|---|---|---|---|
| Coalition for the Transformation of Liberia | 29 | 232,636 | 13.51% | 7 | 23.33% |
| Unity Party | 27 | 222,705 | 12.93% | 4 | 13.33% |
| Congress for Democratic Change | 25 | 252,677 | 15.97% | 3 | 10.00% |
| Liberty Party | 29 | 213,234 | 12.38% | 3 | 10.00% |
| National Patriotic Party | 20 | 178,259 | 10.35% | 3 | 10.00% |
| Alliance for Peace and Democracy | 13 | 119,091 | 6.92% | 3 | 10.00% |
| National Democratic Party of Liberia | 16 | 60,668 | 3.52% | 2 | 6.67% |
| All Liberia Coalition Party | 3 | 28,385 | 1.65% | 1 | 3.33% |
| National Reformation Party | 4 | 12,037 | 0.70% | 1 | 3.33% |
| Progressive Democratic Party | 5 | 17,262 | 1.00% | 0 | 0% |
| Reformed United Liberia Party | 4 | 13,293 | 0.77% | 0 | 0% |
| Freedom Alliance Party of Liberia | 5 | 13,050 | 0.76% | 0 | 0% |
| United Democratic Alliance | 4 | 11,265 | 0.65% | 0 | 0% |
| Union of Liberian Democrats | 1 | 5,503 | 0.32% | 0 | 0% |
| New Deal Movement | 3 | 4,264 | 0.25% | 0 | 0% |
| Liberian Destiny Party | 3 | 3,431 | 0.20% | 0 | 0% |
| Labor Party of Liberia | 1 | 1,645 | 0.10% | 0 | 0% |
| Independents | 13 | 301,729 | 17.52% | 3 | 10.00% |
| Invalid or blank votes | - | 31,206 | 1.81% | - | - |
| Totals | 205 | 1,722,108 | 100.00% | 30 | 100% |
October 19: Jersey
 |
| This article is part of a series on the politics and government of Jersey |
| Members | Seats |
|---|---|
| Elected Senators 16 October 2002 / Independent | 6 |
| Elected Senators 19 October 2005 / Independent | 6 |
| Elected Deputies 23 November 2005/ Independent | 29 |
| Ex officio members with voting rights (Connétables Independent) | 12 |
| Ex officio members without voting rights (Bailiff, Attorney General, Solicitor General and Dean) | 4 |
| Total | 57 |
October 23: Argentina
 |
| This article is part of a series on the politics and government of Argentina |
| Foreign relations |
| Coalitions and parties | Chamber of Deputies of the Nation: 127 out of 257 seats |
Senate of the Nation: 24 out of 72 seats | ||||
|---|---|---|---|---|---|---|
| Votes | % | Deputies | Votes | % | Senators | |
| Front for Victory (Frente para la Victoria) | 5,071,094 | 29.9 | 50 | 3,572,361 | 45.1 | 14 |
| Radical Civic Union (Unión Cívica Radical) | 1,514,653 | 8.9 | 10 | 597,730 | 7.5 | 2 |
| Support for an Egalitarian Republic (Alternativa por una República de Iguales) | 1,227,726 | 7.2 | 8 | 549,208 | 6.9 | - |
| Justicialist Party (Partido Justicialista) | 1,142,522 | 6.7 | 9 | 58,485 | 0.7 | 1 |
| Republican Proposal (Propuesta Republicana - PRO) | 1,046,020 | 6.2 | 9 | 492,892 | 6.2 | - |
| Justicialist Front (Frente Justicialista) | 670,309 | 3.9 | 7 | 1,364,880 | 17.2 | 3 |
| Progressive, Civic and Social Front (Frente Progresista Cívico y Social) | 625,335 | 3.7 | 5 | |||
| Alliance Union of Córdoba (Alianza Unión Córdoba) | 530,115 | 3.1 | 4 | |||
| Federalist Unity Party (Partido Unidad Federalista) | 372,843 | 2.2 | 2 | |||
| Alliance New Front (Alianza Frente Nuevo) | 347,412 | 2.0 | 3 | |||
| Front for Everyone (Frente de Todos) | 316,294 | 1.9 | 6 | |||
| Front for the Renewal of Concord (Frente Renovador de la Concordia) | 189,327 | 1.1 | 2 | 187,255 | 2.4 | 2 |
| Civic Front for Santiago (Frente Cívico por Santiago) | 185,733 | 1.1 | 3 | |||
| Neuquén People's Movement (Movimiento Popular Neuquino) | 85,700 | 0.5 | 2 | |||
| Front of Jujuy (Frente Jujeño) | 78,051 | 1.0 | 1 | |||
| Alliance Front of Production and Labour (Alianza Frente Produccion y Trabajo) | 71,984 | 0.9 | 1 | |||
| Others | 3,647,997 | 21.5 | 7 | 953,739 | 12.0 | - |
| Total (turnout 70.9 % resp. 72.3 %) | 16,973,080 | 127 | 7,926,585 | 24 | ||
| Registered voters | 26,098,546 | 12,081,098 | ||||
| Votes cast | 18,513,717 | 8,730,094 | ||||
| Invalid votes | 1,540,637 | 8.3 | 803,509 | 9.2 | ||
| Source: Adam Carr's Website Be aware that parties operate under various labels and alliances in the provinces. | ||||||
November
November 5: Northern Mariana Islands
.svg.png) |
| This article is part of a series on the politics and government of the Northern Mariana Islands |
|
| Candidates and nominating parties | Votes | % |
|---|---|---|
| Benigno R. Fitial – Covenant Party | 3,809 | 28.1 |
| Heinz Hofschneider – Independent | 3,710 | 27.3 |
| Juan Babauta – Republican Party | 3,610 | 26.6 |
| Froilan Tenorio – Democratic Party | 2,442 | 18.0 |
| Total | 13,517 |
| Parties | Seats | |
|---|---|---|
| House | Senate | |
| Covenant Party | 7 | 3 |
| Republican Party | 7 | 3 |
| Democratic Party | 2 | 2 |
| Independent | 2 | 1 |
| Total | 18 | 9 |
November 6: Azerbaijan
 |
| This article is part of a series on the politics and government of Azerbaijan |
| See also |
| Parties and alliances | Votes | % | Seats |
|---|---|---|---|
| New Azerbaijan Party (Yeni Azərbaycan Partiyası) | 61 | ||
Freedom (Azadlıq)
|
MP 5 AXCP 1 | ||
| Motherland Party (Ana Vatan) | - | 2 | |
| Civic Solidarity Party (Vətəndaş Həmrəyliyi Partiyası) | 3 | ||
| Azerbaijan Hope Party (Azərbaycan Ümid Partiyasi) | - | 1 | |
| Azerbaijan Social Prosperity Party (Azərbaycan Sosial Rifah Partiyası) | - | 1 | |
| Azerbaijan Justice Party (unknown) | - | 1 | |
| Azerbaijan Political Party of Democratic Reforms (Azərbaycan Demokratik Islahatlar Siyasi Partiyasi) | - | 1 | |
| Whole Azerbaijan Popular Front Party (Bütöv Azərbaycan Xalq Cəbhəsi Partiyasi ) | - | 1 | |
| Great Order Party (Böyük Qurulus Partiyasi) | - | 1 | |
| Civil Union Party (Vətəndas Birliyi Partiyasi) | - | 1 | |
| Non-partisans | - | 43 | |
| Persons who did not indicate their party affiliation | - | 3 | |
| Total | 125 |
November 7: Egypt
|
| This article is part of a series on the politics and government of Egypt |
| Constitution (history) |
|
Government |
|
Legislature |
| Political parties (former) |
| Parties | Votes | % | Seats | Gains | Losses | Net Gain/Loss |
Seats % | |
|---|---|---|---|---|---|---|---|---|
| National Democratic Party (Al'Hizb Al Watani Al Democrati) | 311 | ? | -42 | ? | 68.5 | |||
| New Wafd Party (Hizb al-Wafd-al-Jadid) | 6 | ? | -1 | ? | 1.3 | |||
| Progressive National Unionist Party (Hizb al Tagammo' al Watani al Taqadommi al Wahdwawi) | 2 | ? | -4 | -? | 0.22 | |||
| Tomorrow Party (Hizb al-Ghad) | 1 | 0 | -1 | -1 | 0.2 | |||
| Independents (Muslim Brotherhood - al-ikhwān al-muslimūn) | 88 | 71 | ? | ? | 19.4 | |||
| Independents (other) | 24 | ? | ? | ? | 5.3 | |||
| Still in contest | 0 | |||||||
| Unelected members | 10 | 0 | 0 | 0 | 2.2 | |||
| Arab Democratic Nasserist Party or Nasserist Party | 0 | 0 | -1 | -1 | 0 | |||
| Liberal Party (Hizb al-Ahrar) | 0 | 0 | -1 | -1 | 0 | |||
| Total (turnout %) | 454 | |||||||
November 13: Burkina Faso
| Candidate | Party | Votes | % |
|---|---|---|---|
| Blaise Compaoré | Congress for Democracy and Progress | 1,660,148 | 80.35 |
| Bénéwendé Stanislas Sankara | Union for Rebirth / Sankarist Movement | 100,816 | 4.88 |
| Laurent Bado | National Rebirth Party | 53,743 | 2.60 |
| Philippe Ouédraogo | Party for Democracy and Socialism | 47,146 | 2.28 |
| Ram Ouédraogo | Rally of the Ecologists of Burkina | 42,061 | 2.04 |
| Ali Lankoandé | Party for Democracy and Progress / Socialist Party | 35,949 | 1.74 |
| Norbert Tiendrébéogo | Social Forces Front | 33,353 | 1.61 |
| Soumane Touré | African Independence Party (Touré) | 23,266 | 1.13 |
| Gilbert Bouda | Burkinabé Party for Refoundation | 21,658 | 1.05 |
| Pargui Emile Paré | Socialist Alliance | 17,998 | 0.87 |
| Hermann Yaméogo | National Union for the Defence of Democracy | 15,685 | 0.76 |
| Toubé Clément Dakio | Union for Democracy and Development | 7,741 | 0.37 |
| Nayabtigungu Congo Kaboré | Movement for Tolerance and Progress | 6,706 | 0.32 |
| Invalid/blank votes | 196,629 | – | |
| Total | 2,262,899 | 100 | |
| Registered Voters/turnout | 3,924,328 | 57.66 | |
| Source: African Elections Database | |||
November 15: Greenland
 |
| This article is part of a series on the politics and government of Greenland |
|
|
|
|
| ← 2002 • 2005 • 2009 → | ||||||||||
| Party | Main candidate | Votes | % | +/– | Seats | +/– | ||||
|---|---|---|---|---|---|---|---|---|---|---|
| Forward (Siumut) | Hans Enoksen | 8,855 | 30.66 | 10 | ||||||
| Democrats (Demokraatit) | 6,596 | 22.84 | 7 | |||||||
| Community of the People (Inuit Ataqatigiit) | 6,517 | 22.56 | 7 | |||||||
| Feeling of Community (Atassut) | 5,527 | 19.13 | 6 | |||||||
| Association of Candidates (Kattusseqatigiit) | 1,170 | 4.05 | 1 | |||||||
| Others | 216 | 0.75 | – | 0 | – | |||||
| Valid votes | 28,885 | 99.13 | ||||||||
| Blank and invalid votes | 254 | 0.87 | ||||||||
| Totals | 29,139 | 100.00 | — | 31 | — | |||||
| Electorate (eligible voters) and voter turnout | 38,924 | 74.86 | ||||||||
| Source: Namminersornerullutik Oqartussat | ||||||||||
November 17: Falkland Islands
 |
| This article is part of a series on the politics and government of the Falkland Islands |
|
|
Summary of the 17 November 2005 Legislative Council election results
| Stanley result | |||||||||||||||||||||||||||||||||||||||||||||||||||||||||||||||||||||||||||||||||||||||||||||||||||||||||||||||||||||||||||||||||||||||||||||||||||||||||||||||||||||||||||||||||||||||||||||||||||||||||||||||||||||||||||||||||||||||||||||||||||||||||||||||||||||||||||||||||||||||||||||||||||||||||||||||||||||||||||||||||||||||||||||||||||||||||||||||||||||||||||||||||||||||||||||||||||||||||||||||||||||||||||||||||||||||||||||||||||||||||||||||||||||||||||||||||||||||||||||||||||||||||||||||||||||||||||||||||||||||||||||||||||||||||||||||||||||||||||||||||||||||||||||||||||||||||||||||||||||||||||||||||||||||||||||||||||||||||||||||||||||||||||||||||||||||||||||||||||||||||||||||||||||||||||||||||||||||||||||||||||||||||||||||||||||||||||||||||||||||||||||||||||||||||||||||||||||||||||||||||||||||||||||||||||||||||||||||||||||||||||||||||||||||||||||||||||||||||||||||||||||||||||||||||||||||||||||||||||||||||||||||||||||||||||||||||||||||||||||||||||||||||||||||||||||||||||||||||||||||
|---|---|---|---|---|---|---|---|---|---|---|---|---|---|---|---|---|---|---|---|---|---|---|---|---|---|---|---|---|---|---|---|---|---|---|---|---|---|---|---|---|---|---|---|---|---|---|---|---|---|---|---|---|---|---|---|---|---|---|---|---|---|---|---|---|---|---|---|---|---|---|---|---|---|---|---|---|---|---|---|---|---|---|---|---|---|---|---|---|---|---|---|---|---|---|---|---|---|---|---|---|---|---|---|---|---|---|---|---|---|---|---|---|---|---|---|---|---|---|---|---|---|---|---|---|---|---|---|---|---|---|---|---|---|---|---|---|---|---|---|---|---|---|---|---|---|---|---|---|---|---|---|---|---|---|---|---|---|---|---|---|---|---|---|---|---|---|---|---|---|---|---|---|---|---|---|---|---|---|---|---|---|---|---|---|---|---|---|---|---|---|---|---|---|---|---|---|---|---|---|---|---|---|---|---|---|---|---|---|---|---|---|---|---|---|---|---|---|---|---|---|---|---|---|---|---|---|---|---|---|---|---|---|---|---|---|---|---|---|---|---|---|---|---|---|---|---|---|---|---|---|---|---|---|---|---|---|---|---|---|---|---|---|---|---|---|---|---|---|---|---|---|---|---|---|---|---|---|---|---|---|---|---|---|---|---|---|---|---|---|---|---|---|---|---|---|---|---|---|---|---|---|---|---|---|---|---|---|---|---|---|---|---|---|---|---|---|---|---|---|---|---|---|---|---|---|---|---|---|---|---|---|---|---|---|---|---|---|---|---|---|---|---|---|---|---|---|---|---|---|---|---|---|---|---|---|---|---|---|---|---|---|---|---|---|---|---|---|---|---|---|---|---|---|---|---|---|---|---|---|---|---|---|---|---|---|---|---|---|---|---|---|---|---|---|---|---|---|---|---|---|---|---|---|---|---|---|---|---|---|---|---|---|---|---|---|---|---|---|---|---|---|---|---|---|---|---|---|---|---|---|---|---|---|---|---|---|---|---|---|---|---|---|---|---|---|---|---|---|---|---|---|---|---|---|---|---|---|---|---|---|---|---|---|---|---|---|---|---|---|---|---|---|---|---|---|---|---|---|---|---|---|---|---|---|---|---|---|---|---|---|---|---|---|---|---|---|---|---|---|---|---|---|---|---|---|---|---|---|---|---|---|---|---|---|---|---|---|---|---|---|---|---|---|---|---|---|---|---|---|---|---|---|---|---|---|---|---|---|---|---|---|---|---|---|---|---|---|---|---|---|---|---|---|---|---|---|---|---|---|---|---|---|---|---|---|---|---|---|---|---|---|---|---|---|---|---|---|---|---|---|---|---|---|---|---|---|---|---|---|---|---|---|---|---|---|---|---|---|---|---|---|---|---|---|---|---|---|---|---|---|---|---|---|---|---|---|---|---|---|---|---|---|---|---|---|---|---|---|---|---|---|---|---|---|---|---|---|---|---|---|---|---|---|---|---|---|---|---|---|---|---|---|---|---|---|---|---|---|---|---|---|---|---|---|---|---|---|---|---|---|---|---|---|---|---|---|---|---|---|---|---|---|---|---|---|---|---|---|---|---|---|---|---|---|---|---|---|---|---|---|---|---|---|---|---|---|---|---|---|---|---|---|---|---|---|---|---|---|---|---|---|---|---|---|---|---|---|---|---|---|---|---|---|---|---|---|---|---|---|---|---|---|---|---|---|---|---|---|---|---|---|---|---|---|---|---|---|---|---|---|---|---|---|---|---|---|---|---|---|---|---|---|---|---|---|---|---|---|---|---|---|---|---|---|---|---|---|---|---|---|---|---|---|---|---|---|---|---|---|---|---|---|---|---|---|---|---|---|---|---|---|---|---|---|---|---|---|---|---|---|---|---|---|---|---|---|---|---|---|---|---|---|---|---|---|---|---|---|---|---|---|---|---|---|---|---|---|---|---|---|---|---|---|---|---|---|---|---|---|---|---|---|---|---|---|---|---|---|---|---|---|---|---|---|---|---|---|---|---|---|---|---|---|---|---|---|---|---|---|---|---|---|---|---|---|---|---|---|---|---|---|---|---|---|---|---|---|---|---|---|---|---|---|---|---|---|---|---|---|---|---|---|---|---|---|---|---|---|---|---|---|---|---|---|---|---|---|---|---|---|---|---|---|---|---|---|---|---|---|---|---|---|---|---|---|---|---|---|---|---|---|---|---|---|---|---|---|---|---|---|---|---|---|---|---|---|---|---|---|---|---|---|---|---|---|---|---|---|---|---|---|---|---|---|---|---|---|---|---|
| List | Candidates | Votes | % | ± | |||||||||||||||||||||||||||||||||||||||||||||||||||||||||||||||||||||||||||||||||||||||||||||||||||||||||||||||||||||||||||||||||||||||||||||||||||||||||||||||||||||||||||||||||||||||||||||||||||||||||||||||||||||||||||||||||||||||||||||||||||||||||||||||||||||||||||||||||||||||||||||||||||||||||||||||||||||||||||||||||||||||||||||||||||||||||||||||||||||||||||||||||||||||||||||||||||||||||||||||||||||||||||||||||||||||||||||||||||||||||||||||||||||||||||||||||||||||||||||||||||||||||||||||||||||||||||||||||||||||||||||||||||||||||||||||||||||||||||||||||||||||||||||||||||||||||||||||||||||||||||||||||||||||||||||||||||||||||||||||||||||||||||||||||||||||||||||||||||||||||||||||||||||||||||||||||||||||||||||||||||||||||||||||||||||||||||||||||||||||||||||||||||||||||||||||||||||||||||||||||||||||||||||||||||||||||||||||||||||||||||||||||||||||||||||||||||||||||||||||||||||||||||||||||||||||||||||||||||||||||||||||||||||||||||||||||||||||||||||||||||||||||||||||||||||||||||||||||||
| Nonpartisan | Richard Davies | 546 | 15.91 | ||||||||||||||||||||||||||||||||||||||||||||||||||||||||||||||||||||||||||||||||||||||||||||||||||||||||||||||||||||||||||||||||||||||||||||||||||||||||||||||||||||||||||||||||||||||||||||||||||||||||||||||||||||||||||||||||||||||||||||||||||||||||||||||||||||||||||||||||||||||||||||||||||||||||||||||||||||||||||||||||||||||||||||||||||||||||||||||||||||||||||||||||||||||||||||||||||||||||||||||||||||||||||||||||||||||||||||||||||||||||||||||||||||||||||||||||||||||||||||||||||||||||||||||||||||||||||||||||||||||||||||||||||||||||||||||||||||||||||||||||||||||||||||||||||||||||||||||||||||||||||||||||||||||||||||||||||||||||||||||||||||||||||||||||||||||||||||||||||||||||||||||||||||||||||||||||||||||||||||||||||||||||||||||||||||||||||||||||||||||||||||||||||||||||||||||||||||||||||||||||||||||||||||||||||||||||||||||||||||||||||||||||||||||||||||||||||||||||||||||||||||||||||||||||||||||||||||||||||||||||||||||||||||||||||||||||||||||||||||||||||||||||||||||||||||||||||||||||||||
| Nonpartisan | Mike Summers | 477 | 13.90 | ||||||||||||||||||||||||||||||||||||||||||||||||||||||||||||||||||||||||||||||||||||||||||||||||||||||||||||||||||||||||||||||||||||||||||||||||||||||||||||||||||||||||||||||||||||||||||||||||||||||||||||||||||||||||||||||||||||||||||||||||||||||||||||||||||||||||||||||||||||||||||||||||||||||||||||||||||||||||||||||||||||||||||||||||||||||||||||||||||||||||||||||||||||||||||||||||||||||||||||||||||||||||||||||||||||||||||||||||||||||||||||||||||||||||||||||||||||||||||||||||||||||||||||||||||||||||||||||||||||||||||||||||||||||||||||||||||||||||||||||||||||||||||||||||||||||||||||||||||||||||||||||||||||||||||||||||||||||||||||||||||||||||||||||||||||||||||||||||||||||||||||||||||||||||||||||||||||||||||||||||||||||||||||||||||||||||||||||||||||||||||||||||||||||||||||||||||||||||||||||||||||||||||||||||||||||||||||||||||||||||||||||||||||||||||||||||||||||||||||||||||||||||||||||||||||||||||||||||||||||||||||||||||||||||||||||||||||||||||||||||||||||||||||||||||||||||||||||||||||
| Nonpartisan | Andrea Clausen | 466 | 13.58 | ||||||||||||||||||||||||||||||||||||||||||||||||||||||||||||||||||||||||||||||||||||||||||||||||||||||||||||||||||||||||||||||||||||||||||||||||||||||||||||||||||||||||||||||||||||||||||||||||||||||||||||||||||||||||||||||||||||||||||||||||||||||||||||||||||||||||||||||||||||||||||||||||||||||||||||||||||||||||||||||||||||||||||||||||||||||||||||||||||||||||||||||||||||||||||||||||||||||||||||||||||||||||||||||||||||||||||||||||||||||||||||||||||||||||||||||||||||||||||||||||||||||||||||||||||||||||||||||||||||||||||||||||||||||||||||||||||||||||||||||||||||||||||||||||||||||||||||||||||||||||||||||||||||||||||||||||||||||||||||||||||||||||||||||||||||||||||||||||||||||||||||||||||||||||||||||||||||||||||||||||||||||||||||||||||||||||||||||||||||||||||||||||||||||||||||||||||||||||||||||||||||||||||||||||||||||||||||||||||||||||||||||||||||||||||||||||||||||||||||||||||||||||||||||||||||||||||||||||||||||||||||||||||||||||||||||||||||||||||||||||||||||||||||||||||||||||||||||||||||
| Nonpartisan | Richard Cockwell | 302 | 8.80 | ||||||||||||||||||||||||||||||||||||||||||||||||||||||||||||||||||||||||||||||||||||||||||||||||||||||||||||||||||||||||||||||||||||||||||||||||||||||||||||||||||||||||||||||||||||||||||||||||||||||||||||||||||||||||||||||||||||||||||||||||||||||||||||||||||||||||||||||||||||||||||||||||||||||||||||||||||||||||||||||||||||||||||||||||||||||||||||||||||||||||||||||||||||||||||||||||||||||||||||||||||||||||||||||||||||||||||||||||||||||||||||||||||||||||||||||||||||||||||||||||||||||||||||||||||||||||||||||||||||||||||||||||||||||||||||||||||||||||||||||||||||||||||||||||||||||||||||||||||||||||||||||||||||||||||||||||||||||||||||||||||||||||||||||||||||||||||||||||||||||||||||||||||||||||||||||||||||||||||||||||||||||||||||||||||||||||||||||||||||||||||||||||||||||||||||||||||||||||||||||||||||||||||||||||||||||||||||||||||||||||||||||||||||||||||||||||||||||||||||||||||||||||||||||||||||||||||||||||||||||||||||||||||||||||||||||||||||||||||||||||||||||||||||||||||||||||||||||||||||
| Nonpartisan | Janet Robertson | 299 | 8.71 | ||||||||||||||||||||||||||||||||||||||||||||||||||||||||||||||||||||||||||||||||||||||||||||||||||||||||||||||||||||||||||||||||||||||||||||||||||||||||||||||||||||||||||||||||||||||||||||||||||||||||||||||||||||||||||||||||||||||||||||||||||||||||||||||||||||||||||||||||||||||||||||||||||||||||||||||||||||||||||||||||||||||||||||||||||||||||||||||||||||||||||||||||||||||||||||||||||||||||||||||||||||||||||||||||||||||||||||||||||||||||||||||||||||||||||||||||||||||||||||||||||||||||||||||||||||||||||||||||||||||||||||||||||||||||||||||||||||||||||||||||||||||||||||||||||||||||||||||||||||||||||||||||||||||||||||||||||||||||||||||||||||||||||||||||||||||||||||||||||||||||||||||||||||||||||||||||||||||||||||||||||||||||||||||||||||||||||||||||||||||||||||||||||||||||||||||||||||||||||||||||||||||||||||||||||||||||||||||||||||||||||||||||||||||||||||||||||||||||||||||||||||||||||||||||||||||||||||||||||||||||||||||||||||||||||||||||||||||||||||||||||||||||||||||||||||||||||||||||||||
| Nonpartisan | John Fowler | 276 | 8.04 | ||||||||||||||||||||||||||||||||||||||||||||||||||||||||||||||||||||||||||||||||||||||||||||||||||||||||||||||||||||||||||||||||||||||||||||||||||||||||||||||||||||||||||||||||||||||||||||||||||||||||||||||||||||||||||||||||||||||||||||||||||||||||||||||||||||||||||||||||||||||||||||||||||||||||||||||||||||||||||||||||||||||||||||||||||||||||||||||||||||||||||||||||||||||||||||||||||||||||||||||||||||||||||||||||||||||||||||||||||||||||||||||||||||||||||||||||||||||||||||||||||||||||||||||||||||||||||||||||||||||||||||||||||||||||||||||||||||||||||||||||||||||||||||||||||||||||||||||||||||||||||||||||||||||||||||||||||||||||||||||||||||||||||||||||||||||||||||||||||||||||||||||||||||||||||||||||||||||||||||||||||||||||||||||||||||||||||||||||||||||||||||||||||||||||||||||||||||||||||||||||||||||||||||||||||||||||||||||||||||||||||||||||||||||||||||||||||||||||||||||||||||||||||||||||||||||||||||||||||||||||||||||||||||||||||||||||||||||||||||||||||||||||||||||||||||||||||||||||||||
| Nonpartisan | Eric Goss | 276 | 8.04 | ||||||||||||||||||||||||||||||||||||||||||||||||||||||||||||||||||||||||||||||||||||||||||||||||||||||||||||||||||||||||||||||||||||||||||||||||||||||||||||||||||||||||||||||||||||||||||||||||||||||||||||||||||||||||||||||||||||||||||||||||||||||||||||||||||||||||||||||||||||||||||||||||||||||||||||||||||||||||||||||||||||||||||||||||||||||||||||||||||||||||||||||||||||||||||||||||||||||||||||||||||||||||||||||||||||||||||||||||||||||||||||||||||||||||||||||||||||||||||||||||||||||||||||||||||||||||||||||||||||||||||||||||||||||||||||||||||||||||||||||||||||||||||||||||||||||||||||||||||||||||||||||||||||||||||||||||||||||||||||||||||||||||||||||||||||||||||||||||||||||||||||||||||||||||||||||||||||||||||||||||||||||||||||||||||||||||||||||||||||||||||||||||||||||||||||||||||||||||||||||||||||||||||||||||||||||||||||||||||||||||||||||||||||||||||||||||||||||||||||||||||||||||||||||||||||||||||||||||||||||||||||||||||||||||||||||||||||||||||||||||||||||||||||||||||||||||||||||||||||
| Nonpartisan | Jan Cheek | 275 | 8.02 | ||||||||||||||||||||||||||||||||||||||||||||||||||||||||||||||||||||||||||||||||||||||||||||||||||||||||||||||||||||||||||||||||||||||||||||||||||||||||||||||||||||||||||||||||||||||||||||||||||||||||||||||||||||||||||||||||||||||||||||||||||||||||||||||||||||||||||||||||||||||||||||||||||||||||||||||||||||||||||||||||||||||||||||||||||||||||||||||||||||||||||||||||||||||||||||||||||||||||||||||||||||||||||||||||||||||||||||||||||||||||||||||||||||||||||||||||||||||||||||||||||||||||||||||||||||||||||||||||||||||||||||||||||||||||||||||||||||||||||||||||||||||||||||||||||||||||||||||||||||||||||||||||||||||||||||||||||||||||||||||||||||||||||||||||||||||||||||||||||||||||||||||||||||||||||||||||||||||||||||||||||||||||||||||||||||||||||||||||||||||||||||||||||||||||||||||||||||||||||||||||||||||||||||||||||||||||||||||||||||||||||||||||||||||||||||||||||||||||||||||||||||||||||||||||||||||||||||||||||||||||||||||||||||||||||||||||||||||||||||||||||||||||||||||||||||||||||||||||||||
| Nonpartisan | Mike Forrest | 261 | 7.61 | ||||||||||||||||||||||||||||||||||||||||||||||||||||||||||||||||||||||||||||||||||||||||||||||||||||||||||||||||||||||||||||||||||||||||||||||||||||||||||||||||||||||||||||||||||||||||||||||||||||||||||||||||||||||||||||||||||||||||||||||||||||||||||||||||||||||||||||||||||||||||||||||||||||||||||||||||||||||||||||||||||||||||||||||||||||||||||||||||||||||||||||||||||||||||||||||||||||||||||||||||||||||||||||||||||||||||||||||||||||||||||||||||||||||||||||||||||||||||||||||||||||||||||||||||||||||||||||||||||||||||||||||||||||||||||||||||||||||||||||||||||||||||||||||||||||||||||||||||||||||||||||||||||||||||||||||||||||||||||||||||||||||||||||||||||||||||||||||||||||||||||||||||||||||||||||||||||||||||||||||||||||||||||||||||||||||||||||||||||||||||||||||||||||||||||||||||||||||||||||||||||||||||||||||||||||||||||||||||||||||||||||||||||||||||||||||||||||||||||||||||||||||||||||||||||||||||||||||||||||||||||||||||||||||||||||||||||||||||||||||||||||||||||||||||||||||||||||||||||||
| Nonpartisan | John Birmingham | 240 | 6.99 | ||||||||||||||||||||||||||||||||||||||||||||||||||||||||||||||||||||||||||||||||||||||||||||||||||||||||||||||||||||||||||||||||||||||||||||||||||||||||||||||||||||||||||||||||||||||||||||||||||||||||||||||||||||||||||||||||||||||||||||||||||||||||||||||||||||||||||||||||||||||||||||||||||||||||||||||||||||||||||||||||||||||||||||||||||||||||||||||||||||||||||||||||||||||||||||||||||||||||||||||||||||||||||||||||||||||||||||||||||||||||||||||||||||||||||||||||||||||||||||||||||||||||||||||||||||||||||||||||||||||||||||||||||||||||||||||||||||||||||||||||||||||||||||||||||||||||||||||||||||||||||||||||||||||||||||||||||||||||||||||||||||||||||||||||||||||||||||||||||||||||||||||||||||||||||||||||||||||||||||||||||||||||||||||||||||||||||||||||||||||||||||||||||||||||||||||||||||||||||||||||||||||||||||||||||||||||||||||||||||||||||||||||||||||||||||||||||||||||||||||||||||||||||||||||||||||||||||||||||||||||||||||||||||||||||||||||||||||||||||||||||||||||||||||||||||||||||||||||||||
| Nonpartisan | Philip Middleton | 179 | 5.22 | ||||||||||||||||||||||||||||||||||||||||||||||||||||||||||||||||||||||||||||||||||||||||||||||||||||||||||||||||||||||||||||||||||||||||||||||||||||||||||||||||||||||||||||||||||||||||||||||||||||||||||||||||||||||||||||||||||||||||||||||||||||||||||||||||||||||||||||||||||||||||||||||||||||||||||||||||||||||||||||||||||||||||||||||||||||||||||||||||||||||||||||||||||||||||||||||||||||||||||||||||||||||||||||||||||||||||||||||||||||||||||||||||||||||||||||||||||||||||||||||||||||||||||||||||||||||||||||||||||||||||||||||||||||||||||||||||||||||||||||||||||||||||||||||||||||||||||||||||||||||||||||||||||||||||||||||||||||||||||||||||||||||||||||||||||||||||||||||||||||||||||||||||||||||||||||||||||||||||||||||||||||||||||||||||||||||||||||||||||||||||||||||||||||||||||||||||||||||||||||||||||||||||||||||||||||||||||||||||||||||||||||||||||||||||||||||||||||||||||||||||||||||||||||||||||||||||||||||||||||||||||||||||||||||||||||||||||||||||||||||||||||||||||||||||||||||||||||||||||||
| Nonpartisan | Kevin Ormond | 110 | 3.21 | ||||||||||||||||||||||||||||||||||||||||||||||||||||||||||||||||||||||||||||||||||||||||||||||||||||||||||||||||||||||||||||||||||||||||||||||||||||||||||||||||||||||||||||||||||||||||||||||||||||||||||||||||||||||||||||||||||||||||||||||||||||||||||||||||||||||||||||||||||||||||||||||||||||||||||||||||||||||||||||||||||||||||||||||||||||||||||||||||||||||||||||||||||||||||||||||||||||||||||||||||||||||||||||||||||||||||||||||||||||||||||||||||||||||||||||||||||||||||||||||||||||||||||||||||||||||||||||||||||||||||||||||||||||||||||||||||||||||||||||||||||||||||||||||||||||||||||||||||||||||||||||||||||||||||||||||||||||||||||||||||||||||||||||||||||||||||||||||||||||||||||||||||||||||||||||||||||||||||||||||||||||||||||||||||||||||||||||||||||||||||||||||||||||||||||||||||||||||||||||||||||||||||||||||||||||||||||||||||||||||||||||||||||||||||||||||||||||||||||||||||||||||||||||||||||||||||||||||||||||||||||||||||||||||||||||||||||||||||||||||||||||||||||||||||||||||||||||||||||||
| Turnout | 3,431 | 69 | |||||||||||||||||||||||||||||||||||||||||||||||||||||||||||||||||||||||||||||||||||||||||||||||||||||||||||||||||||||||||||||||||||||||||||||||||||||||||||||||||||||||||||||||||||||||||||||||||||||||||||||||||||||||||||||||||||||||||||||||||||||||||||||||||||||||||||||||||||||||||||||||||||||||||||||||||||||||||||||||||||||||||||||||||||||||||||||||||||||||||||||||||||||||||||||||||||||||||||||||||||||||||||||||||||||||||||||||||||||||||||||||||||||||||||||||||||||||||||||||||||||||||||||||||||||||||||||||||||||||||||||||||||||||||||||||||||||||||||||||||||||||||||||||||||||||||||||||||||||||||||||||||||||||||||||||||||||||||||||||||||||||||||||||||||||||||||||||||||||||||||||||||||||||||||||||||||||||||||||||||||||||||||||||||||||||||||||||||||||||||||||||||||||||||||||||||||||||||||||||||||||||||||||||||||||||||||||||||||||||||||||||||||||||||||||||||||||||||||||||||||||||||||||||||||||||||||||||||||||||||||||||||||||||||||||||||||||||||||||||||||||||||||||||||||||||||||||||||||||
November 17: Sri Lanka
November 23: Jersey
November 26: Zimbabwe
November 27: Honduras
November 27: Gabon
DecemberDecember 4: Kazakhstan
December 7: VenezuelaVenezuelan parliamentary election, 2005
December 11: Saint Vincent and the Grenadines
December 11: Chile
December 11: Transnistria
December 14: Tanzania
December 15: Iraq
1The KIU contested the previous election as part of the main Kurdish alliance. December 18: Bolivia
—
December 24: Pitcairn
References
| |||||||||||||||||||||||||||||||||||||||||||||||||||||||||||||||||||||||||||||||||||||||||||||||||||||||||||||||||||||||||||||||||||||||||||||||||||||||||||||||||||||||||||||||||||||||||||||||||||||||||||||||||||||||||||||||||||||||||||||||||||||||||||||||||||||||||||||||||||||||||||||||||||||||||||||||||||||||||||||||||||||||||||||||||||||||||||||||||||||||||||||||||||||||||||||||||||||||||||||||||||||||||||||||||||||||||||||||||||||||||||||||||||||||||||||||||||||||||||||||||||||||||||||||||||||||||||||||||||||||||||||||||||||||||||||||||||||||||||||||||||||||||||||||||||||||||||||||||||||||||||||||||||||||||||||||||||||||||||||||||||||||||||||||||||||||||||||||||||||||||||||||||||||||||||||||||||||||||||||||||||||||||||||||||||||||||||||||||||||||||||||||||||||||||||||||||||||||||||||||||||||||||||||||||||||||||||||||||||||||||||||||||||||||||||||||||||||||||||||||||||||||||||||||||||||||||||||||||||||||||||||||||||||||||||||||||||||||||||||||||||||||||||||||||||||||||||||||||||||||


This article is issued from Wikipedia - version of the 9/16/2015. The text is available under the Creative Commons Attribution/Share Alike but additional terms may apply for the media files.