Ilford South (UK Parliament constituency)
| Ilford South | |
|---|---|
|
Borough constituency for the House of Commons | |
|
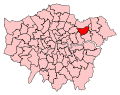
Boundary of Ilford South in Greater London. | |
| County | Greater London |
| Electorate | 86,401 (December 2010)[1] |
| Major settlements | Ilford |
| Current constituency | |
| Created | 1945 |
| Member of parliament | Mike Gapes (Labour Co-operative) |
| Number of members | One |
| Created from | Ilford |
| Overlaps | |
| European Parliament constituency | London |
Ilford South is a constituency[n 1] represented in the House of Commons of the UK Parliament since 1992 by Mike Gapes of the Labour Party and of the Co-operative Party.[n 2]
Boundaries

1945-1950: The Municipal Borough of Ilford wards of Clementswood, Cranbrook, Goodmayes, Loxford, and Park.
1950-1974: The Municipal Borough of Ilford wards of Clementswood, Cranbrook, Goodmayes, Loxford, Mayfield, and Park.
1974-1983: The London Borough of Redbridge wards of Clementswood, Cranbrook, Goodmayes, Ilford, Mayfield, and Park.
1983-1997: The London Borough of Redbridge wards of Clementswood, Cranbrook, Goodmayes, Loxford, Mayfield, Newbury, and Valentines.
1997-present: The London Borough of Redbridge wards of Chadwell, Clementswood, Cranbrook, Goodmayes, Loxford, Mayfield, Newbury, Seven Kings, and Valentines.
The constituency is bordered to the east by Dagenham and Rainham, to the south by Barking and to the north by Ilford North.
History
This constituency was created in 1945 and was in 1995, like the adjoining Ilford North seat, altered to contain slightly different electoral wards. The current MP is the fourth Labour Party MP, each of which has been interspersed by a period of a Conservative MP serving the area, however Mike Gapes the current MP is the longest incumbent of the seat, having held it since 1992.
Members of Parliament
Election results
Elections in 2010s
| Party | Candidate | Votes | % | ± | |
|---|---|---|---|---|---|
| Labour Co-op | Mike Gapes[4] | 33,232 | 64.0 | +14.6 | |
| Conservative | Christopher Chapman | 13,455 | 25.9 | −1.5 | |
| UKIP | Amjad Khan[5] | 2,705 | 5.2 | +3.0 | |
| Green | RoseMary Warrington[6] | 1,506 | 2.9 | +0.3 | |
| Liberal Democrat | Ashburn Holder | 1,014 | 2.0 | −15.0 | |
| Majority | 19,777 | 38.1 | +16.0 | ||
| Turnout | 51,912 | 56.4 | −1.6 | ||
| Labour hold | Swing | +8.1 | |||
| Party | Candidate | Votes | % | ± | |
|---|---|---|---|---|---|
| Labour Co-op | Mike Gapes | 25,311 | 49.4 | +0.6 | |
| Conservative | Toby Boutle | 14,014 | 27.4 | +0.1 | |
| Liberal Democrat | Anood Al-Samerai | 8,679 | 17.0 | −3.6 | |
| Green | Wilson Chowdhry | 1,319 | 2.6 | N/A | |
| UKIP | Terry Murray | 1,132 | 2.2 | +0.6 | |
| Save King George Hospital | John Jestico | 746 | 1.5 | N/A | |
| Majority | 11,297 | 22.1 | −0.5 | ||
| Turnout | 51,201 | 58.0 | +4.4 | ||
| Labour Co-op hold | Swing | +0.2 | |||
Elections in 2000s
| Party | Candidate | Votes | % | ± | |
|---|---|---|---|---|---|
| Labour Co-op | Mike Gapes | 20,856 | 48.9 | −10.7 | |
| Conservative | Stephen Metcalfe | 11,628 | 27.2 | +1.5 | |
| Liberal Democrat | Matthew E. Lake | 8,761 | 20.5 | +9.2 | |
| British Public Party | Kashif Rana | 763 | 1.8 | +1.8 | |
| UKIP | Colin H. Taylor | 685 | 1.6 | −1.8 | |
| Majority | 9,228 | 21.6 | |||
| Turnout | 42,693 | 53.6 | −0.7 | ||
| Labour Co-op hold | Swing | −6.1 | |||
| Party | Candidate | Votes | % | ± | |
|---|---|---|---|---|---|
| Labour Co-op | Mike Gapes | 24,619 | 59.6 | +1.1 | |
| Conservative | Suresh Kumar | 10,622 | 25.7 | −4.4 | |
| Liberal Democrat | Ralph John Scott | 4,647 | 11.3 | +5.0 | |
| UKIP | Harun Khan | 1,407 | 3.4 | N/A | |
| Majority | 13,997 | 33.9 | |||
| Turnout | 41,295 | 54.3 | −15.9 | ||
| Labour Co-op hold | Swing | ||||
Elections in 1990s
| Party | Candidate | Votes | % | ± | |
|---|---|---|---|---|---|
| Labour Co-op | Mike Gapes | 29,273 | 58.5 | +13.5 | |
| Conservative | Neil Thorne | 15,073 | 30.1 | −14.3 | |
| Liberal Democrat | Miss Aina Khan | 3,152 | 6.3 | −3.3 | |
| Referendum | David Hodges | 1,073 | 2.1 | N/A | |
| Socialist Labour | Bruce G. Ramsey | 868 | 1.7 | N/A | |
| BNP | Aron Owens | 580 | 1.2 | N/A | |
| Majority | 14,200 | 28.0 | |||
| Turnout | 50,019 | 70.2 | |||
| Labour Co-op hold | Swing | +13.9 | |||
| Party | Candidate | Votes | % | ± | |
|---|---|---|---|---|---|
| Labour Co-op | Mike Gapes | 19,418 | 45.4 | +7.9 | |
| Conservative | Neil Thorne | 19,016 | 44.4 | −4.0 | |
| Liberal Democrat | George G. Hogarth | 4,126 | 9.6 | −4.5 | |
| Natural Law | Nandkishore Bramachari | 269 | 0.6 | N/A | |
| Majority | 402 | 0.9 | |||
| Turnout | 42,829 | 76.7 | |||
| Labour Co-op gain from Conservative | Swing | +6.0 | |||
Elections in 1980s
| Party | Candidate | Votes | % | ± | |
|---|---|---|---|---|---|
| Conservative | Neil Thorne | 20,351 | 48.4 | +2.9 | |
| Labour | Kenneth Harry Jones | 15,779 | 37.5 | +3.1 | |
| Liberal | Ralph John Scott | 5,928 | 14.1 | −5.4 | |
| Majority | 4,572 | 10.9 | |||
| Turnout | 42,058 | 71.8 | |||
| Conservative hold | Swing | ||||
| Party | Candidate | Votes | % | ± | |
|---|---|---|---|---|---|
| Conservative | Neil Thorne | 18,672 | 45.5 | ||
| Labour | J.H. Hogben | 14,106 | 34.4 | ||
| Liberal | Ralph John Scott | 7,999 | 19.5 | ||
| BNP | R.A. Martin | 235 | 0.6 | ||
| Majority | 4,566 | 11.1 | |||
| Turnout | 41,012 | 70.6 | |||
| Conservative hold | Swing | ||||
Elections in 1970s
| Party | Candidate | Votes | % | ± | |
|---|---|---|---|---|---|
| Conservative | Neil Thorne | 19,290 | 46.8 | ||
| Labour | Arnold Shaw | 17,602 | 42.7 | ||
| Liberal | R.J.R. Scott | 3,664 | 8.9 | ||
| National Front | T.C. Fitzgerald | 636 | 1.5 | ||
| Majority | 1,688 | 4.1 | |||
| Turnout | 75.9 | ||||
| Conservative gain from Labour | Swing | ||||
| Party | Candidate | Votes | % | ± | |
|---|---|---|---|---|---|
| Labour | Arnold Shaw | 17,538 | 44.71 | ||
| Conservative | Neil Thorne | 15,789 | 40.25 | ||
| Liberal | E. Yates | 5,734 | 14.62 | ||
| More Prosperous Britain | Tom Keen | 169 | 0.43 | ||
| Majority | 1,749 | 4.46 | |||
| Turnout | 69.73 | ||||
| Labour hold | Swing | ||||
| Party | Candidate | Votes | % | ± | |
|---|---|---|---|---|---|
| Labour | Arnold Shaw | 17,201 | 40.07 | ||
| Conservative | Albert Cooper | 16,058 | 37.41 | ||
| Liberal | G. Wilson | 9,666 | 22.52 | ||
| Majority | 1,143 | 2.66 | |||
| Turnout | 76.93 | ||||
| Labour gain from Conservative | Swing | ||||
| Party | Candidate | Votes | % | ± | |
|---|---|---|---|---|---|
| Conservative | Albert Cooper | 18,369 | 46.25 | ||
| Labour | Arnold Shaw | 17,087 | 43.03 | ||
| Liberal | G.L. Wilson | 3,341 | 8.41 | ||
| National Front | M.E.L. Skeggs | 727 | 1.83 | ||
| Independent | M.J. Marks | 190 | 0.48 | ||
| Majority | 1,282 | 3.23 | |||
| Turnout | 68.13 | ||||
| Conservative gain from Labour | Swing | ||||
Elections in 1960s
| Party | Candidate | Votes | % | ± | |
|---|---|---|---|---|---|
| Labour | Arnold Shaw | 20,613 | 47.59 | ||
| Conservative | Albert Cooper | 18,093 | 41.77 | ||
| Liberal | I. Watson | 4,606 | 10.63 | ||
| Majority | 2,520 | 5.82 | |||
| Turnout | 76.93 | ||||
| Labour gain from Conservative | Swing | ||||
| Party | Candidate | Votes | % | ± | |
|---|---|---|---|---|---|
| Conservative | Albert Cooper | 18,352 | 42.13 | ||
| Labour | Arnold Shaw | 16,659 | 38.25 | ||
| Liberal | P. McGregor | 8,547 | 19.62 | ||
| Majority | 1,693 | 3.89 | |||
| Turnout | 75.01 | ||||
| Conservative hold | Swing | ||||
Elections in 1950s
| Party | Candidate | Votes | % | ± | |
|---|---|---|---|---|---|
| Conservative | Albert Cooper | 23,876 | 50.50 | ||
| Labour | Gordon Johnson Borrie | 16,569 | 35.05 | ||
| Liberal | Raymond V Netherclift | 6,832 | 14.45 | ||
| Majority | 7,307 | 15.46 | |||
| Turnout | 77.91 | ||||
| Conservative hold | Swing | ||||
| Party | Candidate | Votes | % | ± | |
|---|---|---|---|---|---|
| Conservative | Albert Cooper | 27,292 | 56.73 | ||
| Labour | Jim Ranger | 20,814 | 43.27 | ||
| Majority | 6,478 | 13.47 | |||
| Turnout | 75.32 | ||||
| Conservative hold | Swing | ||||
| Party | Candidate | Votes | % | ± | |
|---|---|---|---|---|---|
| Conservative | Albert Cooper | 30,177 | 54.75 | ||
| Labour | Jim Ranger | 24,938 | 45.25 | ||
| Majority | 5,239 | 9.51 | |||
| Turnout | 82.66 | ||||
| Conservative hold | Swing | ||||
| Party | Candidate | Votes | % | ± | |
|---|---|---|---|---|---|
| Conservative | Albert Cooper | 28,087 | 49.51 | ||
| Labour | Jim Ranger | 23,558 | 41.53 | ||
| Liberal | Ronald Acott Hall | 4,170 | 7.35 | ||
| Communist | D. Kelly | 913 | 1.61 | ||
| Majority | 4,529 | 7.98 | |||
| Turnout | 85.37 | ||||
| Conservative gain from Labour | Swing | ||||
Election in 1940s
| Party | Candidate | Votes | % | ± | |
|---|---|---|---|---|---|
| Labour | Jim Ranger | 19,339 | 48.0 | N/A | |
| Conservative | E.J. Boulton | 14,633 | 36.3 | N/A | |
| Liberal | Eric Arthur Holloway | 6,322 | 15.7 | N/A | |
| Majority | 4,706 | 11.7 | |||
| Turnout | 71.1 | ||||
| Labour win (new seat) | |||||
See also
Notes and references
- Notes
- ↑ A borough constituency (for the purposes of election expenses and type of returning officer)
- ↑ As with all constituencies, the constituency elects one Member of Parliament (MP) by the first past the post system of election at least every five years.
- References
- ↑ "Electorate Figures - Boundary Commission for England". 2011 Electorate Figures. Boundary Commission for England. 4 March 2011. Retrieved 13 March 2011.
- ↑ Leigh Rayment's Historical List of MPs – Constituencies beginning with "I"
- ↑ "Election Data 2015". Electoral Calculus. Archived from the original on 17 October 2015. Retrieved 17 October 2015.
- ↑ http://electionresults.blogspot.co.uk/2013/04/ilford-south-2015.html
- ↑ http://www.ilfordrecorder.co.uk/home/election-2015
- ↑ https://my.greenparty.org.uk/candidates/106014
- ↑ General Election Results from the Electoral Commission
- ↑ http://www.redbridge.gov.uk/cms/the_council/council_people_and_elections/elections/idoc.ashx?docid=bf22ed34-8ff1-4a9c-aba6-5d28172678b1&version=-1
| Districts |  | |
|---|---|---|
| Attractions |
| |
| Constituencies | ||
| Parks and open spaces |
| |
| Tube and rail stations | ||
| Other topics | ||
Coordinates: 51°33′50″N 0°05′10″E / 51.564°N 0.086°E