York Centre
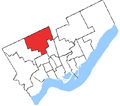
.png) York Centre in relation to the other Toronto ridings (2013 boundaries) | |||
| Federal electoral district | |||
| Legislature | House of Commons | ||
| MP |
| ||
| District created | 1952 | ||
| First contested | 1953 | ||
| Last contested | 2015 | ||
| District webpage | profile, map | ||
| Demographics | |||
| Population (2011)[1] | 100,277 | ||
| Electors (2015) | 63,682 | ||
| Area (km²)[2] | 37 | ||
| Pop. density (per km²) | 2,710.2 | ||
| Census divisions | Toronto | ||
| Census subdivisions | Toronto | ||
.gif)
York Centre (French: York-Centre) is a federal electoral district in Ontario, Canada, that has been represented in the Canadian House of Commons from 1904 to 1917 and since 1953.
The riding was previously considered one of the safest Liberal Party seats in Canada; however, this changed as the Conservative Party has gained ground the last few elections, and its candidate Mark Adler won the seat in 2011. However, the Liberal Party regained the seat in 2015 with its candidate Michael Levitt.
Geography
York Centre consists of the part of the City of Toronto bounded on the north by the northern city limit, and on the east, south and west by a line drawn from the city limit south along Yonge Street, west along the hydroelectric transmission line north of Finch Avenue West, south along Bathurst Street, southeast along the Don River West Branch, southwest and west along Highway 401, north along Jane Street, east along Sheppard Avenue West, northwest along Black Creek, east along Grandravine Drive, and north along Keele Street to the city limit.
It contains the neighbourhoods of Westminster–Branson, Bathurst Manor, Wilson Heights, Downsview, and York University Heights (a small section south of Grandravine Drive, east of Black Creek).
History
York Centre was originally created in 1903 from parts of York East and York West ridings. It was created when the county of York (excluding the city of Toronto) was divided into three ridings: York Centre, York North and York South. The centre riding consisted of the townships of Etobicoke, Markham, Scarborough and Vaughan, and the villages of Markham, Richmond Hill, Weston and Woodbridge. The electoral district was abolished in 1914 when it was redistributed between York East, York South and York West. In 1952, York Centre was re-designated with parts of Eglinton—Lawrence, Willowdale, York North and York West ridings.
The new riding consisted initially of the part of the township of North York west of Yonge Street, the part of the township of Vaughan south of Highway Number 7, and the town of Woodbridge.
In 1966, it was redefined to consist of the part of Metropolitan Toronto bounded on the north by the northern limit, and on the west, south and east by a line drawn from that borough limit south along Highway 400, east along Sheppard Avenue West, south along Jane Street, southeast along Exbury Road, east along Calvington Drive, south along Keele Street, east along Highway 401, south along the Canadian National Railway line, east along Lawrence Avenue West, north along the Spadina Expressway, northeast along Highway 401, north along Bathurst Street, east along Sheppard Avenue West, south along Easton Street, east along Cameron Avenue, and north along Yonge Street to the Metro Toronto limit.
In 1976, it was redefined to consist of the part of the Borough of North York bounded on the north by the borough limit, and on the west, south and east by a line drawn from the borough limit south along Highway 400, east along Sheppard Avenue West, south along Keele Street, east along Highway 401, north along Bathurst Street, and northwest along the West Branch of the Don River to the borough limit.
In 1987, it was redefined to consist of the part of the City of North York bounded on the north by the city limit, and on the east, south and west by a line drawn from the city limit southeast along the Don River West Branch, west along Highway 401, north along Jane Street, east along Grandravine Drive, and north along Black Creek to the northern city limit.
In 1996, it was redefined to consist of the part of the City of North York bounded on the north by the city limit, and on the east, south and west by a line drawn from the city limit south along Dufferin Street, west along Sheppard Avenue West, north along Keele Street, west along Grandravine Drive, south along Jane Street, east along Highway 401, northwest along the Don River West Branch, north along Bathurst Street, east along Drewry Avenue, north along Chelmsford Avenue, west along Greenwin Village Road, and north along Village Gate to the city limit.
In 2003, it was given its current boundaries as described above.
This riding lost territory to Willowdale and a small piece to Thornhill during the 2012 electoral redistribution.
Former boundaries
-
1976 to 1976
-

1976 to 1987
-

1987 to 1996
-

1996 to 2003
-

2003 to 2015
Members of Parliament
This riding has elected the following Members of Parliament:
| Parliament | Years | Member | Party | |
|---|---|---|---|---|
| York Centre Riding created from York East and York West |
||||
| 10th | 1904–1907 | Archibald Campbell | Liberal | |
| 1907–1908 | Peter Douglas McLean | |||
| 11th | 1908–1911 | Thomas George Wallace | Conservative | |
| 12th | 1911–1917 | |||
| Riding dissolved into York East and York South | ||||
| Riding re-created from Eglinton—Lawrence, Willowdale, York North and York West |
||||
| 22nd | 1953–1957 | Al Hollingworth | Liberal | |
| 23rd | 1957–1958 | Fred C. Stinson | Progressive Conservative | |
| 24th | 1958–1962 | |||
| 25th | 1962–1963 | James Edgar Walker | Liberal | |
| 26th | 1963–1965 | |||
| 27th | 1965–1968 | |||
| 28th | 1968–1972 | |||
| 29th | 1972–1974 | Bob Kaplan | ||
| 30th | 1974–1979 | |||
| 31st | 1979–1980 | |||
| 32nd | 1980–1984 | |||
| 33rd | 1984–1988 | |||
| 34th | 1988–1993 | |||
| 35th | 1993–1997 | Art Eggleton | ||
| 36th | 1997–2000 | |||
| 37th | 2000–2004 | |||
| 38th | 2004–2006 | Ken Dryden | ||
| 39th | 2006–2008 | |||
| 40th | 2008–2011 | |||
| 41st | 2011–2015 | Mark Adler | Conservative | |
| 42nd | 2015–Present | Michael Levitt | Liberal | |
Election results
1953-present
| Canadian federal election, 2015 | ||||||||
|---|---|---|---|---|---|---|---|---|
| Party | Candidate | Votes | % | ∆% | Expenditures | |||
| Liberal | Michael Levitt | 20,131 | 46.88 | +13.64 | – | |||
| Conservative | Mark Adler | 18,893 | 43.99 | -4.54 | – | |||
| New Democratic | Hal Berman | 3,148 | 7.33 | -8.56 | – | |||
| Green | Constantine Kritsonis | 772 | 1.80 | -0.54 | – | |||
| Total valid votes/Expense limit | 42,944 | 100.00 | $198,299.74 | |||||
| Total rejected ballots | 319 | 0.74 | – | |||||
| Turnout | 43,263 | 67.29 | – | |||||
| Eligible voters | 64,297 | |||||||
| Liberal gain from Conservative | Swing | +9.09 | ||||||
| Source: Elections Canada[3][4][5] | ||||||||
| 2011 federal election redistributed results[6] | |||
|---|---|---|---|
| Party | Vote | % | |
| Conservative | 17,249 | 48.53 | |
| Liberal | 11,814 | 33.24 | |
| New Democratic | 5,649 | 15.89 | |
| Green | 831 | 2.34 | |
| Canadian federal election, 2011 | ||||||||
|---|---|---|---|---|---|---|---|---|
| Party | Candidate | Votes | % | ∆% | Expenditures | |||
| Conservative | Mark Adler | 20,356 | 48.5 | +10.5 | $79,794.56 | |||
| Liberal | Ken Dryden | 13,979 | 33.3 | -10.2 | $73,675.98 | |||
| New Democratic | Nick Brownlee | 6,656 | 15.9 | +3.8 | $409.63 | |||
| Green | Rosemary Frei | 979 | 2.3 | -4.1 | $342.41 | |||
| Total valid votes/Expense limit | 41,970 | 100.0 | $83,892.08 | |||||
| Total rejected ballots | 350 | 0.1 | – | |||||
| Turnout | 42,320 | 60.3 | +7.6 | |||||
| Eligible voters | 70,216 | – | – | |||||
| Canadian federal election, 2008 | ||||||||
|---|---|---|---|---|---|---|---|---|
| Party | Candidate | Votes | % | ∆% | Expenditures | |||
| Liberal | Ken Dryden | 16,164 | 43.5 | -9.2 | $70,386 | |||
| Conservative | Rochelle Wilner | 14,132 | 38.0 | +7.9 | $78,946 | |||
| New Democratic | Kurtis Baily | 4,503 | 12.1 | -1.7 | ||||
| Green | Rosemary Frei | 2,390 | 6.4 | +3.8 | $3,440 | |||
| Total valid votes/Expense limit | 37,189 | 100.0 | $81,864 | |||||
| Total rejected ballots | – | |||||||
| Turnout | – | 52.7 | ||||||
| Canadian federal election, 2006 | ||||||||
|---|---|---|---|---|---|---|---|---|
| Party | Candidate | Votes | % | ∆% | Expenditures | |||
| Liberal | Ken Dryden | 22,439 | 52.7 | -2.1 | $74,395.87 | |||
| Conservative | Michael Mostyn | 12,758 | 30.0 | +3.7 | $69,571.51 | |||
| New Democratic | Marco Iacampo | 5,834 | 13.7 | 0 | $13,721.44 | |||
| Green | Constantine Kritsonis | 1,558 | 3.7 | +0.5 | $1,644.87 | |||
| Total valid votes | 42,589 | |||||||
| Canadian federal election, 2004 | ||||||||
|---|---|---|---|---|---|---|---|---|
| Party | Candidate | Votes | % | ∆% | Expenditures | |||
| Liberal | Ken Dryden | 21,520 | 54.8 | -16.3 | $64,620 | |||
| Conservative | Michael Mostyn | 10,318 | 26.3 | – | $72,837 | |||
| New Democratic | Peter Flaherty | 5,376 | 13.7 | +7.7 | $10,017 | |||
| Green | Constantine Kritsonis | 1,240 | 3.2 | +1.7 | ||||
| Independent | Max Royz | 824 | 2.1 | – | $23,589 | |||
| Total valid votes | 39,278 | |||||||
| Canadian federal election, 2000 | ||||||||
|---|---|---|---|---|---|---|---|---|
| Party | Candidate | Votes | % | ∆% | Expenditures | |||
| Liberal | Art Eggleton | 24,793 | 71.1 | -1.0 | $56,516 | |||
| Alliance | Jeffrey Dorfman | 4,630 | 13.3 | – | $19,703 | |||
| Progressive Conservative | Mark Tweyman | 2,518 | 7.2 | -1.4 | $1,280 | |||
| New Democratic | Maurice Coulter | 2,104 | 6.0 | -3.4 | $8,831 | |||
| Green | Constantine Kritsonis | 532 | 1.5 | +0.5 | $2,401 | |||
| Communist | Christopher Black | 163 | 0.5 | – | $202 | |||
| Marxist–Leninist | Diane Johnston | 142 | 0.4 | 0 | $8 | |||
| Total valid votes | 34,882 | |||||||
| Canadian federal election, 1997 | ||||||||
|---|---|---|---|---|---|---|---|---|
| Party | Candidate | Votes | % | ∆% | ||||
| Liberal | Art Eggleton | 27,864 | 72.1 | +2.4 | ||||
| New Democratic | Mark Berardo | 3,618 | 9.4 | +5.4 | ||||
| Progressive Conservative | Anthony Figliano | 3,323 | 8.6 | +1.7 | ||||
| Reform | Anthony Chol | 2,876 | 7.4 | +1.9 | ||||
| Green | Constantine Kritsonis | 389 | 1.0 | +0.4 | ||||
| Natural Law | Mike Dubinsky | 242 | 0.6 | 0 | ||||
| Canadian Action | Jozef Izsak | 186 | 0.5 | – | ||||
| Marxist–Leninist | Diane Johnston | 168 | 0.4 | +0.2 | ||||
| Total valid votes | 38,666 | |||||||
| Canadian federal election, 1993 | ||||||||
|---|---|---|---|---|---|---|---|---|
| Party | Candidate | Votes | % | ∆% | ||||
| Liberal | Art Eggleton | 27,150 | 69.7 | +9.2 | ||||
| Independent | Peter Li Preti | 3,918 | 10.1 | – | ||||
| Progressive Conservative | George Tsiolis | 2,688 | 6.9 | -15.5 | ||||
| Reform | John Beck | 2,141 | 5.5 | – | ||||
| New Democratic | Israel Ellis | 1,557 | 4.0 | -11.4 | ||||
| National | Kurt Loeb | 734 | 1.9 | – | ||||
| Natural Law | Linda Dubé | 253 | 0.6 | – | ||||
| Green | Alan Jones | 216 | 0.6 | – | ||||
| Libertarian | Douglas Quinn | 174 | 0.4 | -1.3 | ||||
| Marxist–Leninist | Diane Johnston | 83 | 0.2 | – | ||||
| Abolitionist | Randy Armour | 60 | 0.2 | – | ||||
| Total valid votes | 38,974 | |||||||
| Canadian federal election, 1988 | ||||||||
|---|---|---|---|---|---|---|---|---|
| Party | Candidate | Votes | % | ∆% | ||||
| Liberal | Bob Kaplan | 24,962 | 60.5 | +9.3 | ||||
| Progressive Conservative | Rocco Sebastiano | 9,248 | 22.4 | -5.0 | ||||
| New Democratic | Cathy Mele | 6,350 | 15.4 | -4.4 | ||||
| Libertarian | David Kenny | 683 | 1.7 | +1.1 | ||||
| Total valid votes | 41,243 | |||||||
| Canadian federal election, 1984 | ||||||||
|---|---|---|---|---|---|---|---|---|
| Party | Candidate | Votes | % | ∆% | ||||
| Liberal | Bob Kaplan | 20,810 | 51.2 | -9.8 | ||||
| Progressive Conservative | Mike Cohen | 11,138 | 27.4 | +9.6 | ||||
| New Democratic | Van Newell | 8,037 | 19.8 | -0.5 | ||||
| Libertarian | Simon Srdarev | 244 | 0.6 | -0.1 | ||||
| Independent | Sol Roter | 226 | 0.6 | – | ||||
| Independent | Bonnie J. Geddes | 203 | 0.5 | – | ||||
| Total valid votes | 40,658 | |||||||
| Canadian federal election, 1980 | ||||||||
|---|---|---|---|---|---|---|---|---|
| Party | Candidate | Votes | % | ∆% | ||||
| Liberal | Bob Kaplan | 23,116 | 61.0 | +9.7 | ||||
| New Democratic | Cris Liscio | 7,696 | 20.3 | -5.4 | ||||
| Progressive Conservative | Anne Silverman | 6,736 | 17.8 | -4.0 | ||||
| Libertarian | Sheldon Gold | 284 | 0.7 | +0.1 | ||||
| Marxist–Leninist | Jeffery Forest | 86 | 0.2 | 0 | ||||
| Total valid votes | 37,918 | |||||||
| Canadian federal election, 1979 | ||||||||
|---|---|---|---|---|---|---|---|---|
| Party | Candidate | Votes | % | ∆% | ||||
| Liberal | Bob Kaplan | 20,859 | 51.3 | +0.6 | ||||
| New Democratic | Vince Del Buono | 10,464 | 25.7 | +2.2 | ||||
| Progressive Conservative | Bill Schiavono | 8,856 | 21.8 | -3.1 | ||||
| Libertarian | Shannon Vale | 229 | 0.6 | – | ||||
| Independent | Victor Heyn | 97 | 0.2 | – | ||||
| Marxist–Leninist | Jeffery Forest | 81 | 0.2 | 0 | ||||
| Communist | Gerrit van Houten | 63 | 0.2 | 0 | ||||
| Total valid votes | 40,649 | |||||||
| Canadian federal election, 1974 | ||||||||
|---|---|---|---|---|---|---|---|---|
| Party | Candidate | Votes | % | ∆% | ||||
| Liberal | Bob Kaplan | 32,402 | 50.7 | +8.8 | ||||
| Progressive Conservative | Barry Swadron | 15,877 | 24.9 | -4.9 | ||||
| New Democratic | Michael Copeland | 14,992 | 23.5 | -4.3 | ||||
| Independent | John J. de Niet | 191 | 0.3 | – | ||||
| Social Credit | Roger Drouin | 169 | 0.3 | – | ||||
| Marxist–Leninist | Rick Hundal | 129 | 0.2 | – | ||||
| Communist | Tom Morris | 123 | 0.2 | – | ||||
| Total valid votes | 63,883 | |||||||
| Canadian federal election, 1972 | ||||||||
|---|---|---|---|---|---|---|---|---|
| Party | Candidate | Votes | % | ∆% | ||||
| Liberal | James E. Walker | 26,912 | 41.9 | -14.7 | ||||
| Progressive Conservative | Barry Swadron | 19,097 | 29.8 | +17.5 | ||||
| New Democratic | Michael Copeland | 17,837 | 27.8 | -3.3 | ||||
| Independent | Harold Sparks | 189 | 0.3 | – | ||||
| Independent | George Paxton | 153 | 0.2 | – | ||||
| Total valid votes | 64,188 | |||||||
| Canadian federal election, 1968 | ||||||||
|---|---|---|---|---|---|---|---|---|
| Party | Candidate | Votes | % | ∆% | ||||
| Liberal | James E. Walker | 26,758 | 56.6 | +10.2 | ||||
| New Democratic | Douglas Fisher | 14,714 | 31.1 | -5.0 | ||||
| Progressive Conservative | Donald Stirling | 5,804 | 12.3 | -4.8 | ||||
| Total valid votes | 47,276 | |||||||
| Canadian federal election, 1965 | ||||||||
|---|---|---|---|---|---|---|---|---|
| Party | Candidate | Votes | % | ∆% | ||||
| Liberal | James E. Walker | 41,553 | 46.4 | -3.7 | ||||
| New Democratic | Val Scott | 32,352 | 36.1 | +1.7 | ||||
| Progressive Conservative | Fred C. Stinson | 15,301 | 17.1 | +1.6 | ||||
| Independent | Malcolm Cairnduff | 302 | 0.3 | – | ||||
| Total valid votes | 89,508 | |||||||
| Canadian federal election, 1963 | ||||||||
|---|---|---|---|---|---|---|---|---|
| Party | Candidate | Votes | % | ∆% | ||||
| Liberal | James E. Walker | 41,485 | 50.1 | +12.0 | ||||
| New Democratic | Val Scott | 28,505 | 34.4 | +0.1 | ||||
| Progressive Conservative | Bill Durovic | 12,807 | 15.5 | -11.2 | ||||
| Total valid votes | 82,797 | |||||||
| Canadian federal election, 1962 | ||||||||
|---|---|---|---|---|---|---|---|---|
| Party | Candidate | Votes | % | ∆% | ||||
| Liberal | James E. Walker | 30,432 | 38.1 | +5.1 | ||||
| New Democratic | Val Scott | 27,369 | 34.3 | +20.6 | ||||
| Progressive Conservative | Fred C. Stinson | 21,343 | 26.7 | -26.6 | ||||
| Social Credit | David H. Horwood | 746 | 0.9 | – | ||||
| Total valid votes | 79,890 | |||||||
| Canadian federal election, 1958 | ||||||||
|---|---|---|---|---|---|---|---|---|
| Party | Candidate | Votes | % | ∆% | ||||
| Progressive Conservative | Fred C. Stinson | 30,764 | 53.3 | +5.9 | ||||
| Liberal | Al Hollingworth | 19,065 | 33.0 | -1.4 | ||||
| Co-operative Commonwealth | Larry Sheffe | 7,888 | 13.7 | -2.9 | ||||
| Total valid votes | 57,717 | |||||||
| Canadian federal election, 1957 | ||||||||
|---|---|---|---|---|---|---|---|---|
| Party | Candidate | Votes | % | ∆% | ||||
| Progressive Conservative | Fred C. Stinson | 23,295 | 47.4 | +11.9 | ||||
| Liberal | Al Hollingworth | 16,925 | 34.4 | -9.7 | ||||
| Co-operative Commonwealth | Roy Begley | 8,164 | 16.6 | -2.3 | ||||
| Social Credit | Rod Gorrill | 777 | 1.6 | – | ||||
| Total valid votes | 49,161 | |||||||
| Canadian federal election, 1953 | ||||||||
|---|---|---|---|---|---|---|---|---|
| Party | Candidate | Votes | % | ∆% | ||||
| Liberal | Al Hollingworth | 13,903 | 44.1 | – | ||||
| Progressive Conservative | Roy Thomson | 11,180 | 35.5 | – | ||||
| Co-operative Commonwealth | William Newcombe | 5,960 | 18.9 | – | ||||
| Labor–Progressive | David Kashtan | 483 | 1.5 | – | ||||
| Total valid votes | 31,526 | |||||||
1904-1917
| Canadian federal election, 1911 | ||||||||
|---|---|---|---|---|---|---|---|---|
| Party | Candidate | Votes | % | ∆% | ||||
| Conservative | Thomas George Wallace | 2,838 | 54.9 | +4.5 | ||||
| Liberal | Herbert Hartly Dewart | 2,328 | 45.1 | -4.5 | ||||
| Total valid votes | 5,166 | 100.0 | ||||||
| Canadian federal election, 1908 | ||||||||
|---|---|---|---|---|---|---|---|---|
| Party | Candidate | Votes | % | ∆% | ||||
| Conservative | Thomas George Wallace | 2,614 | 50.4 | +0.7 | ||||
| Liberal | Peter Douglas McLean | 2,569 | 49.6 | -0.7 | ||||
| Total valid votes | 5,183 | 100.0 | ||||||
| Canadian federal by-election, 23 December 1907 | ||||||||
|---|---|---|---|---|---|---|---|---|
| Party | Candidate | Votes | % | ∆% | ||||
| On Mr. Campbell being called to the Senate, 22 November 1907 | ||||||||
| Liberal | Peter Douglas McLean | 2,282 | 50.3 | -0.6 | ||||
| Conservative | T.G. Wallace | 2,256 | 49.7 | +0.6 | ||||
| Total valid votes | 4,538 | 100.0 | ||||||
| Canadian federal election, 1904 | ||||||||
|---|---|---|---|---|---|---|---|---|
| Party | Candidate | Votes | % | |||||
| Liberal | Archibald Campbell | 2,222 | 50.9 | |||||
| Conservative | W.H. Pugsley | 2,146 | 49.1 | |||||
| Total valid votes | 4,368 | 100.0 | ||||||
See also
References
- "(Code 35103) Census Profile". 2011 census. Statistics Canada. 2012. Retrieved 2011-03-03.
Notes
External links
- Riding history 1903-1914 from the Library of Parliament
- Riding history 1952-2008 from the Library of Parliament
- Elections Canada profile
- Statistics Canada profile
- Campaign expense data from Elections Canada
| North: Thornhill | ||
| West: York West | York Centre | East: Willowdale |
| South: Eglinton—Lawrence, York South—Weston |
Coordinates: 43°45′46″N 79°26′44″W / 43.7627°N 79.4456°W