Canadian federal election, 1963
| | |||||||||||||||||||||||||||||||||||||||||||||||||||||||||||||||||||||||||||||||||||||||||||
| |||||||||||||||||||||||||||||||||||||||||||||||||||||||||||||||||||||||||||||||||||||||||||
| |||||||||||||||||||||||||||||||||||||||||||||||||||||||||||||||||||||||||||||||||||||||||||
|
| |||||||||||||||||||||||||||||||||||||||||||||||||||||||||||||||||||||||||||||||||||||||||||
| |||||||||||||||||||||||||||||||||||||||||||||||||||||||||||||||||||||||||||||||||||||||||||

The Canadian federal election of 1963 was held on April 8 to elect members of the Canadian House of Commons of the 26th Parliament of Canada. It resulted in the defeat of the minority Progressive Conservative (Tory) government of Prime Minister John Diefenbaker. For Social Credit, despite getting their highest ever share of the vote, the party lost 6 seats compared to its high-water mark in 1962.

Overview
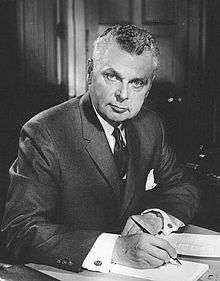
During the Tories' last year in office, members of the Diefenbaker Cabinet attempted to remove him from the leadership of the party, and therefore from the Prime Minister's office. In addition to concern within the party about Diefenbaker's mercurial style of leadership, there had been a serious split in party ranks over the issue of stationing American nuclear missiles (see Bomarc missile) on Canadian soil for protection from possible Soviet attack. Diefenbaker and his allies opposed this proposal, while many other Conservatives and the opposition Liberal Party were in favour. Minister of National Defence Douglas Harkness resigned from Cabinet on February 4, 1963, because of Diefenbaker's opposition to accepting the missiles. The next day, the government lost two non-confidence motions on the issue, prompting the election.
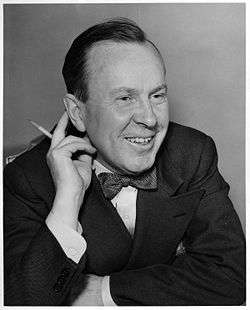
The Liberal Party of Lester Pearson ran on a platform promising that, if elected, they would begin their term with "60 Days of Decision" on questions such as introducing a new Canadian flag, reforming health care, and a public pension plan, along with other legislative reforms.
Despite winning 41% of the vote, which is usually sufficient for ensuring the election of a majority government, the Liberals fell five seats short of their target. The Liberals formed a minority government that was dependent on the support of the social democratic New Democratic Party (NDP) in order to pass legislation.
The social-democratic NDP had been formed in 1961 by a socialist party, the Co-operative Commonwealth Federation, and by the Canadian Labour Congress. The 1963 election was the second vote contested by the NDP. The party won slightly fewer votes, and two fewer seats, than they had received in the 1962 election. They were again disappointed by the failure of their new partnership with the labour movement to produce an electoral breakthrough, particularly in the province of Ontario, which has the largest population and the largest number of seats in the House of Commons.
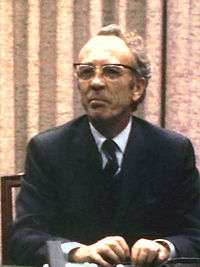
Social Credit was unable to increase its representation in western Canada, and lost four of its Quebec seats - this despite gaining a slightly better share of the vote compared to 1962. Indeed, 1963 represented the highest share Social Credit would ever get. The continuing lop-sided result led to a split in the party when Thompson refused to step aside so that Caouette could become party leader. Caouette and his followers left the Social Credit Party to sit as a separate social credit caucus, the Ralliement des créditistes.
National results
| ↓ | ||||
| 128 | 95 | 24 | 17 | 1 |
| Liberal | Progressive Conservative | SC | NDP | O |
| Party | Party leader | # of candidates |
Seats | Popular vote | |||||
|---|---|---|---|---|---|---|---|---|---|
| 1962 | Elected | % Change | # | % | pp Change | ||||
| Liberal | Lester Pearson | 265 | 99 | 128 | +29.3% | 3,276,996 | 41.48% | +4.51 | |
| Progressive Conservative | John Diefenbaker | 265 | 116 | 95 | -18.1% | 2,591,613 | 32.80% | -4.42 | |
| Social Credit | R.N. Thompson | 224 | 30 | 24 | -20.0% | 940,703 | 11.91% | +0.30 | |
| New Democrats | Tommy Douglas | 232 | 19 | 17 | -10.5% | 1,044,701 | 13.22% | -0.35 | |
| Liberal-Labour | 1 | 1 | 1 | - | 16,794 | 0.21% | +0.01 | ||
| Independent Liberal | 6 | - | - | - | 14,658 | 0.19% | +0.05 | ||
| Independent | 9 | - | - | - | 5,236 | 0.07% | -0.04 | ||
| Communist | Leslie Morris | 12 | - | - | - | 4,234 | 0.05% | -0.03 | |
| Independent PC | 2 | - | - | - | 1,965 | 0.02% | -0.01 | ||
| Independent Conservative | 2 | * | - | * | 1,159 | 0.01% | * | ||
| Ouvrier Indépendant | 1 | - | - | - | 1,064 | 0.01% | +0.01 | ||
| Independent Social Credit | 2 | * | - | * | 717 | 0.01% | * | ||
| Nationalist | 1 | * | - | * | 540 | 0.01% | * | ||
| Candidat libéral des electeurs | 1 | - | - | - | 496 | 0.01% | -0.02 | ||
| Socialist Labour | 1 | * | - | * | 43 | x | * | ||
| Total | 1,023 | 265 | 265 | - | 7,900,919 | 100% | |||
| Sources: http://www.elections.ca History of Federal Ridings since 1867 | |||||||||
Notes:
* The party did not nominate candidates in the previous election.
x - less than 0.005% of the popular vote
Vote and seat summaries
Results by province
| Party name | BC | AB | SK | MB | ON | QC | NB | NS | PE | NL | YK | NW | Total | ||
|---|---|---|---|---|---|---|---|---|---|---|---|---|---|---|---|
| Liberal | Seats: | 7 | 1 | - | 2 | 51 | 47 | 6 | 5 | 2 | 7 | - | - | 128 | |
| Popular Vote: | 32.3 | 22.1 | 24.1 | 33.8 | 45.8 | 45.6 | 47.3 | 46.7 | 46.4 | 64.5 | 41.0 | 43.2 | 41.5 | ||
| Progressive Conservative | Seats: | 4 | 14 | 17 | 10 | 27 | 8 | 4 | 7 | 2 | - | 1 | 1 | 95 | |
| Vote: | 23.4 | 45.3 | 53.7 | 42.3 | 35.0 | 19.5 | 40.4 | 46.9 | 52.0 | 30.1 | 49.6 | 56.8 | 32.8 | ||
| Social Credit | Seats: | 2 | 2 | - | - | - | 20 | - | - | - | 24 | ||||
| Vote: | 13.3 | 25.8 | 3.9 | 7.0 | 2.0 | 27.3 | 8.6 | 0.1 | 9.4 | 11.9 | |||||
| New Democrats | Seats: | 9 | - | - | 2 | 6 | - | - | - | - | - | 17 | |||
| Vote: | 30.3 | 6.5 | 18.2 | 16.7 | 16.2 | 7.1 | 3.7 | 6.4 | 1.6 | 4.2 | 13.2 | ||||
| Liberal-Labour | Seats: | 1 | 1 | ||||||||||||
| Vote: | 0.6 | 0.2 | |||||||||||||
| Total seats: | 22 | 17 | 17 | 14 | 85 | 75 | 10 | 12 | 4 | 7 | 1 | 1 | 265 | ||
| Parties that won no seats: | |||||||||||||||
| Independent Liberal | Vote: | 0.3 | 0.1 | 1.3 | 0.2 | ||||||||||
| Independent | Vote: | xx | 0.1 | xx | 0.2 | xx | 0.1 | 0.1 | |||||||
| Communist | Vote: | 0.1 | 0.1 | 0.1 | 0.1 | xx | 0.1 | ||||||||
| Independent PC | Vote: | xx | 0.1 | xx | |||||||||||
| Independent Conservative | Vote: | xx | xx | ||||||||||||
| Ouvrier Indépendant | Vote: | 0.1 | xx | ||||||||||||
| Independent Social Credit | Vote: | xx | xx | ||||||||||||
| Nationalist | Vote: | xx | xx | ||||||||||||
| C. l. des electeurs | Vote: | xx | xx | ||||||||||||
| Socialist Labour | Vote: | xx | xx | ||||||||||||
- xx - less than 0.05% of the popular vote
See also
- List of Canadian federal general elections
- List of political parties in Canada
- 26th Canadian Parliament
References
- ↑ Pomfret, R. "Voter Turnout at Federal Elections and Referendums". Elections Canada. Elections Canada. Retrieved 23 February 2014.