Canadian federal election, 1972
| | |||||||||||||||||||||||||||||||||||||||||||||||||||||||||||||||||||||||||||||||||||||||||||||||||
| |||||||||||||||||||||||||||||||||||||||||||||||||||||||||||||||||||||||||||||||||||||||||||||||||
| |||||||||||||||||||||||||||||||||||||||||||||||||||||||||||||||||||||||||||||||||||||||||||||||||
|
| |||||||||||||||||||||||||||||||||||||||||||||||||||||||||||||||||||||||||||||||||||||||||||||||||
| |||||||||||||||||||||||||||||||||||||||||||||||||||||||||||||||||||||||||||||||||||||||||||||||||
_cropped.jpg)


The Canadian federal election of 1972 was held on October 30, 1972, to elect members of the Canadian House of Commons of the 29th Parliament of Canada. It resulted in a slim victory for the governing Liberal Party, which won 109 seats, compared to 107 seats for the opposition Progressive Conservatives. A further 48 seats were won by other parties and independents. On election night, the results appeared to give 109 seats to the Tories, but once the counting had finished the next day, the final results gave the Liberals a minority government and left the New Democratic Party led by David Lewis holding the balance of power. See 29th Canadian parliament for a full list of MPs elected.
Overview
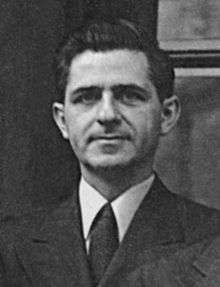
The election was the second fought by Liberal leader, Prime Minister Pierre Trudeau. The Liberals entered the election high in the polls, but the spirit of Trudeaumania had worn off, and a slumping economy hurt his party. The Tories were led by Robert Stanfield, the former premier of Nova Scotia, who had an honest but bumbling image. The Tories tried to capitalize on the public's perception that the Liberals were mismanaging the economy with the slogan, "A Progressive Conservative government will do better."
The Liberals campaigned on the slogan, "The Land is Strong", and television ads illustrating Canada's scenery. The slogan quickly became much derided, and the entire campaign is viewed as being one of the worst managed in recent decades. The party had developed few real issues to campaign on. One program that hurt the Liberals in many parts of the country was official bilingualism, which many English-Canadians viewed as an expensive waste of money.
Party platforms
Liberal Party:
- increase bilingualism in the civil service;
- re-introduce a bill controlling foreign take-overs of Canadian businesses;
- specialized programs to reduce unemployment;
- a program to expand and create new parks across Canada, including Toronto's "Harbourfront" and Mount Ste.-Anne Park near Quebec City;
- make-work programs to create jobs;
- reduce abuse of Unemployment Insurance; and
- incentives to reduce pollution.
Progressive Conservative Party:
- increase the discipline in government spending, and increase the power of the Auditor General to fight waste and inefficiency in government;
- ban strikes in essential services;
- introduce price and wage controls if necessary to control inflation;
- require foreign-owned companies operating in Canada to have a majority of Canadians on their boards of directors;
- introduce an incentive to encourage Canadians to invest in small businesses;
- develop a national economic strategy in co-operation with the provincial governments;
- expand re-training opportunities for unemployed workers;
- adjust tariffs to encourage secondary processing in Canada of Canada's natural resources;
- eliminate the 11% sales tax on building materials;
- eliminate 3% increase in personal income tax rates scheduled for January 1, 1973, and reduce rates by 4% on July 1, 1973;
- adjust old age security payments regularly to reflect changes in the cost of living;
- index tax brackets to inflation so that taxes do not rise as the cost of living rises;
- provide assistance to set up residential land banks to reduce the cost of housing.
New Democratic Party:
- eliminate 3% increase in personal income tax rates scheduled for January 1, 1973, and reduce rates by 8% for ordinary Canadians;
- introduce controls on prices and rents, but not on wages;
- create a $4300 million program to fund public works during winter months to reduce unemployment;
- increase old age security payments, but eliminate them for wealthy senior citizens;
- legislate greater autonomy for Canadian trade unions that are branches of international unions;
- tough tax laws for corporations;
- eliminate "corporate welfare", i.e., grants and subsidies for corporations, and use this money to build housing and transportation infrastructure, and fund municipal services to create jobs.
Social Credit Party:
- reform the monetary system in line with social credit theories;
- increase old age security payments to $200 per month beginning at age 60, and to $150 per month for spouses of seniors regardless of age.
National results

The voter turn-out was 76.7%.
One independent candidate was elected: Roch LaSalle was re-elected in his Quebec riding. LaSalle had left the PC caucus to protest the party's failure to recognize Quebec's right to self-determination, and was the only candidate to win the support of the separatist Parti Québécois.
One candidate with no affiliation was elected: Lucien Lamoureux, in the Ontario riding of Stomont-Dundas-Glengarry. Lamoureux, originally elected as a Liberal, had been serving as Speaker of the House of Commons. He ran without affiliation in order to preserve his impartiality as Speaker. He retired after this Parliament, and did not run in the 1974 election.
| ↓ | ||||
| 109 | 107 | 31 | 15 | 2 |
| Liberal | Progressive Conservative | NDP | SC | O |
| Party | Party leader | # of candidates |
Seats | Popular vote | ||||||
|---|---|---|---|---|---|---|---|---|---|---|
| 1968 | Dissolution | Elected | % Change | # | % | Change | ||||
| Liberal | Pierre Trudeau | 263 | 155 | 147 | 109 | -29.7% | 3,717,804 | 38.42% | -6.95pp | |
| Progressive Conservative | Robert Stanfield | 264 | 72 | 73 | 107 | +48.6% | 3,388,980 | 35.02% | +3.59pp | |
| New Democratic Party | David Lewis | 252 | 22 | 25 | 31 | +40.9% | 1,725,719 | 17.83% | +0.87pp | |
| Social Credit1 | Real Caouette | 164 | 14 | 15 | 15 | +7.1% | 730,759 | 7.55% | +2.27pp | |
| Independent2 | 53 | 1 | 2 | 1 | - | 56,685 | 0.59% | +0.14pp | ||
| No affiliation3 | 26 | 1 | 23,938 | 0.25% | ||||||
| Unknown | 93 | - | 32,013 | 0.33% | ||||||
| Rhinoceros4 | Cornelius I | 1 | - | - | - | - | 1,565 | 0.02% | +0.02pp | |
| Vacant | 4 | |||||||||
| Total | 1,117 | 264 | 264 | 264 | -0.4% | 9,677,463 | 100% | |||
| Sources: Elections Canada;History of Federal Ridings since 1867; Toronto Star, October 30, 1972 | ||||||||||
Notes:
"% change" refers to change from previous election
1 Indicates increase from total Social Credit + Ralliement creditiste seats/vote in 1968.
2 Roch LaSalle, who was elected in 1968 as a Progressive Conservative, won re-election as an independent.
3 Lucien Lamoureux who was elected as a Liberal but served as Speaker of the House, won re-election with no party affiliation.
4 The Rhinoceros Party ran a total of 12 candidates, but because it was not recognized by Elections Canada as a registered party, its candidates were listed as independents.
Vote and seat summaries
Results by province
| Party name | BC | AB | SK | MB | ON | QC | NB | NS | PE | NL | NT | YK | Total | ||
|---|---|---|---|---|---|---|---|---|---|---|---|---|---|---|---|
| Liberal | Seats: | 4 | - | 1 | 2 | 36 | 56 | 5 | 1 | 1 | 3 | - | - | 109 | |
| Popular Vote: | 28.9 | 25.0 | 25.3 | 30.9 | 38.2 | 48.9 | 43.1 | 33.9 | 40.5 | 44.8 | 29.3 | 32.2 | 38.4 | ||
| Progressive Conservative | Seats: | 8 | 19 | 7 | 8 | 40 | 2 | 5 | 10 | 3 | 4 | - | 1 | 107 | |
| Vote: | 33.0 | 57.6 | 36.9 | 41.6 | 39.1 | 17.4 | 46.8 | 53.4 | 51.9 | 49.0 | 30.9 | 53.0 | 35.0 | ||
| New Democratic Party | Seats: | 11 | - | 5 | 3 | 11 | - | - | - | - | - | 1 | - | 31 | |
| Vote: | 35.0 | 12.6 | 35.9 | 26.3 | 21.5 | 6.8 | 6.3 | 12.3 | 7.5 | 4.7 | 39.8 | 11.6 | 17.8 | ||
| Social Credit | Seats: | - | - | - | - | - | 15 | - | - | - | - | 15 | |||
| Vote: | 2.6 | 4.5 | 1.8 | 0.7 | 0.4 | 24.3 | 3.2 | 0.3 | 0.1 | 0.2 | 7.6 | ||||
| Independent | Seats: | - | - | - | - | - | 1 | - | - | - | 1 | ||||
| Vote: | 0.2 | xx | xx | 0.1 | 0.2 | 1.7 | 0.3 | 0.4 | 3.1 | 0.6 | |||||
| No affiliation | Seats: | - | - | - | - | 1 | - | - | 1 | ||||||
| Vote: | xx | 0.1 | xx | xx | 0.5 | 0.2 | xx | 0.2 | |||||||
| Total seats: | 23 | 19 | 13 | 13 | 88 | 74 | 10 | 11 | 4 | 7 | 1 | 1 | 264 | ||
| Parties that won no seats: | |||||||||||||||
| Unknown | Vote: | 0.1 | 0.2 | 0.1 | 0.3 | 0.1 | 0.7 | 0.4 | 0.1 | 0.9 | 0.3 | ||||
| Rhinoceros | Vote: | 0.1 | xx | ||||||||||||
xx - less than 0.05% of the popular vote
See also
- List of Canadian federal general elections
- List of political parties in Canada
- 29th Canadian Parliament
References
- ↑ Pomfret, R. "Voter Turnout at Federal Elections and Referendums". Elections Canada. Elections Canada. Retrieved 11 January 2014.